
Consumer spending at casual dining restaurant chains and food delivery companies experienced a dramatic rise during the COVID-19 pandemic. Using credit and debit card transaction data from the firm Facteus, we’ve got the numbers on how consumers across the U.S. have dined in and dashed food from various merchants over the past three years. Order up!
Spending Index: Popular U.S. Casual Dining Chains
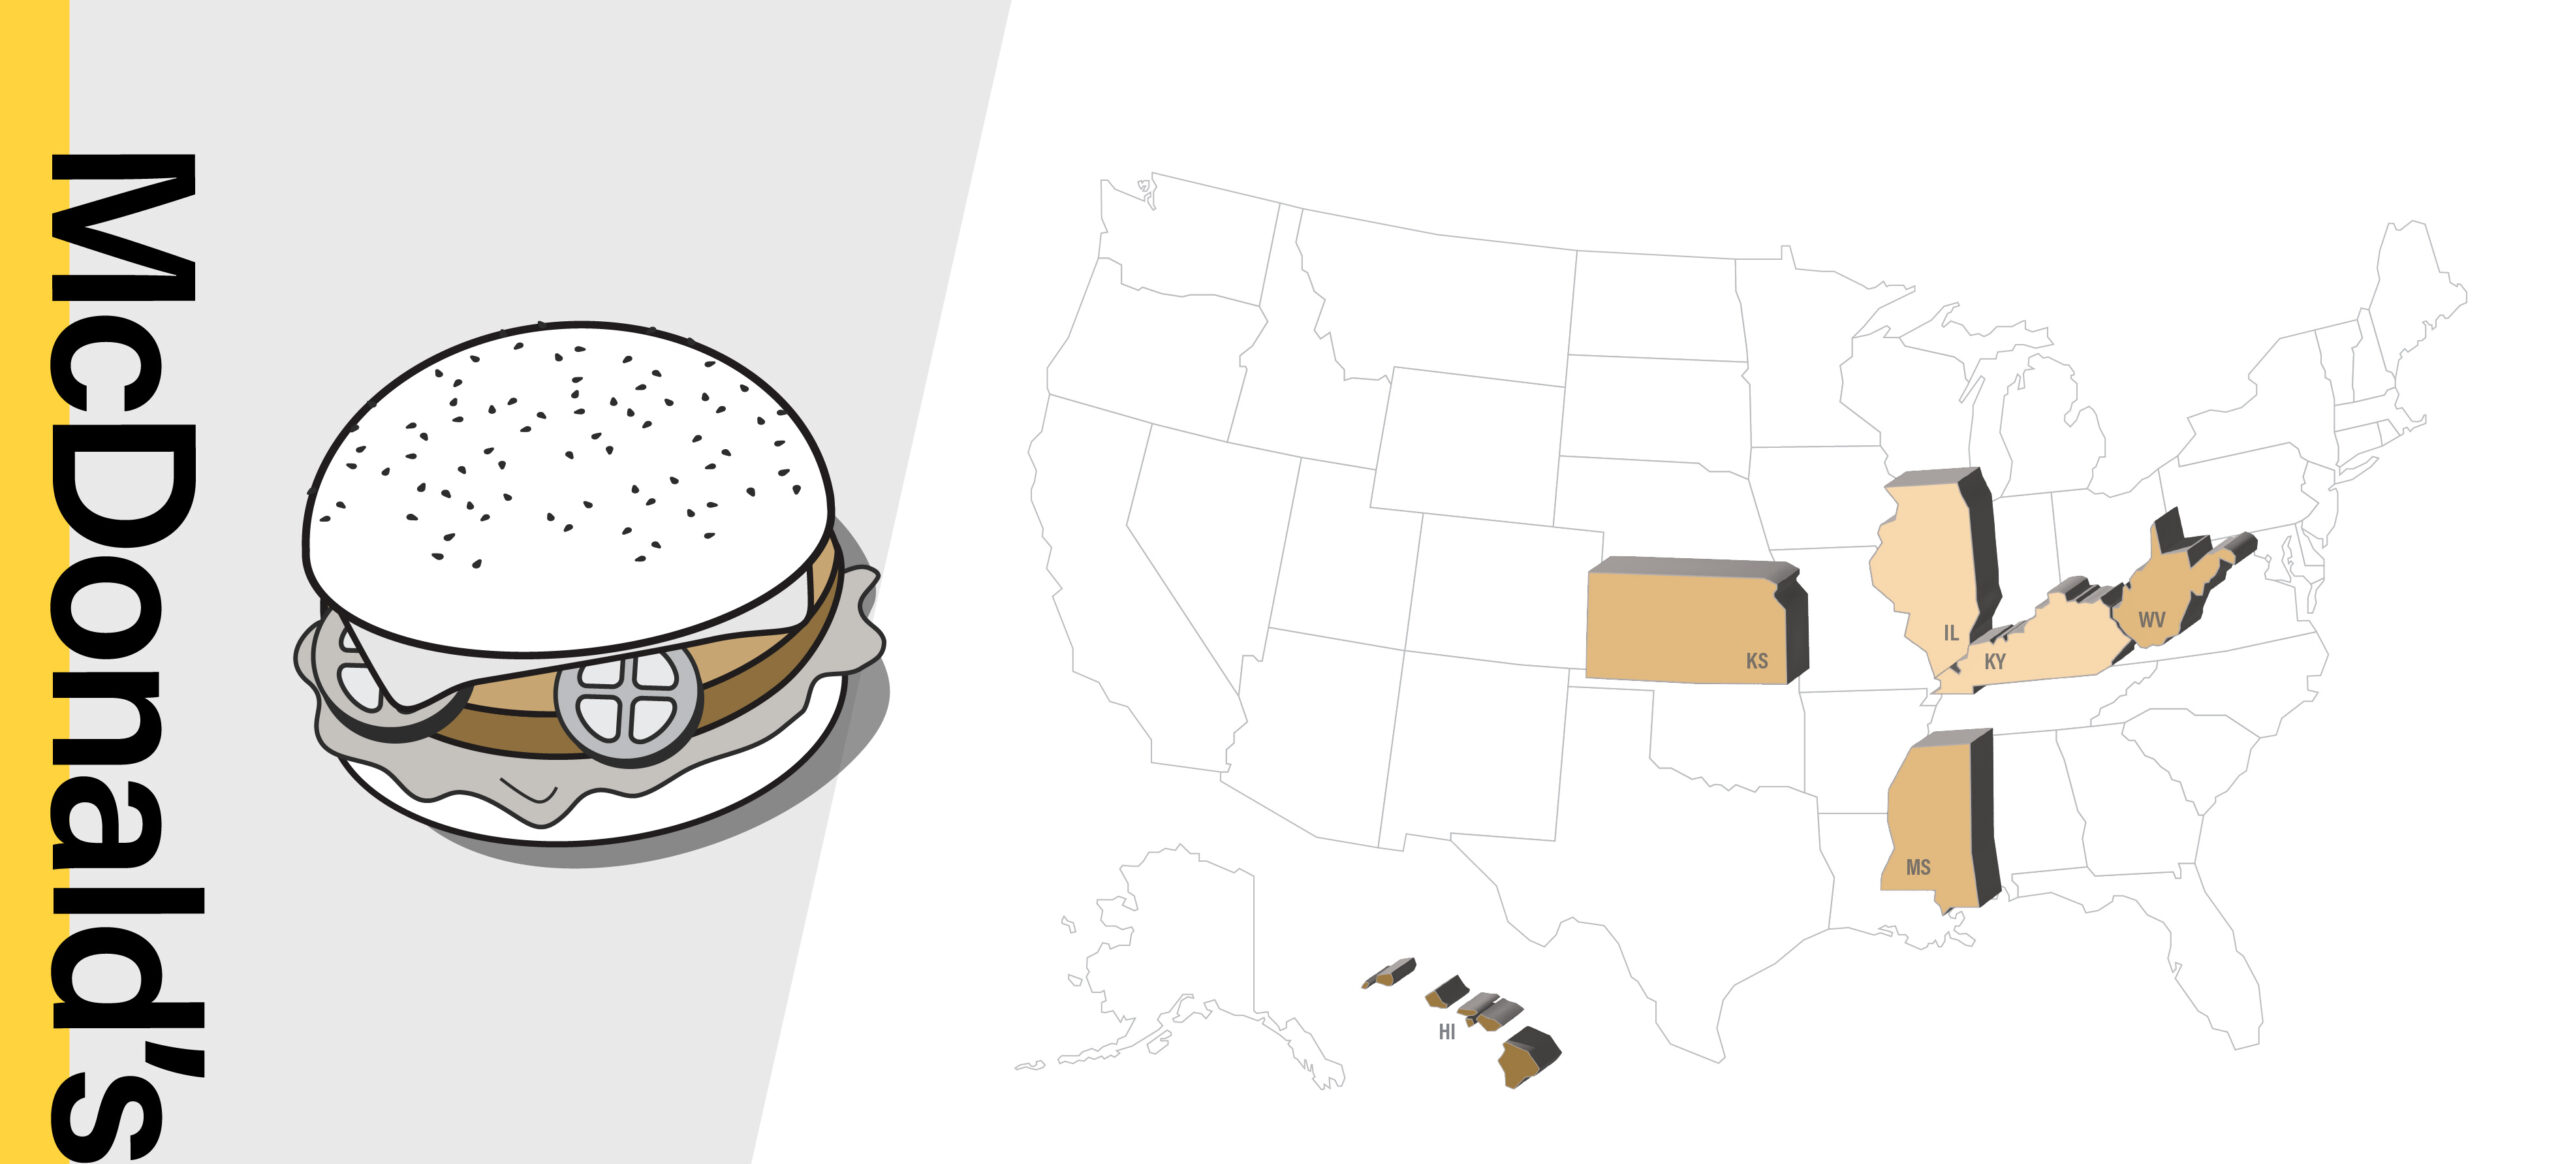
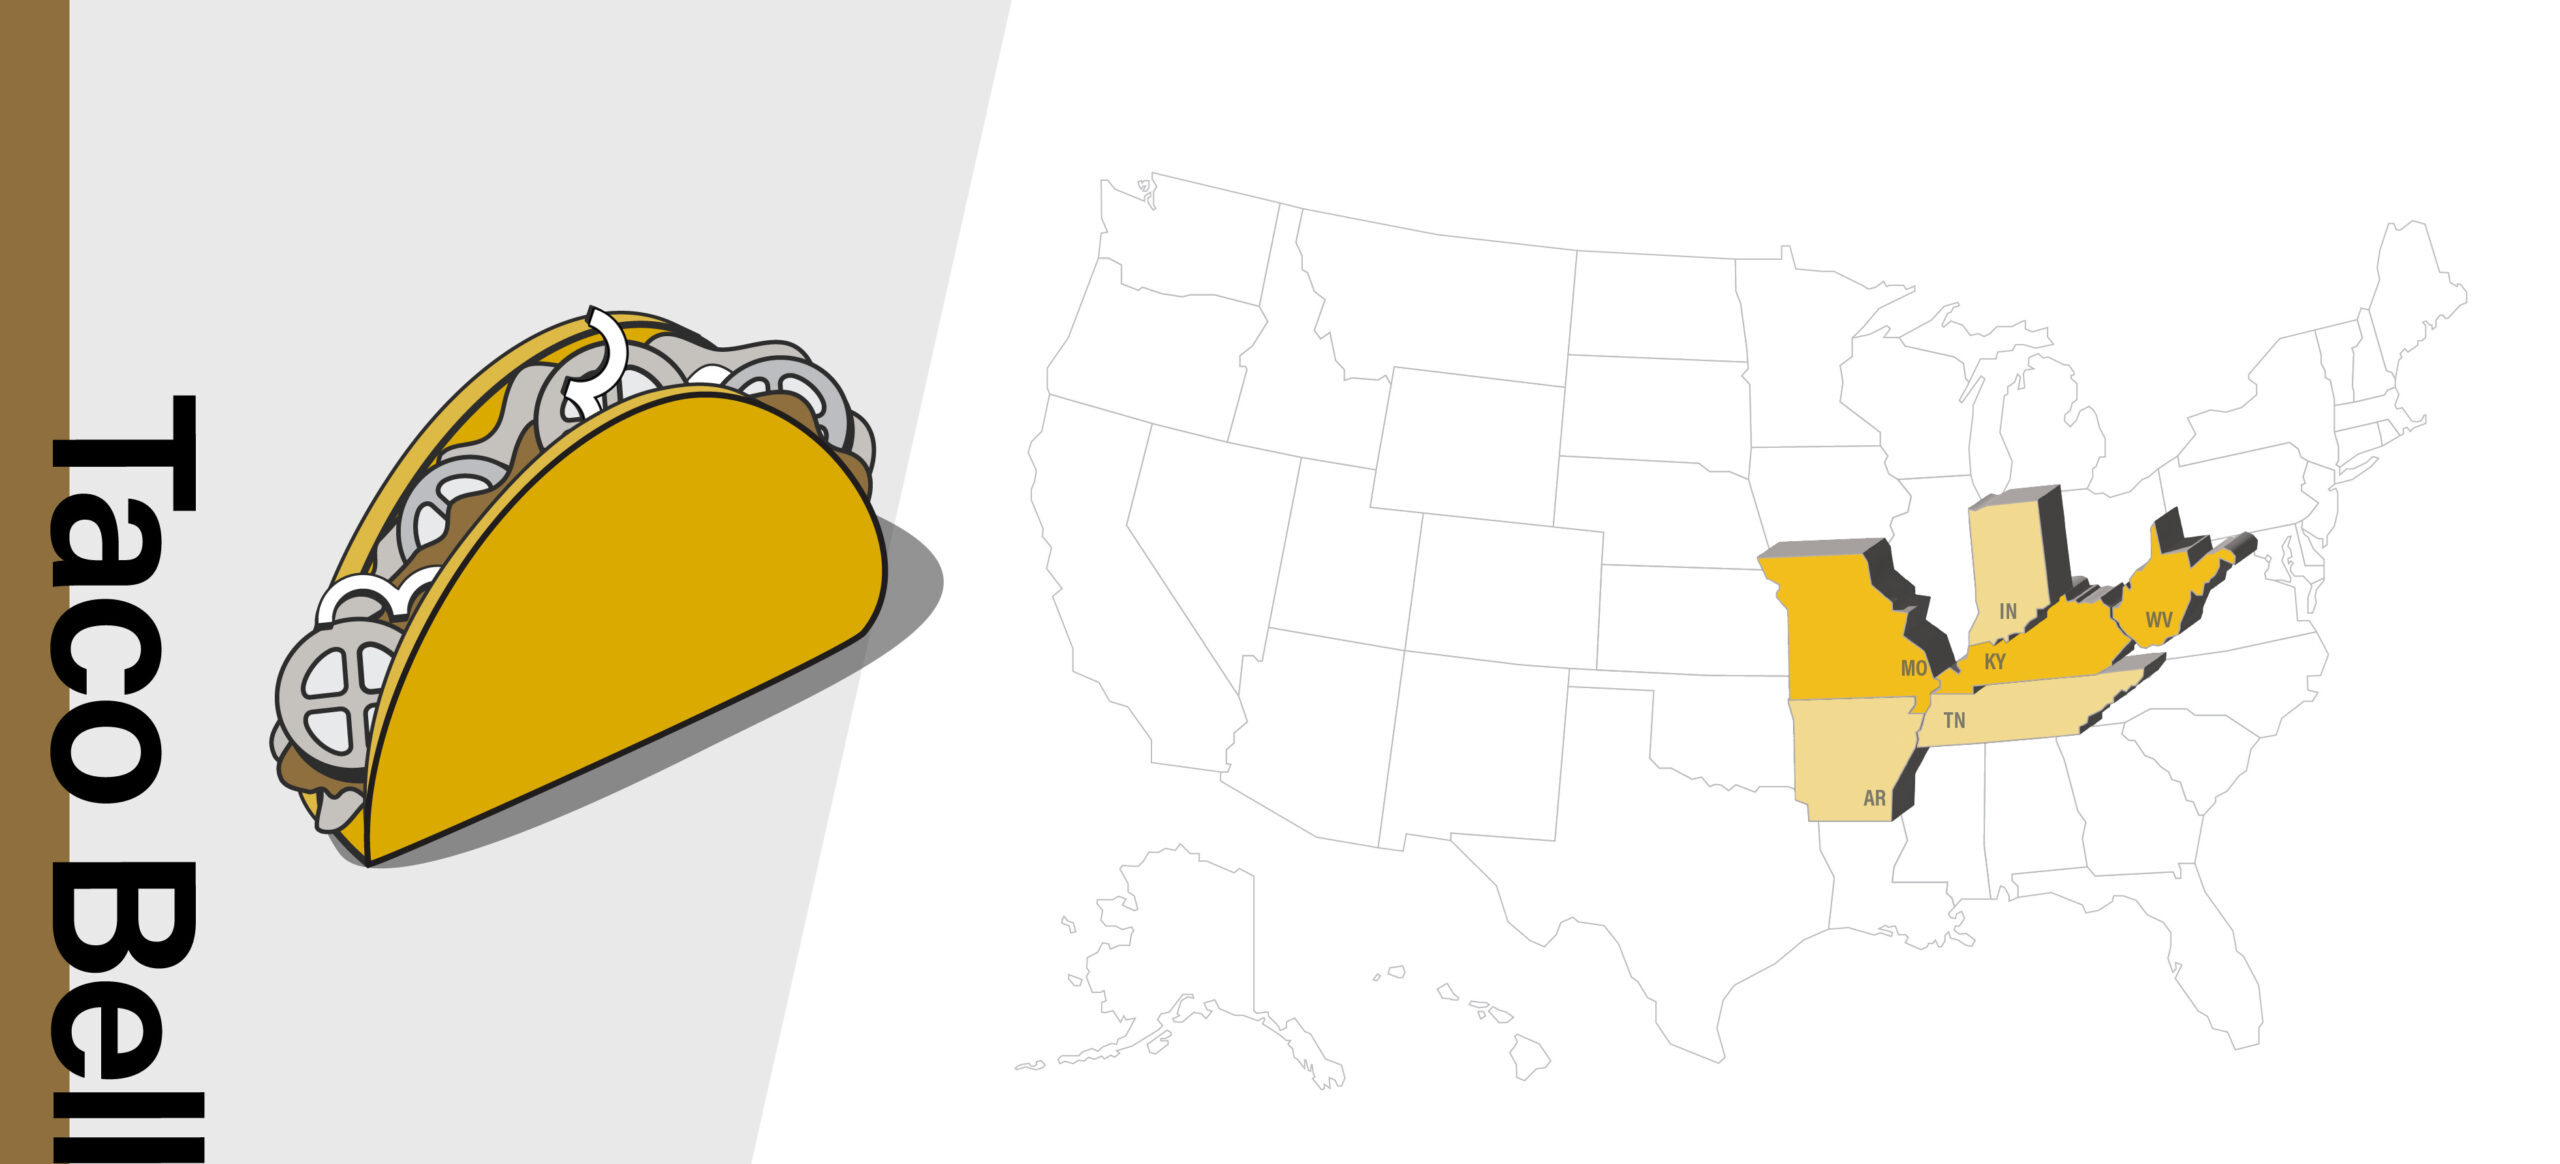
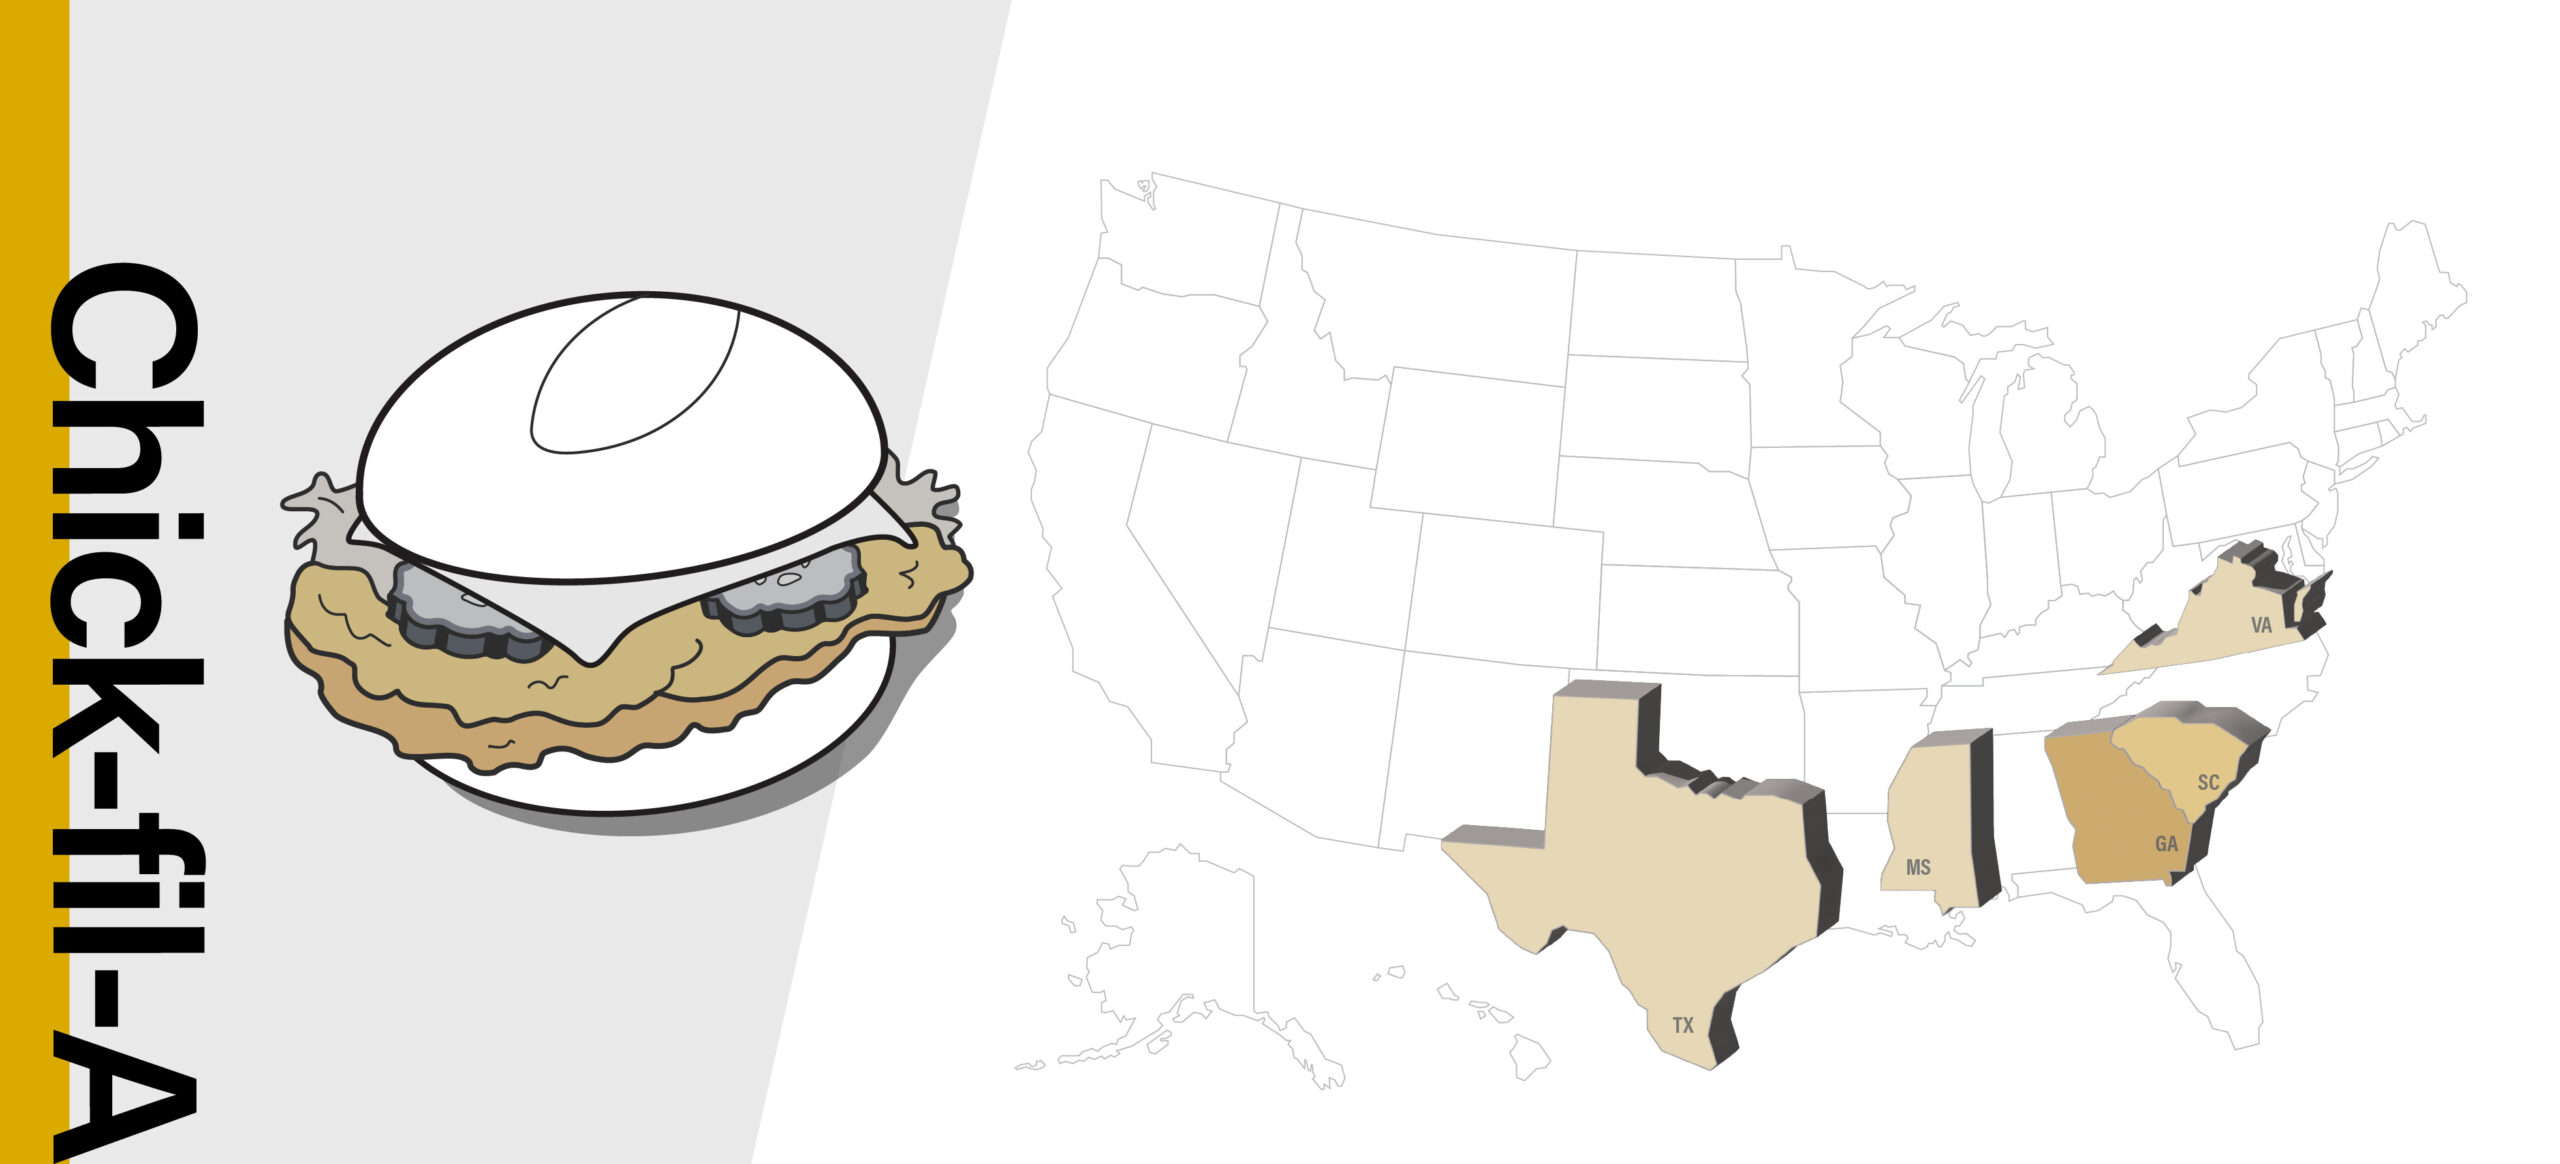
States where total spending per capita is highest for popular casual dining chains McDonald’s, Taco Bell, Chick-fil-A and Starbucks are represented by color from dark to light. The darker the color, the higher the spending per person.
We use Facteus data, representing about 4-5% of all U.S. debit and credit card spending, to create a Restaurant Spending Index. The index is expressed relative to per capita spending at KFCs in Kentucky. McDonald’s in Hawaii has a score of 20.07. What does this mean? It means that spending per capita at McDonald’s in Hawaii is 20.07 times that of KFC in Kentucky. If a merchant has a score of 0.5, it means its per capita spending is half that of the index baseline represented by spending on KFCs in Kentucky.
You can see more Facteus data for spending per capita in each state for several restaurant chains in this supplemental data dashboard, which tracks trends in dining sales on a daily basis. (Updated as of February 4, 2023.)
SPENDING INDEX: TOP STATES PER CAPITA
| McDonald’s | |
| Hawaii | 20.07 |
| Kansas | 16.12 |
| West Virginia | 15.68 |
| Mississippi | 15.56 |
| Kentucky | 14.44 |
| Illinois | 14.39 |
Figure 1. Consumers getting their burger and fries fix from McDonald’s have higher relative spending in the following states: Hawaii, Kansas, Illinois, West Virginia, Mississippi, Kentucky and Illinois. Per person, Hawaiians spend the most at McDonald’s and have a nationwide- and merchant- leading Restaurant Spending Index score of 20.07.
SPENDING INDEX: TOP STATES PER CAPITA
| Taco Bell | |
| Kentucky | 4.58 |
| Missouri | 4.53 |
| West Virginia | 4.47 |
| Indiana | 4.26 |
| Tennessee | 4.21 |
| Arkansas | 4.09 |
Figure 2. Diners eating their favorite chalupas and quesadillas from Taco Bell spend relatively more per person in Kentucky, Missouri, West Virginia, Indiana, Tennessee and Arkansas. Per capita spending in top Taco Bell states is about a quarter to a third that of top McDonald’s states.
SPENDING INDEX: TOP STATES PER CAPITA
| Chick-fil-A | |
| Georgia | 5.93 |
| South Carolina | 4.63 |
| Mississippi | 3.74 |
| Virginia | 3.66 |
| Texas | 3.65 |
Figure 3. Where do people crave chicken? Georgia, South Carolina, Mississippi, Virginia and Texas spend the most picking up chicken tenders and spicy chicken sandwiches from Chick-fil-A, with an index score of 5.93 in Georgia.
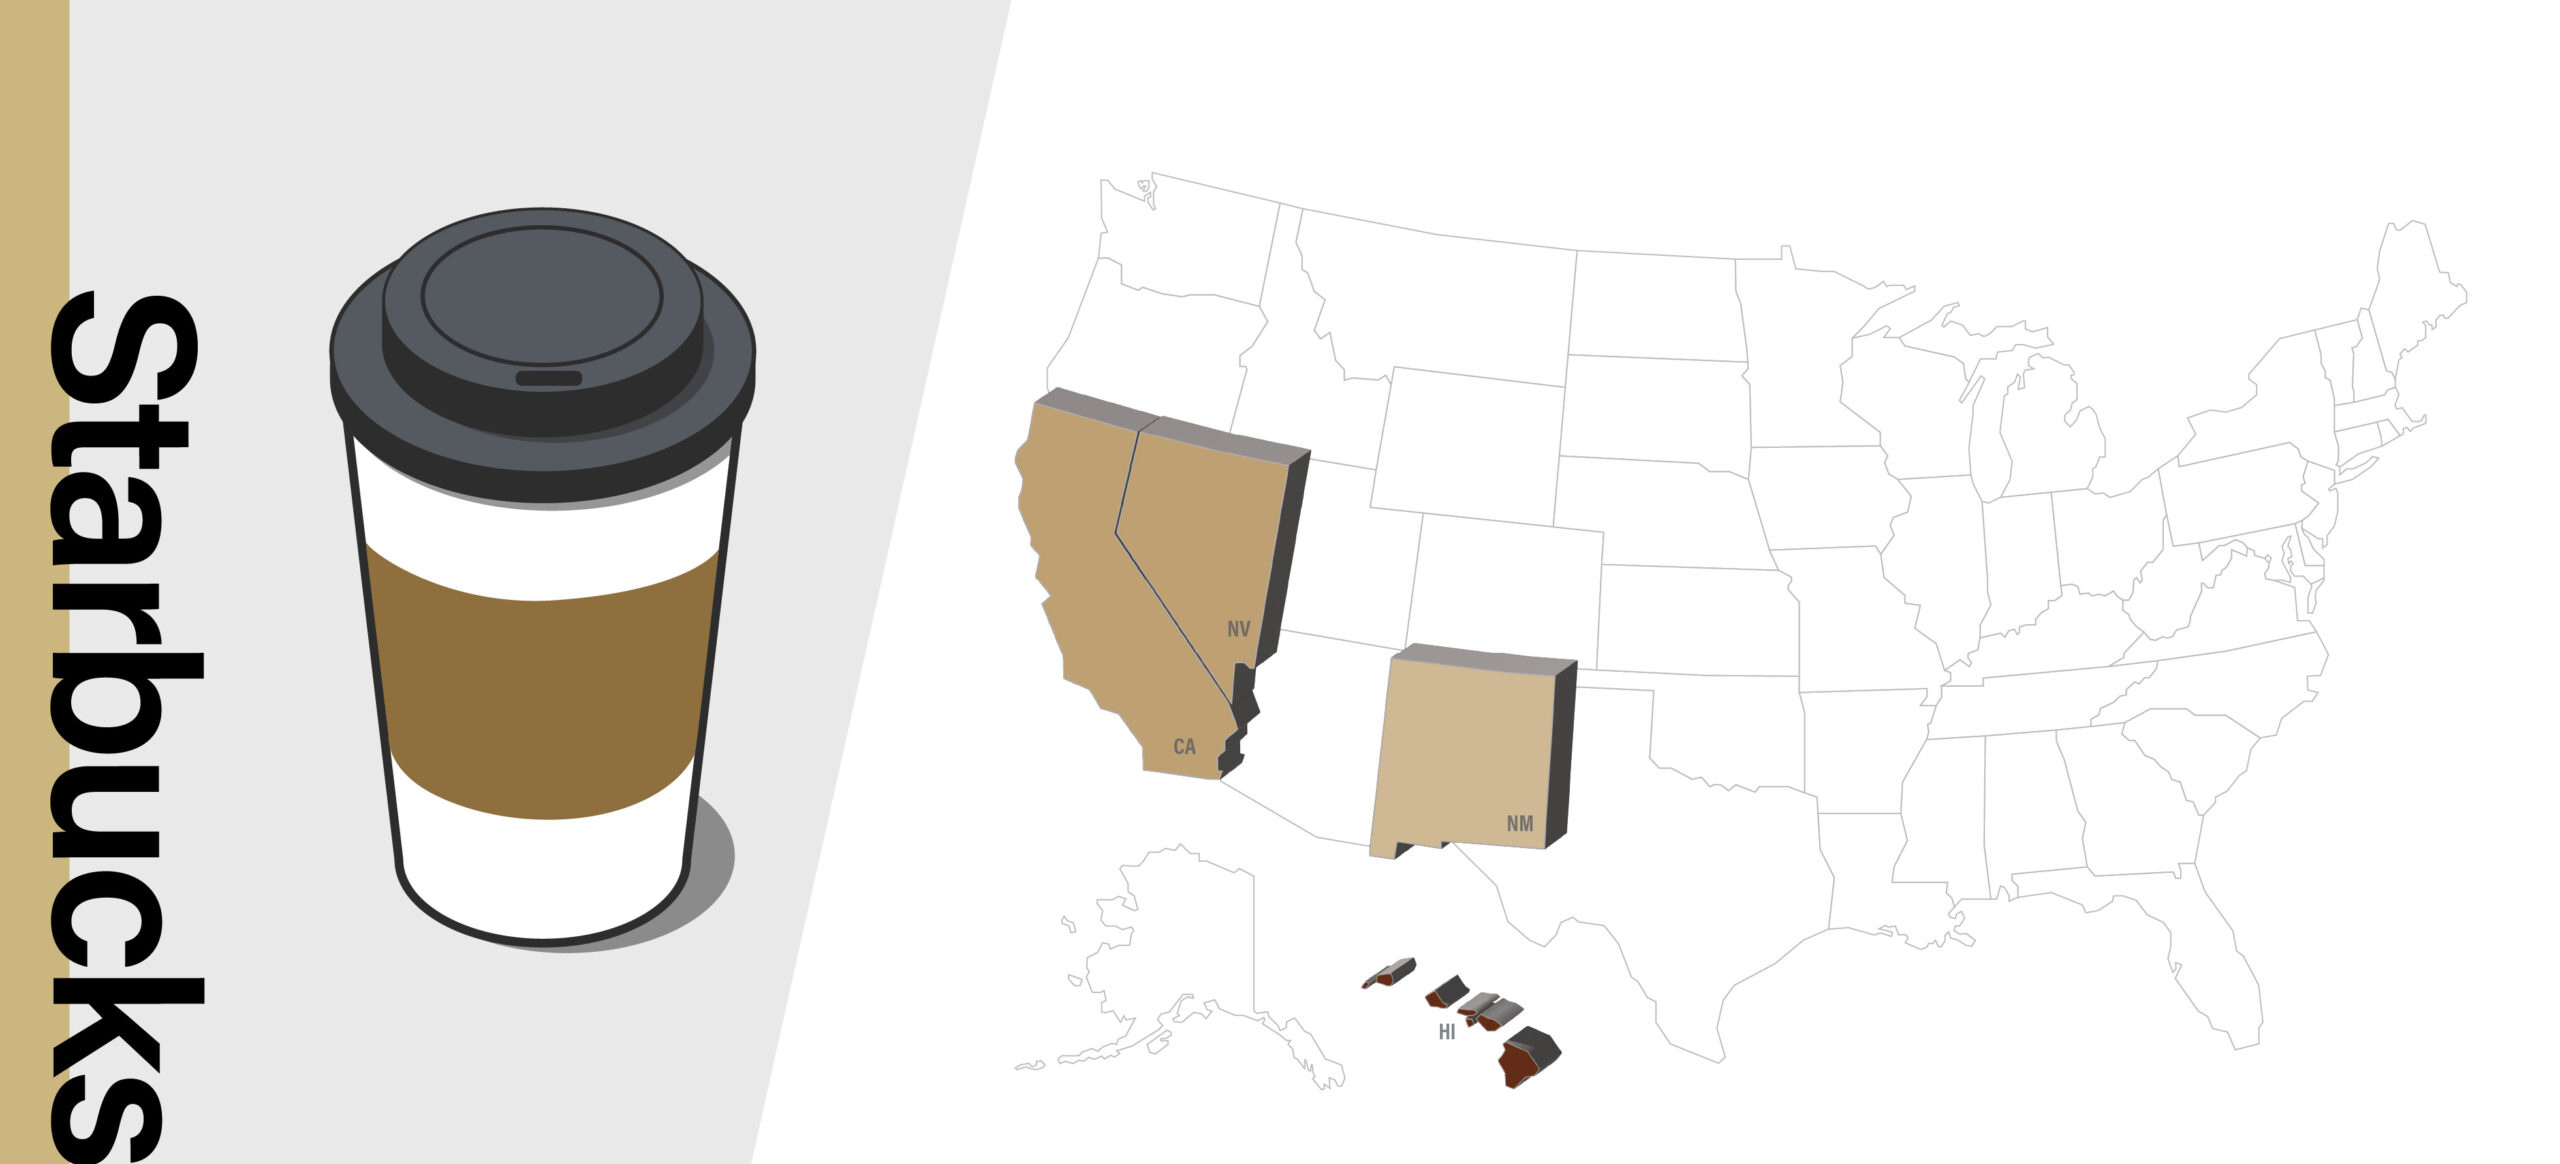
SPENDING INDEX: TOP STATES PER CAPITA
| Starbucks | |
| Hawaii | 5.68 |
| Nevada | 3.40 |
| California | 3.09 |
| New Mexico | 2.99 |
Figure 4. Consumers like Starbucks a latte! The states with highest total spending per capita are Hawaii, Nevada, California and New Mexico. Hawaiians receive a score
of 5.68.
Spending Index: Popular U.S. Restaurant Categories
You might favor a burger, a taco or a slice of pizza as your fast-food fix. See where people spend the most on popular fast-food categories, including chicken, burgers, coffee, pizza, sandwiches and global foods like tacos and stir-fry.
As before, the index values are expressed related to per capita spending at KFCs in Kentucky.
You can see more Facteus data for spending per capita at specific restaurants in each food category, for states across the nation in this supplemental data dashboard, which tracks trends in dining sales on a daily basis. (Updated as of February 4, 2023.)

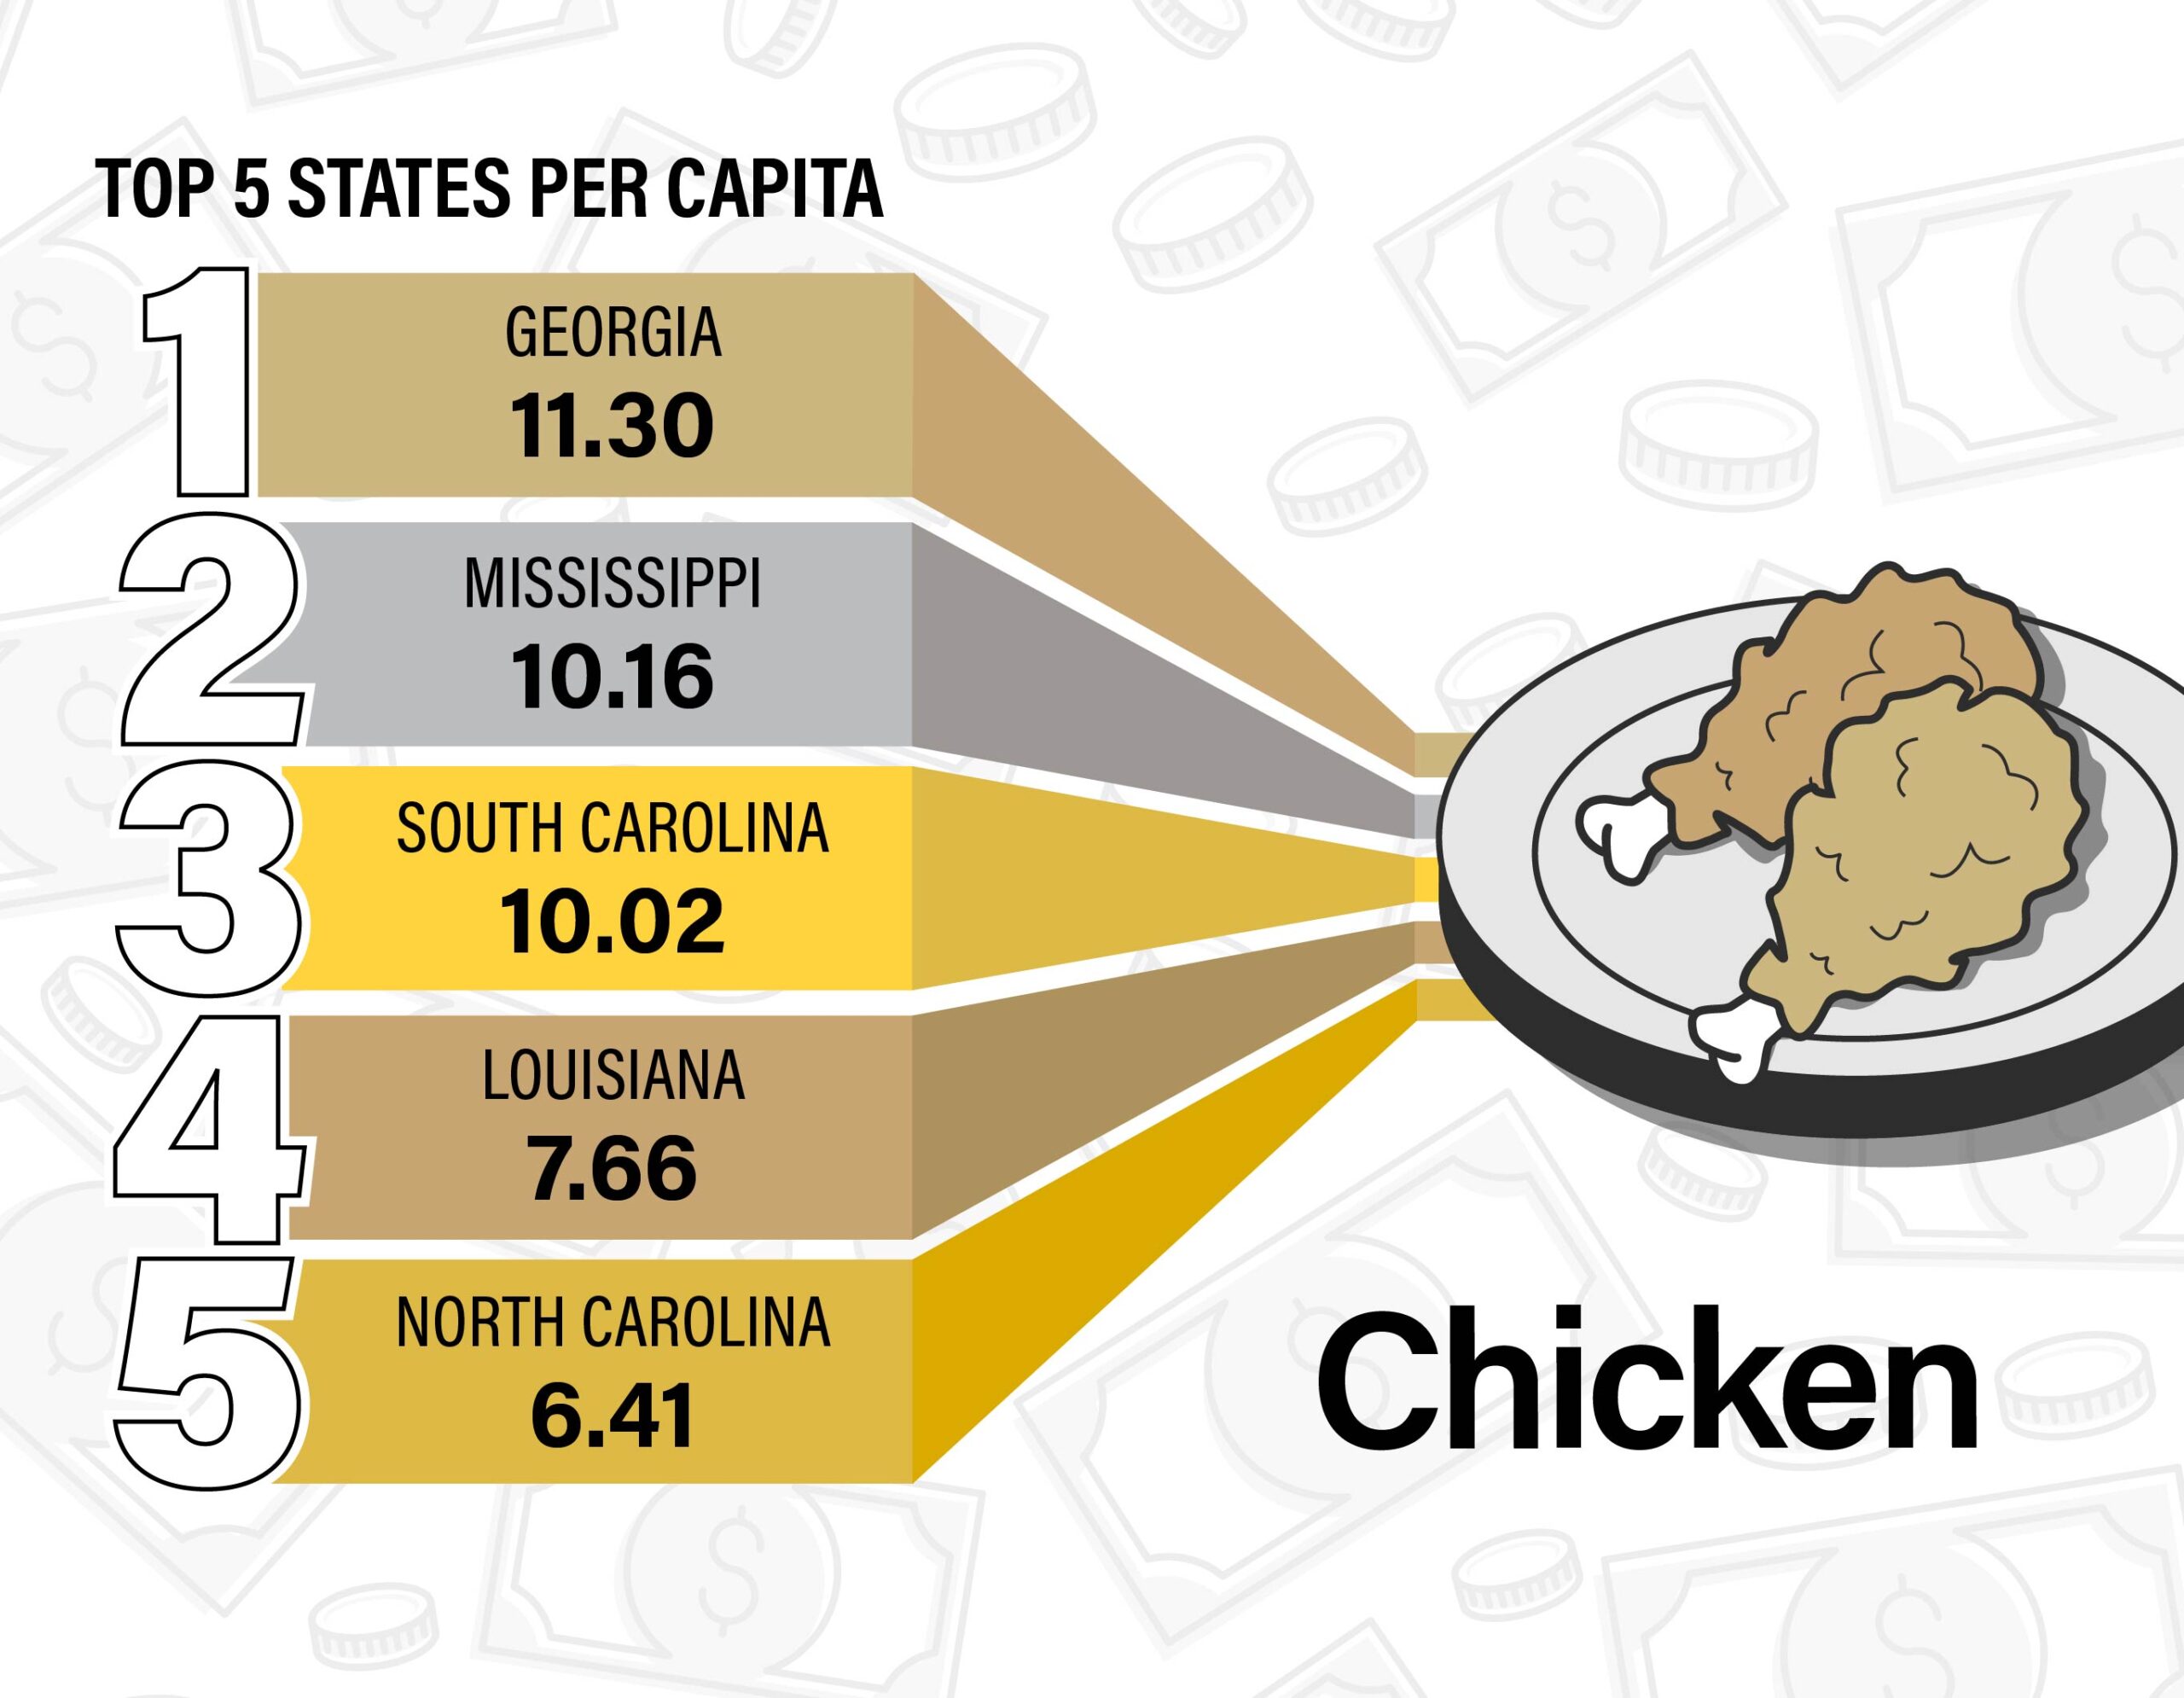
Figure 5. Among the fast-food chains that fowl under the chicken category are Chick-fil-A, KFC, Popeye’s Louisiana Kitchen and Wingstop. Chicken maintains its clout in the south; all five states that score the highest on our spending index are in that region.
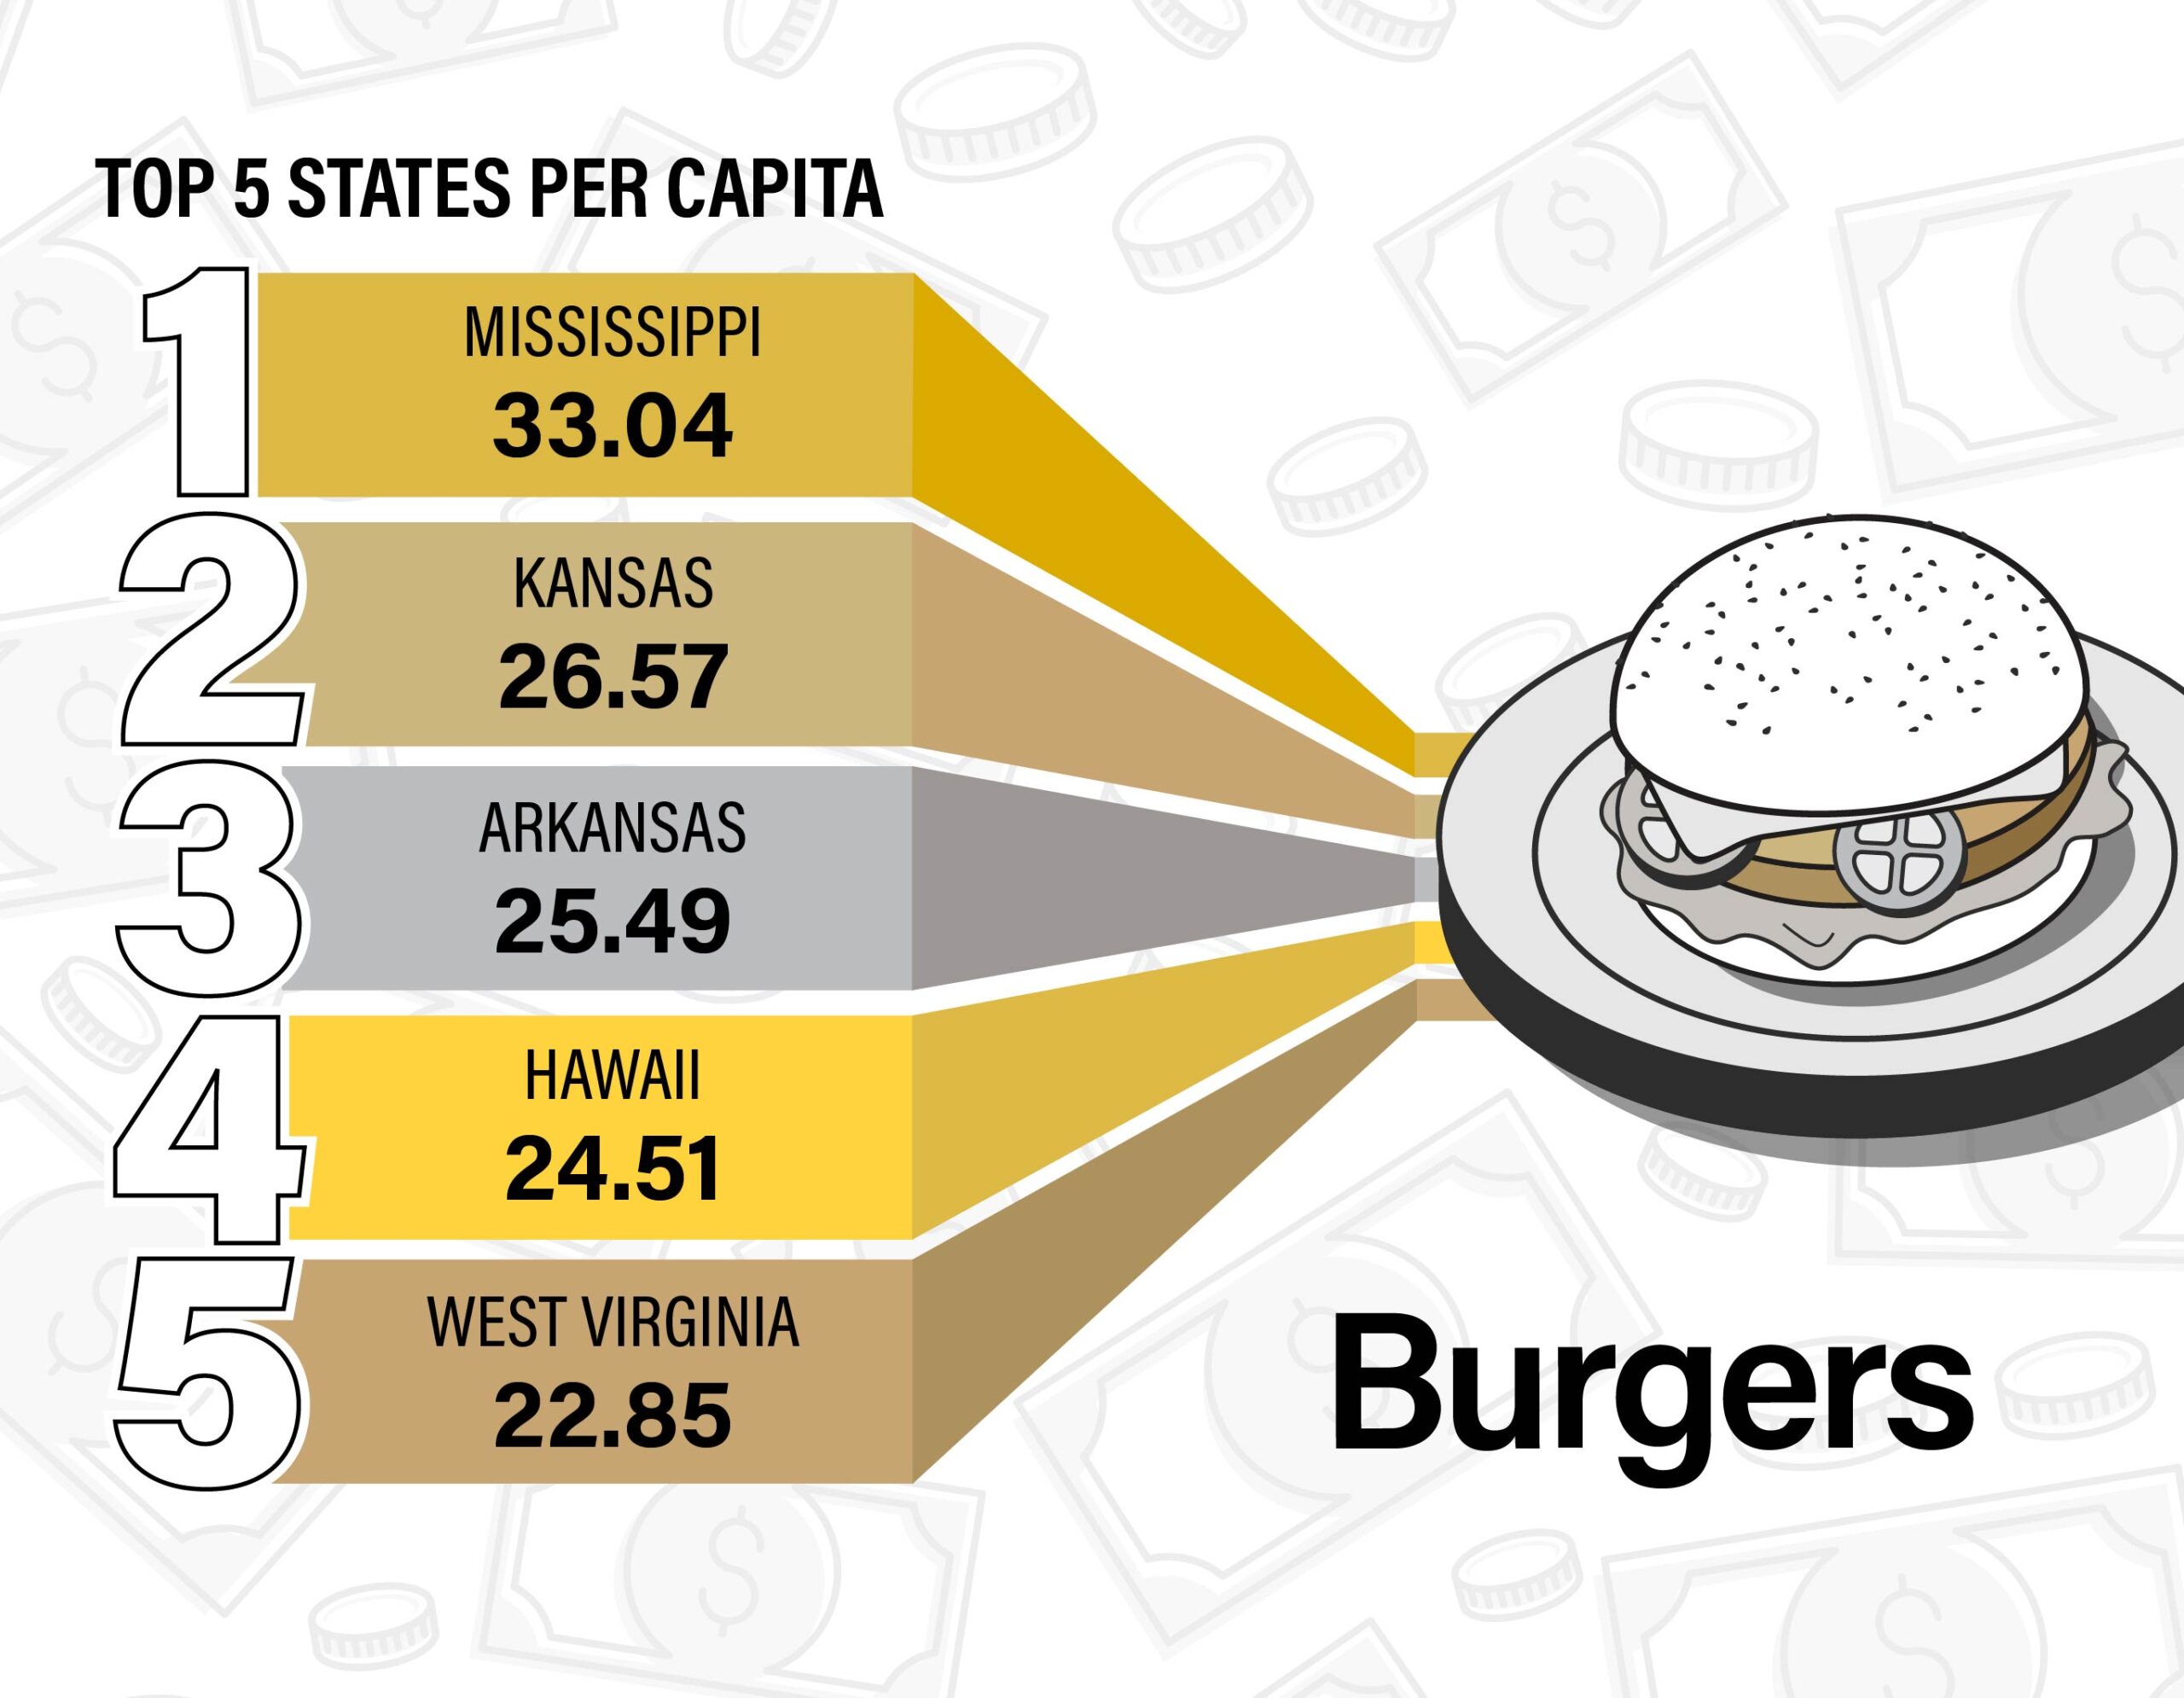
Figure 6. It’s burger o’ clock! McDonald’s is a restaurant with relatively high index scores across the country. Three Southern states plus Kansas and Hawaii make the top five.
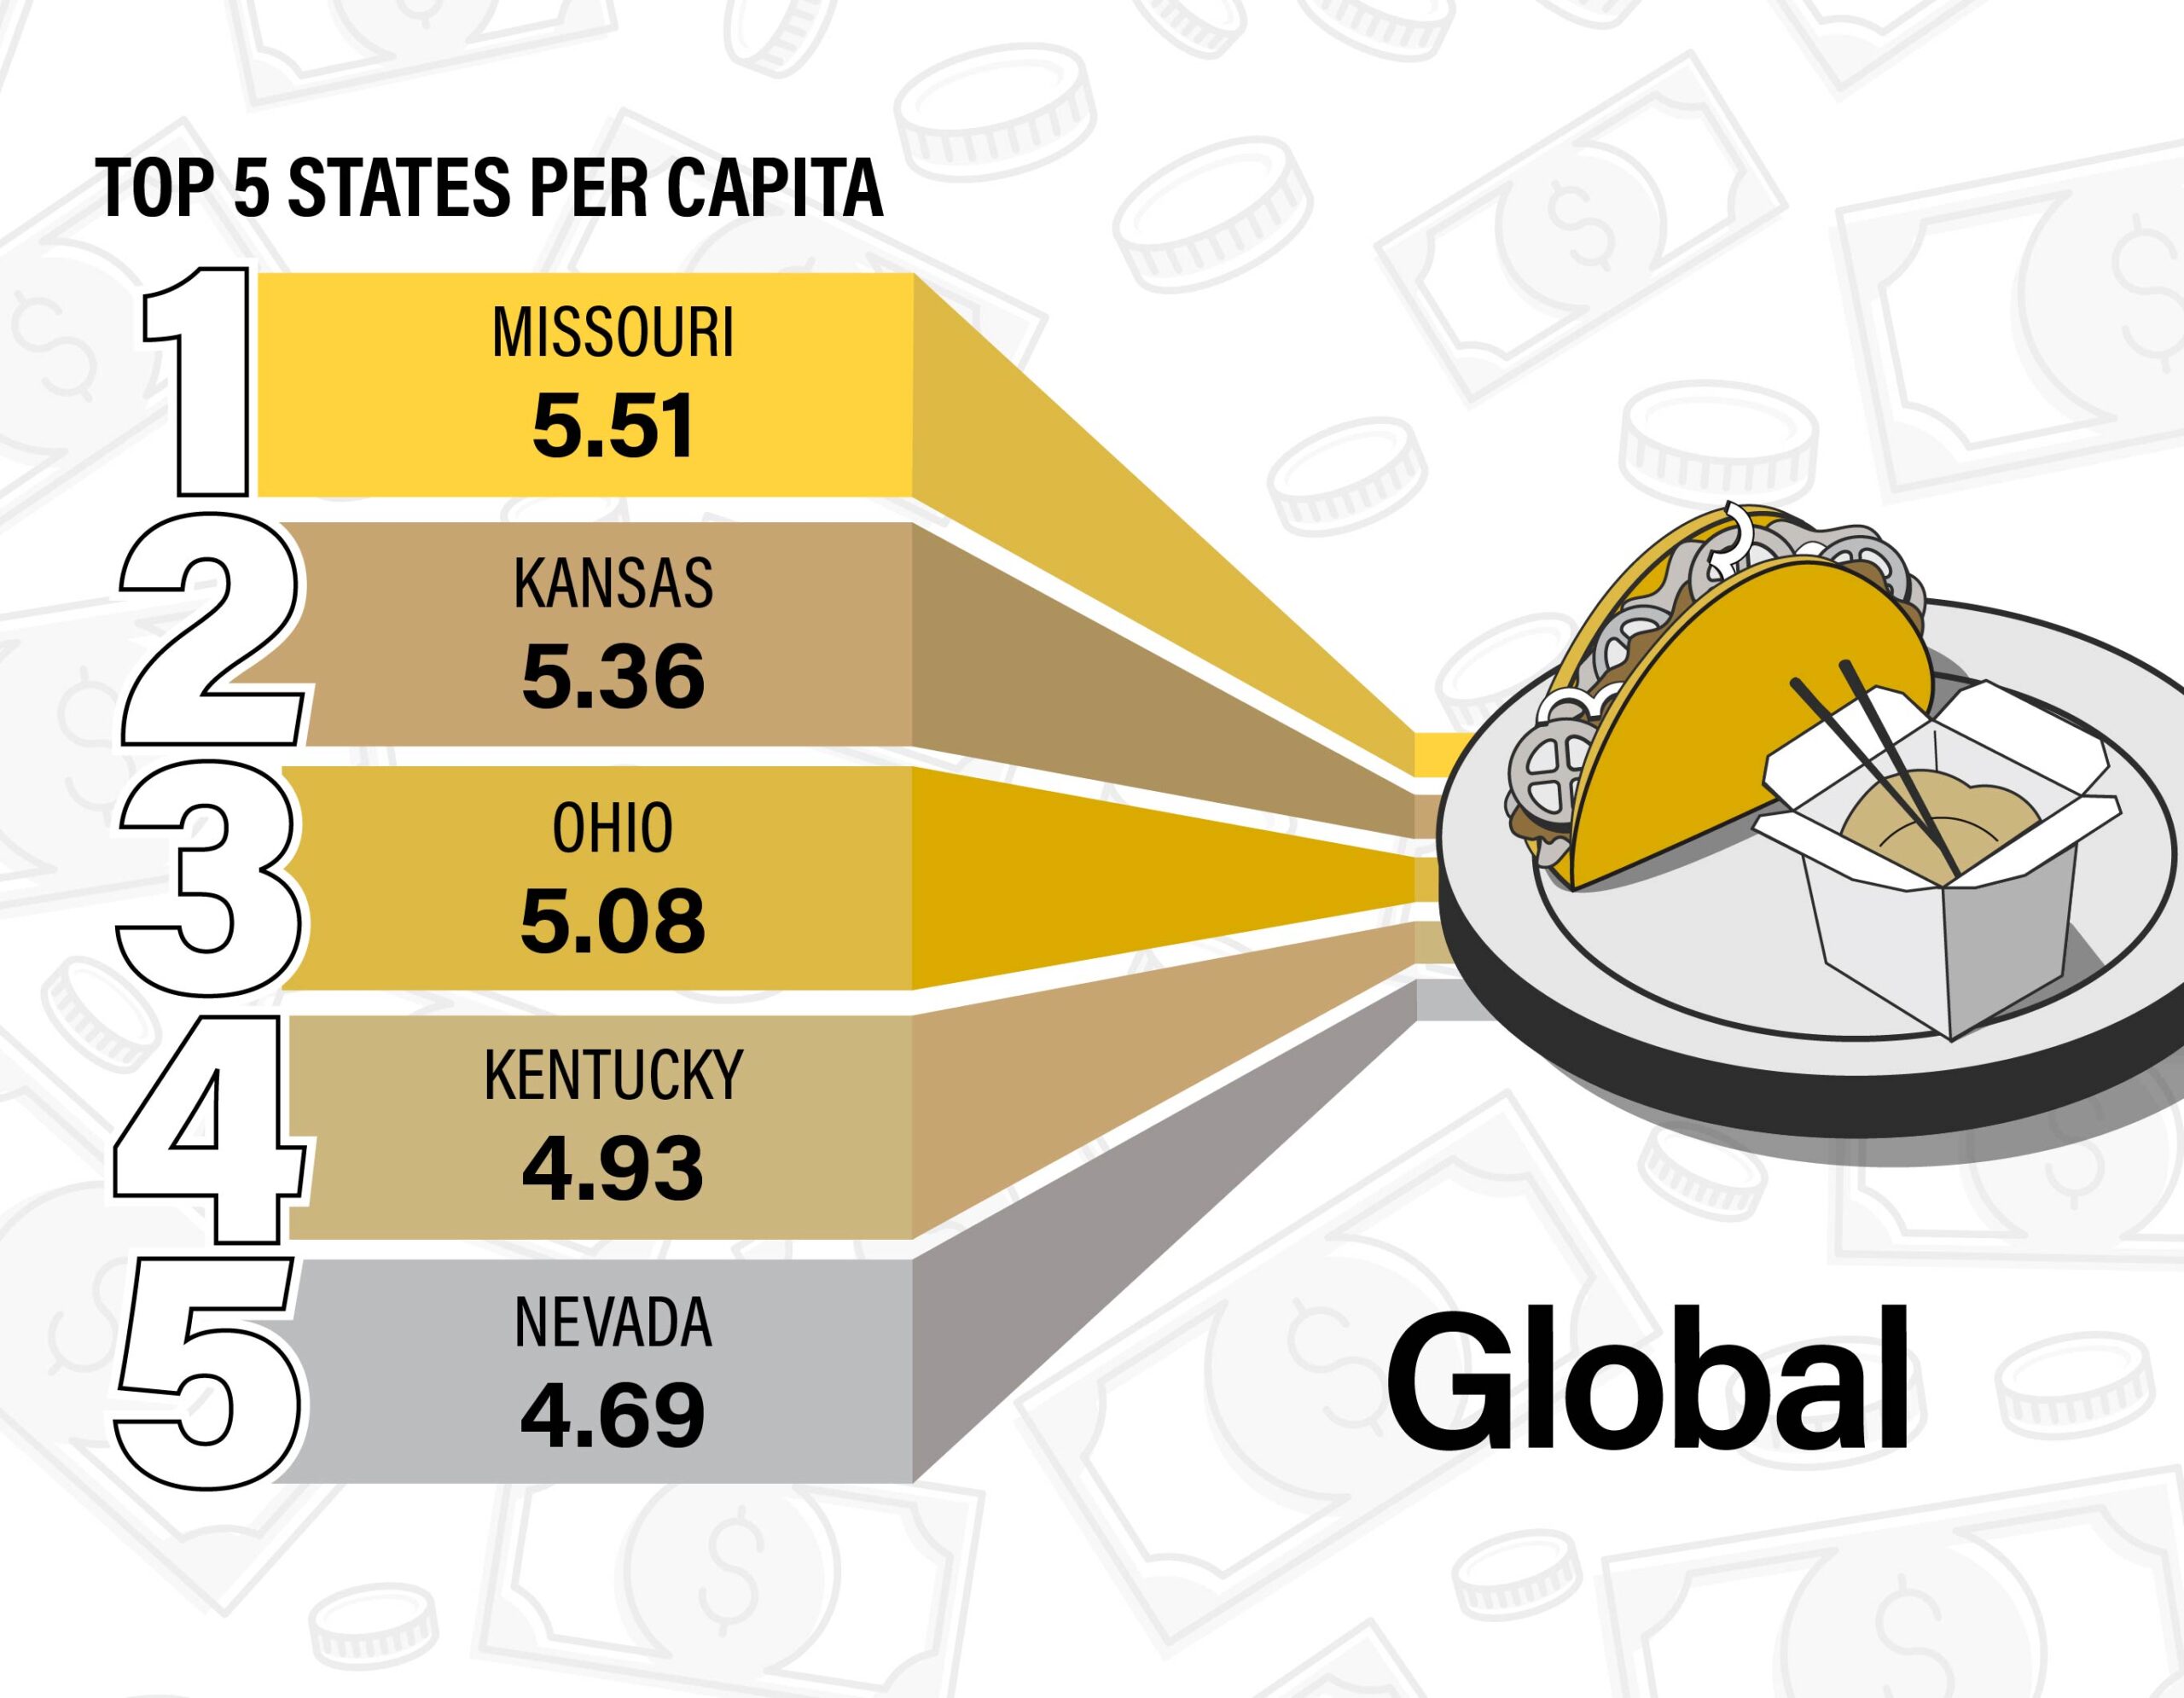
Figure 7. Food for thought: Americans enjoy restaurants like Chipotle, Panda Express and Taco Bell, which are all under the global umbrella. Data shows that the states with higher index scores for international menu items are in the Great Plains and the Midwest.
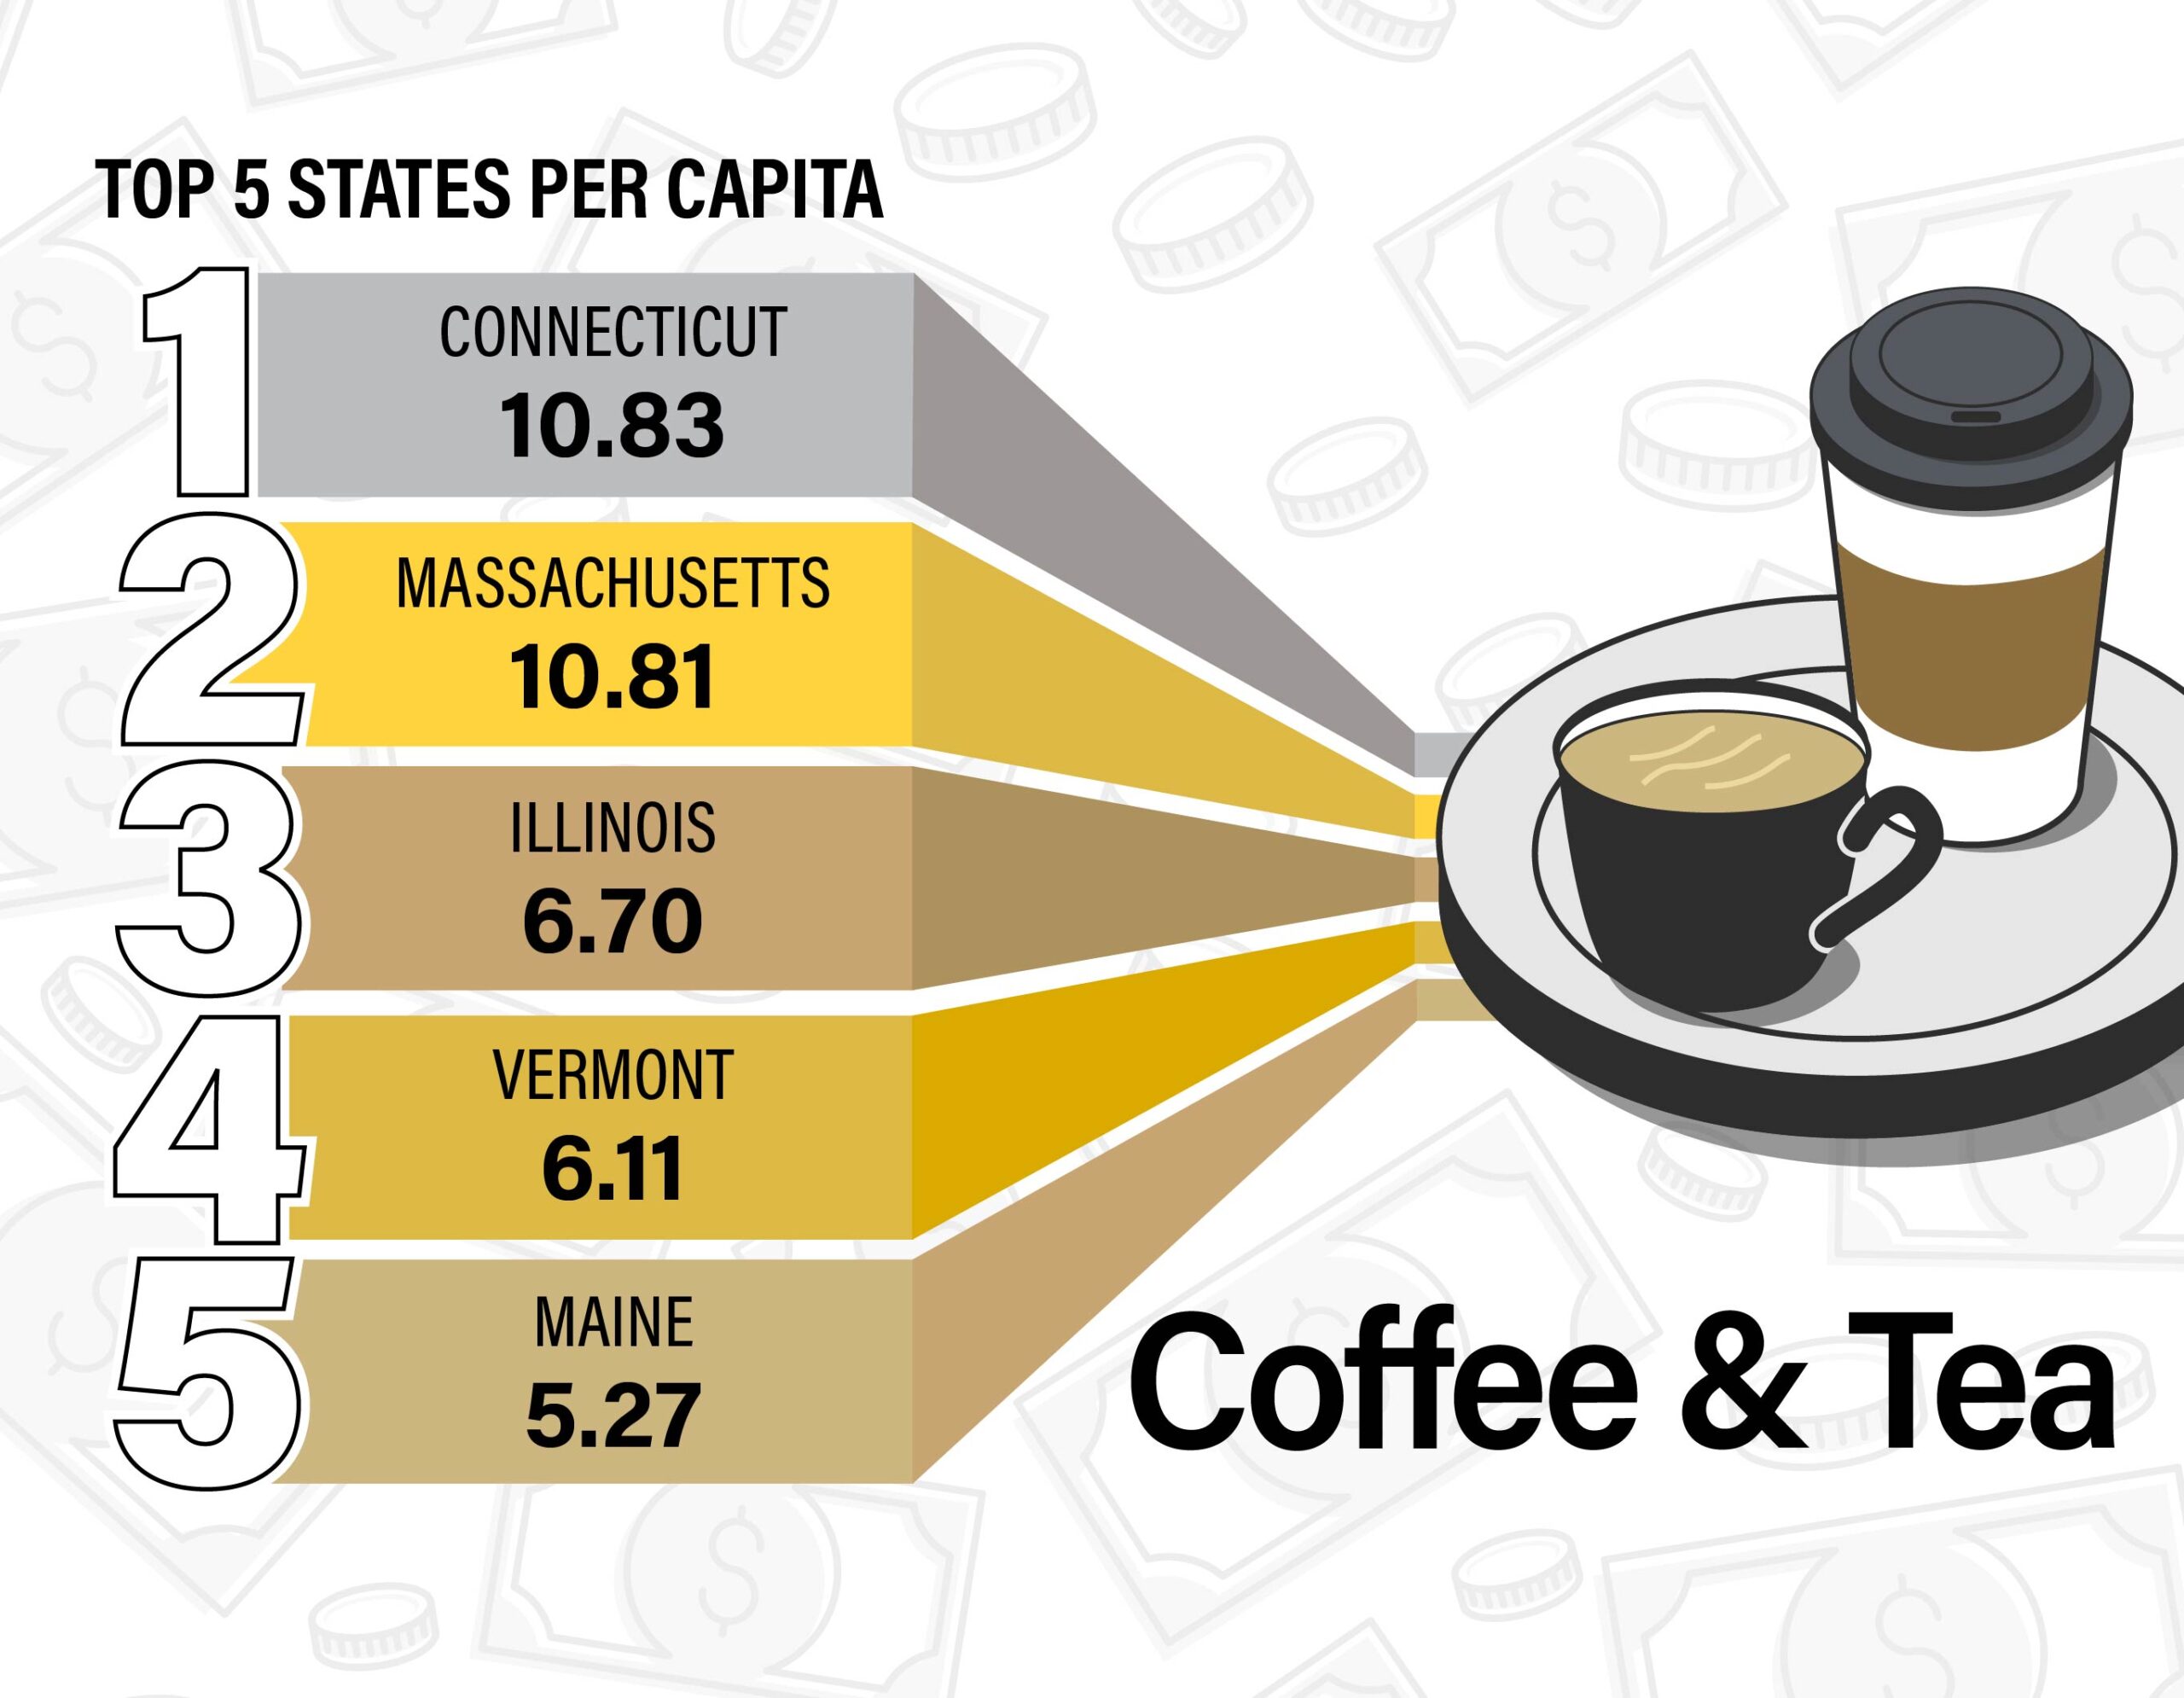
Figure 8. We see regional differences in chains where consumers choose to caffeinate. Notably, coffee spending receives higher index scores in the East and Northeast U.S.
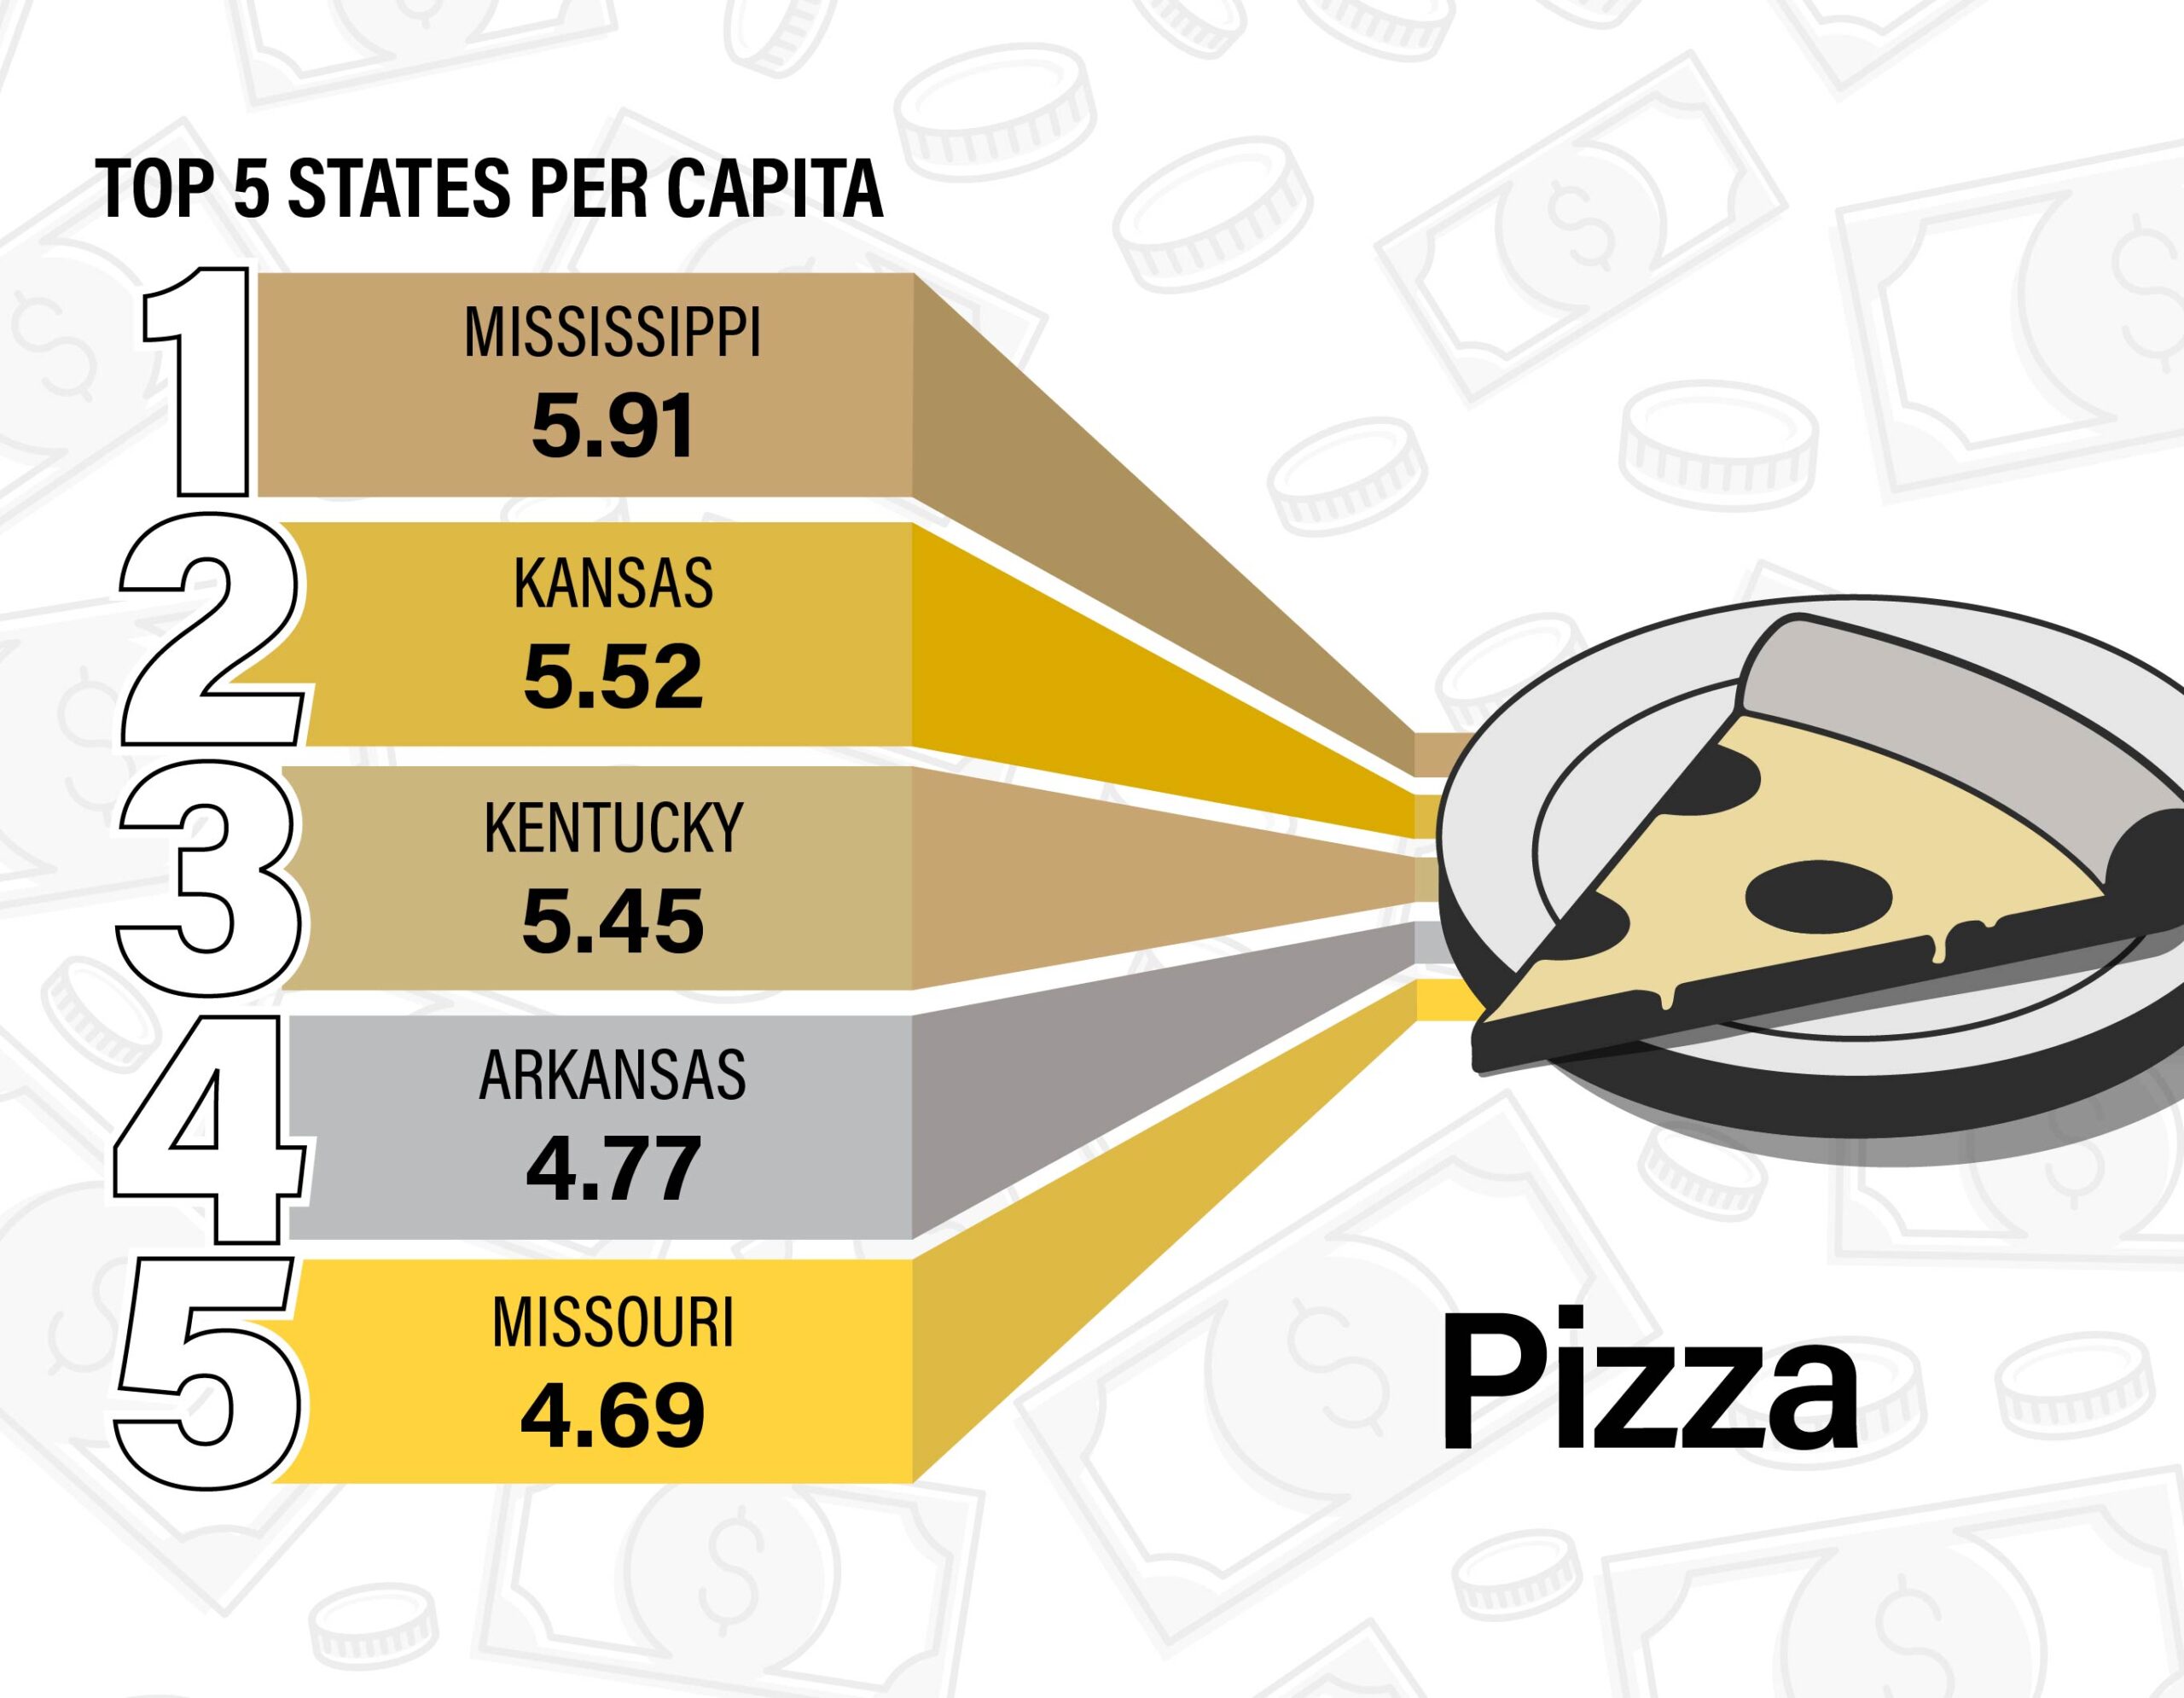
Figure 9. Consumers are cheesing for this category! The states with the highest index scores span the U.S., including the Great Plains, the Midwest and South.
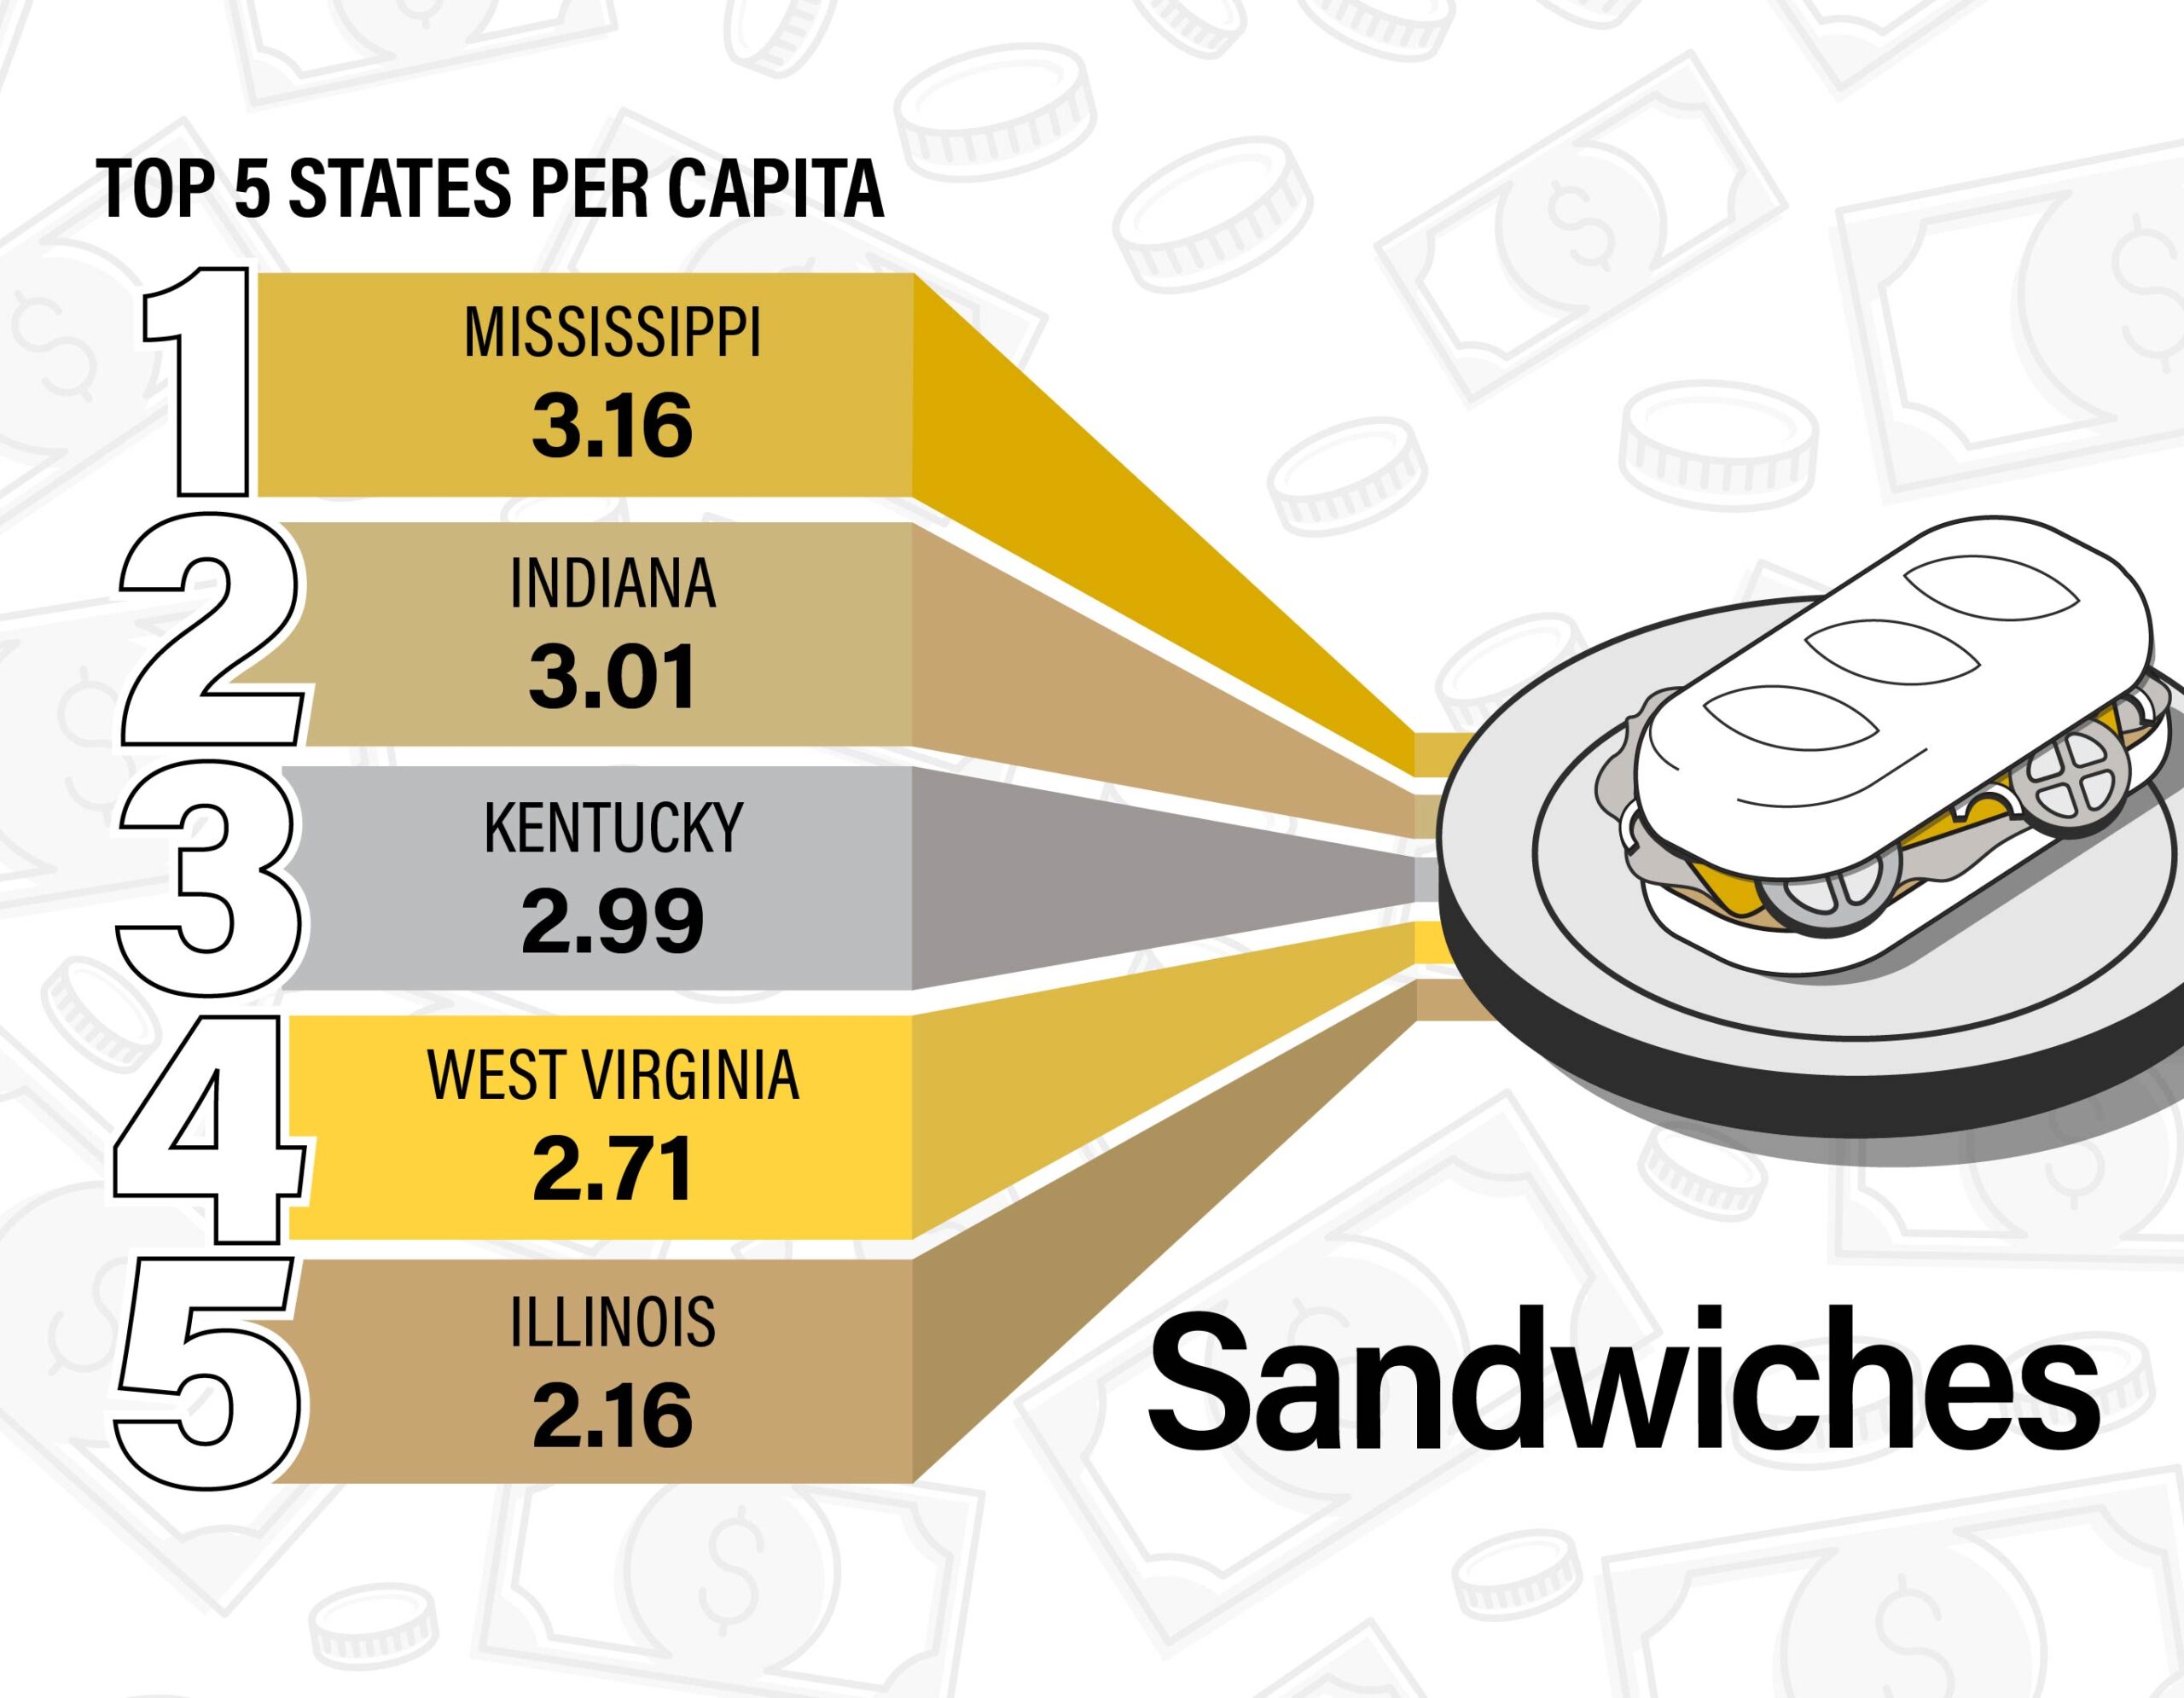
Figure 10. Wheat’s for lunch? Sandwiches! Diners are getting their subs at well-known chains like Arby’s, Firehouse Subs and Subway. Choices vary across the country; however, index scores in the Midwest dominate this category.
Food delivery sales, specifically total sales of the top 15 food delivery merchants across the U.S., fluctuated during the COVID-19 pandemic. With restrictions and safety precautions throughout the pandemic, it’s no surprise that sit-down restaurants experienced dips in sales and food delivery companies experienced unprecedented spikes in sales. What does this mean for the future of sit-down restaurants and food delivery?
Jayson Lusk, distinguished professor of agricultural economics and director of the Center for Food Demand Analysis and Sustainability (CFDAS), predicts that restaurants may continue to transform to better fit the evolving needs of consumers, creating infrastructures that support sit-down consumption, takeout AND food delivery.
See the fluctuation in spending on food delivery services in the image to the right. We plot the percent change in per-capita spending over time relative to the beginning of December 2019. This features data from December 1, 2019, to December 31, 2022. We paired the data with key moments during the pandemic as noted by the Centers for Disease Control (CDC) Museum COVID-19 Timeline, some of which impact or coincide with food delivery sales trends.
Check Facteus data on food delivery sales for specific states nationwide in this supplemental data dashboard, which tracks trends in food delivery sales on a daily basis. Updated as of February 4, 2024.
Although the CFDAS depicts only the most relevant events in the above animation, for a more detailed timeline of events of the 2019 Novel Coronavirus, you can visit the CDC website.
You can find a variety of dashboards related to food prices and consumer behavior at Purdue Agriculture’s Center for Food Demand Analysis and Sustainability, as well as data on a number of shopping and eating habits through Consumer Food Insights, a monthly survey of more than 1,200 Americans conducted by Purdue agricultural economists. It tracks trends and changes in consumer food demand and sustainability, including food expenditure, values, satisfaction, security and sustainability.
Source: Center of Food Demand Analysis & Sustainability (CFDAS) at Purdue University and Department of Agricultural Economics at Purdue University.
Data Sources: Web scraping via CFDAS and Facteus; U.S. Bureau of Labor Statistics, Population Division; Centers for Disease Control and Prevention; U.S. Department of Defense.
Prices included in this infographic are for the date ranges of December 1, 2019 to December 31, 2022, but are updated daily on the CFDAS website. For more current pricing, visit the Casual Dining Sales and Food Delivery Sales dashboards.
Footnotes:
1. Casual dining, or Food Away from Home (FAFH), restaurants are categorized as both sit-down restaurants AND fast-food chains with largely drive-through purchasing options. The data featured in the above figure highlights only fast-food chains.
2. The credit/debit card transaction data from Facteus is a 4-5% representative sample of all U.S. spending. We use spending per capita (per person) as a proportional metric for popularity.
3. The Facteus data represented in this graphic (12/1/2019 – 12/31/2022) was extracted from the CFDAS Casual Dining dashboard on February 13, 2023.
4. Using the Facteus data for per capita spending amounts available on both the Casual Dining and Food Delivery Sales dashboards, we have changed the units from dollars to an index of relative spending. Divide any two index numbers and it will tell you how much more is spent in one location than another. For example, if merchant A in location X has a value of 15.1 and merchant B in location Y has a value of 10, then one can say spending per capita is 15.1/10=1.51 times higher in merchant A/location
X than in merchant B/location Y.