


Farmer Sentiment Improves But Producers Still Concerned About Rising Costs and Inflation
James Mintert and Michael Langemeier, Purdue Center for Commercial Agriculture
A breakdown on the Purdue/CME Group Ag Economy Barometer April results can be viewed at https://purdue.ag/barometervideo. Find the audio podcast discussion for insight on this month’s sentiment at https://purdue.ag/agcast.
Farmer sentiment improved in August as the Purdue-CME Group Ag Economy Barometer index rose 14 points above its July reading to 117. The rise in the overall measure of agricultural producer sentiment was driven by increases in both the Index of Current Conditions, which rose 9 points in August to 118 and the Index of Future Expectations, which climbed 16 points in August to 116. Producers this month were less worried about their farm’s financial situation than in July, although they remain concerned about a possible cost/price squeeze. When asked about their biggest concerns for the next year, over half (53%) of respondents chose higher input costs. Other concerns included rising interest rates, input availability, and lower output prices chosen by 14, 12 and 11 percent of respondents, respectively. Despite this month’s improvement in sentiment, all three indices remain well below year ago levels. The Purdue University-CME Group Ag Economy Barometer sentiment index is calculated each month from 400 U.S. agricultural producers’ responses to a telephone survey. This month’s survey was conducted from August 15-19, 2022, which was after USDA released both the August Crop Production and World Agricultural Supply & Demand Estimates reports.
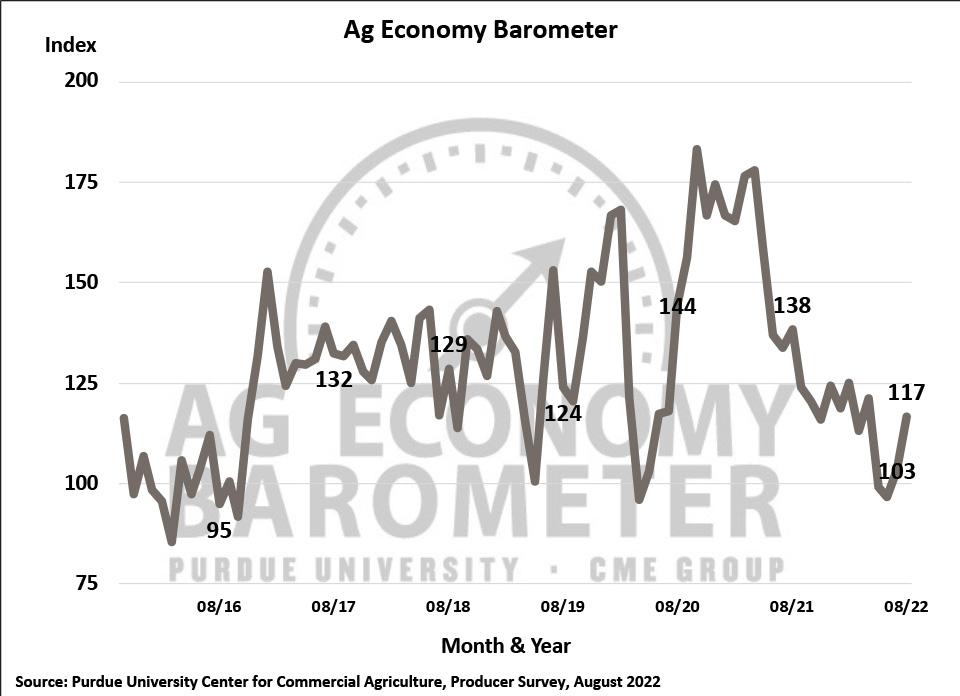
Figure 1. Purdue/CME Group Ag Economy Barometer, October 2015-August 2022.
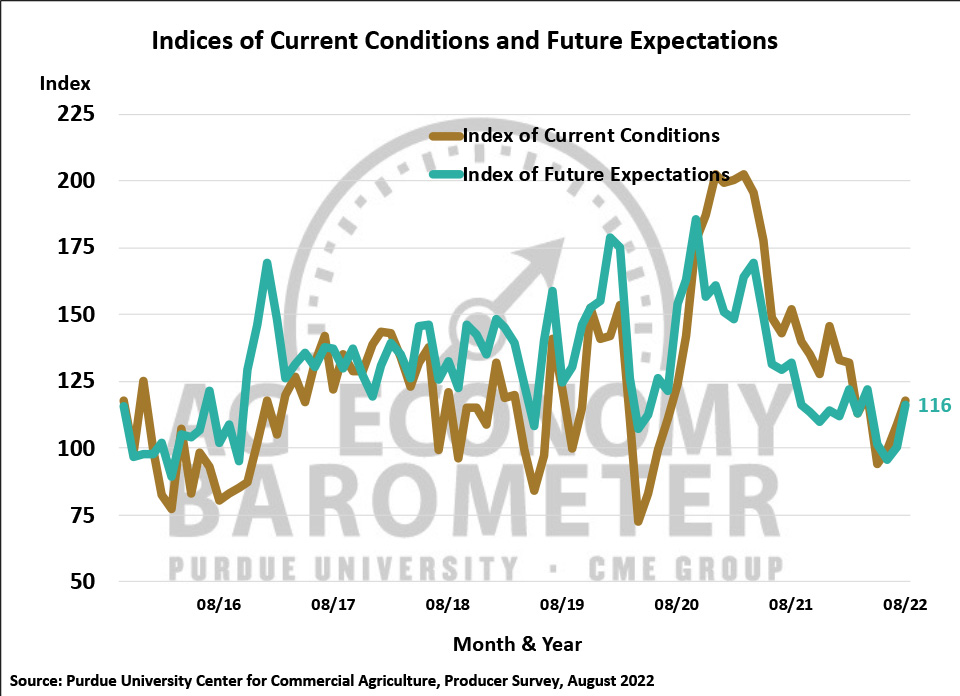
Figure 2. Indices of Current Conditions and Future Expectations, October 2015-August 2022.
The Farm Financial Performance Index rose in August to 99, 11 points higher than a month earlier and 18 points higher than in May when the index was at its low point. Among respondents, there was a noticeable shift this month from producers expecting worse to better financial performance for their farms in 2022. Both corn and soybean prices rallied from their July lows into mid-August which, along with expectations for good yields, helped explain some of the improvement in financial performance expectations. Comparing the August survey’s end date to that of the July survey, prices for fall delivery of soybeans rose by about $1.50 per bushel while prices for fall delivery of corn rose by about $0.25 per bushel. Unlike last month, the improvement in expected financial performance this year carried over into expectations for next year as well. The percentage of producers expecting their farm to be better off financially a year from now rose while those expecting their farm to be worse off declined. Respondents were also a bit more optimistic about the U.S. agricultural economy as a whole in the upcoming year as the percentage expecting bad times for U.S. agriculture declined while those expecting good times rose.
There continues to be a tremendous amount of uncertainty among producers regarding the future cost of items they purchase both for their farms and family usage. Approximately four out of ten producers expect crop input prices in 2023 to be either unchanged or possibly decline by as much as 10%, compared to 2022, while just over half of all producers expect input prices to rise from 1 to 20%. Uncertainty among farmers about rising prices extends beyond crop input prices to consumer items as well. Nearly half (48%) of respondents this month said they expect the rate of inflation for consumer items during the next 12 months to be in the 0 to 6% range. Examining responses to this question over the last five months reveals a shift away from expecting a low rate of inflation (0 to 3%) to expecting a higher rate of inflation (3 to 6%). On the other end of the spectrum, the percentage of producers expecting very high inflation of over 10% declined from about one-third of respondents in the April through June surveys to 18% in the August survey.
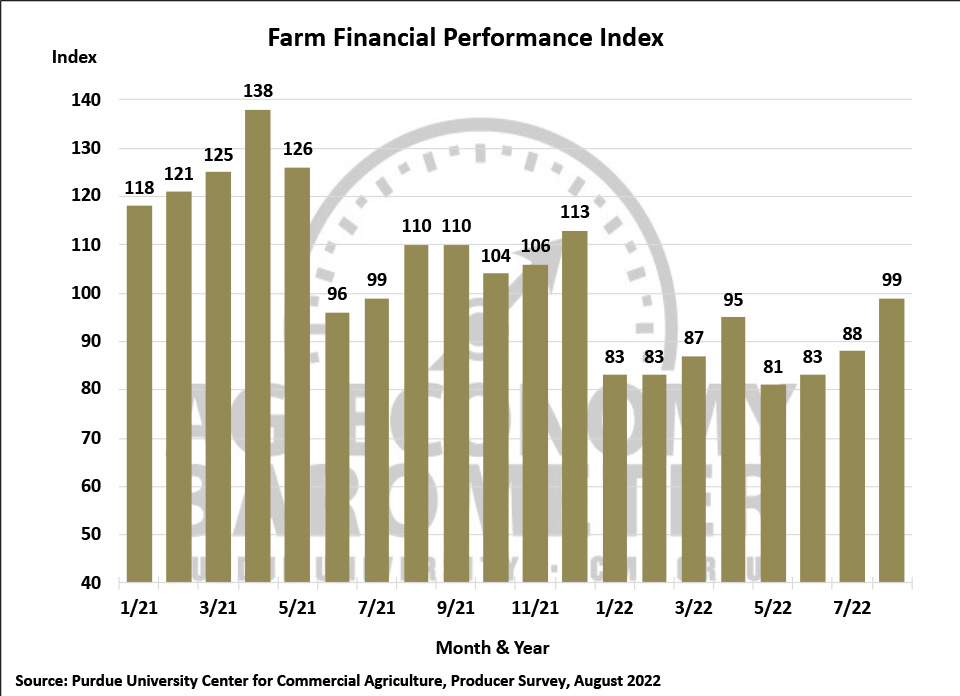
Figure 3. Farm Financial Performance Index, April 2018-August 2022.
There was a small improvement in the Farm Capital Investment Index in August as the index rose 3 points to a reading of 39. However, August was the sixth month in a row that the index remained below 40 indicating producers still view this as a relatively poor time to make large farm machinery and building investments. In a follow-up question posed in both the July and August surveys, respondents indicated the number one reason for thinking now is a bad time for these major capital expenditures is the increase in prices that’s taken place. This month nearly half (49%) of farmers in our survey chose an increase in prices as their primary reason for viewing now as a bad time for making large investments. Despite the negative sentiment expressed about this being a bad time for large investments, the percentage of producers who say they plan to reduce their farm machinery purchases has been declining since spring. In March, 62% of respondents said their farm machinery purchases in the upcoming year would be lower than a year earlier. This month that percentage fell to 49%, the first time it’s been less than 50% since last December. Plans for farm building purchases also improved somewhat as well with responses shifting from the reduce to about the same categories.
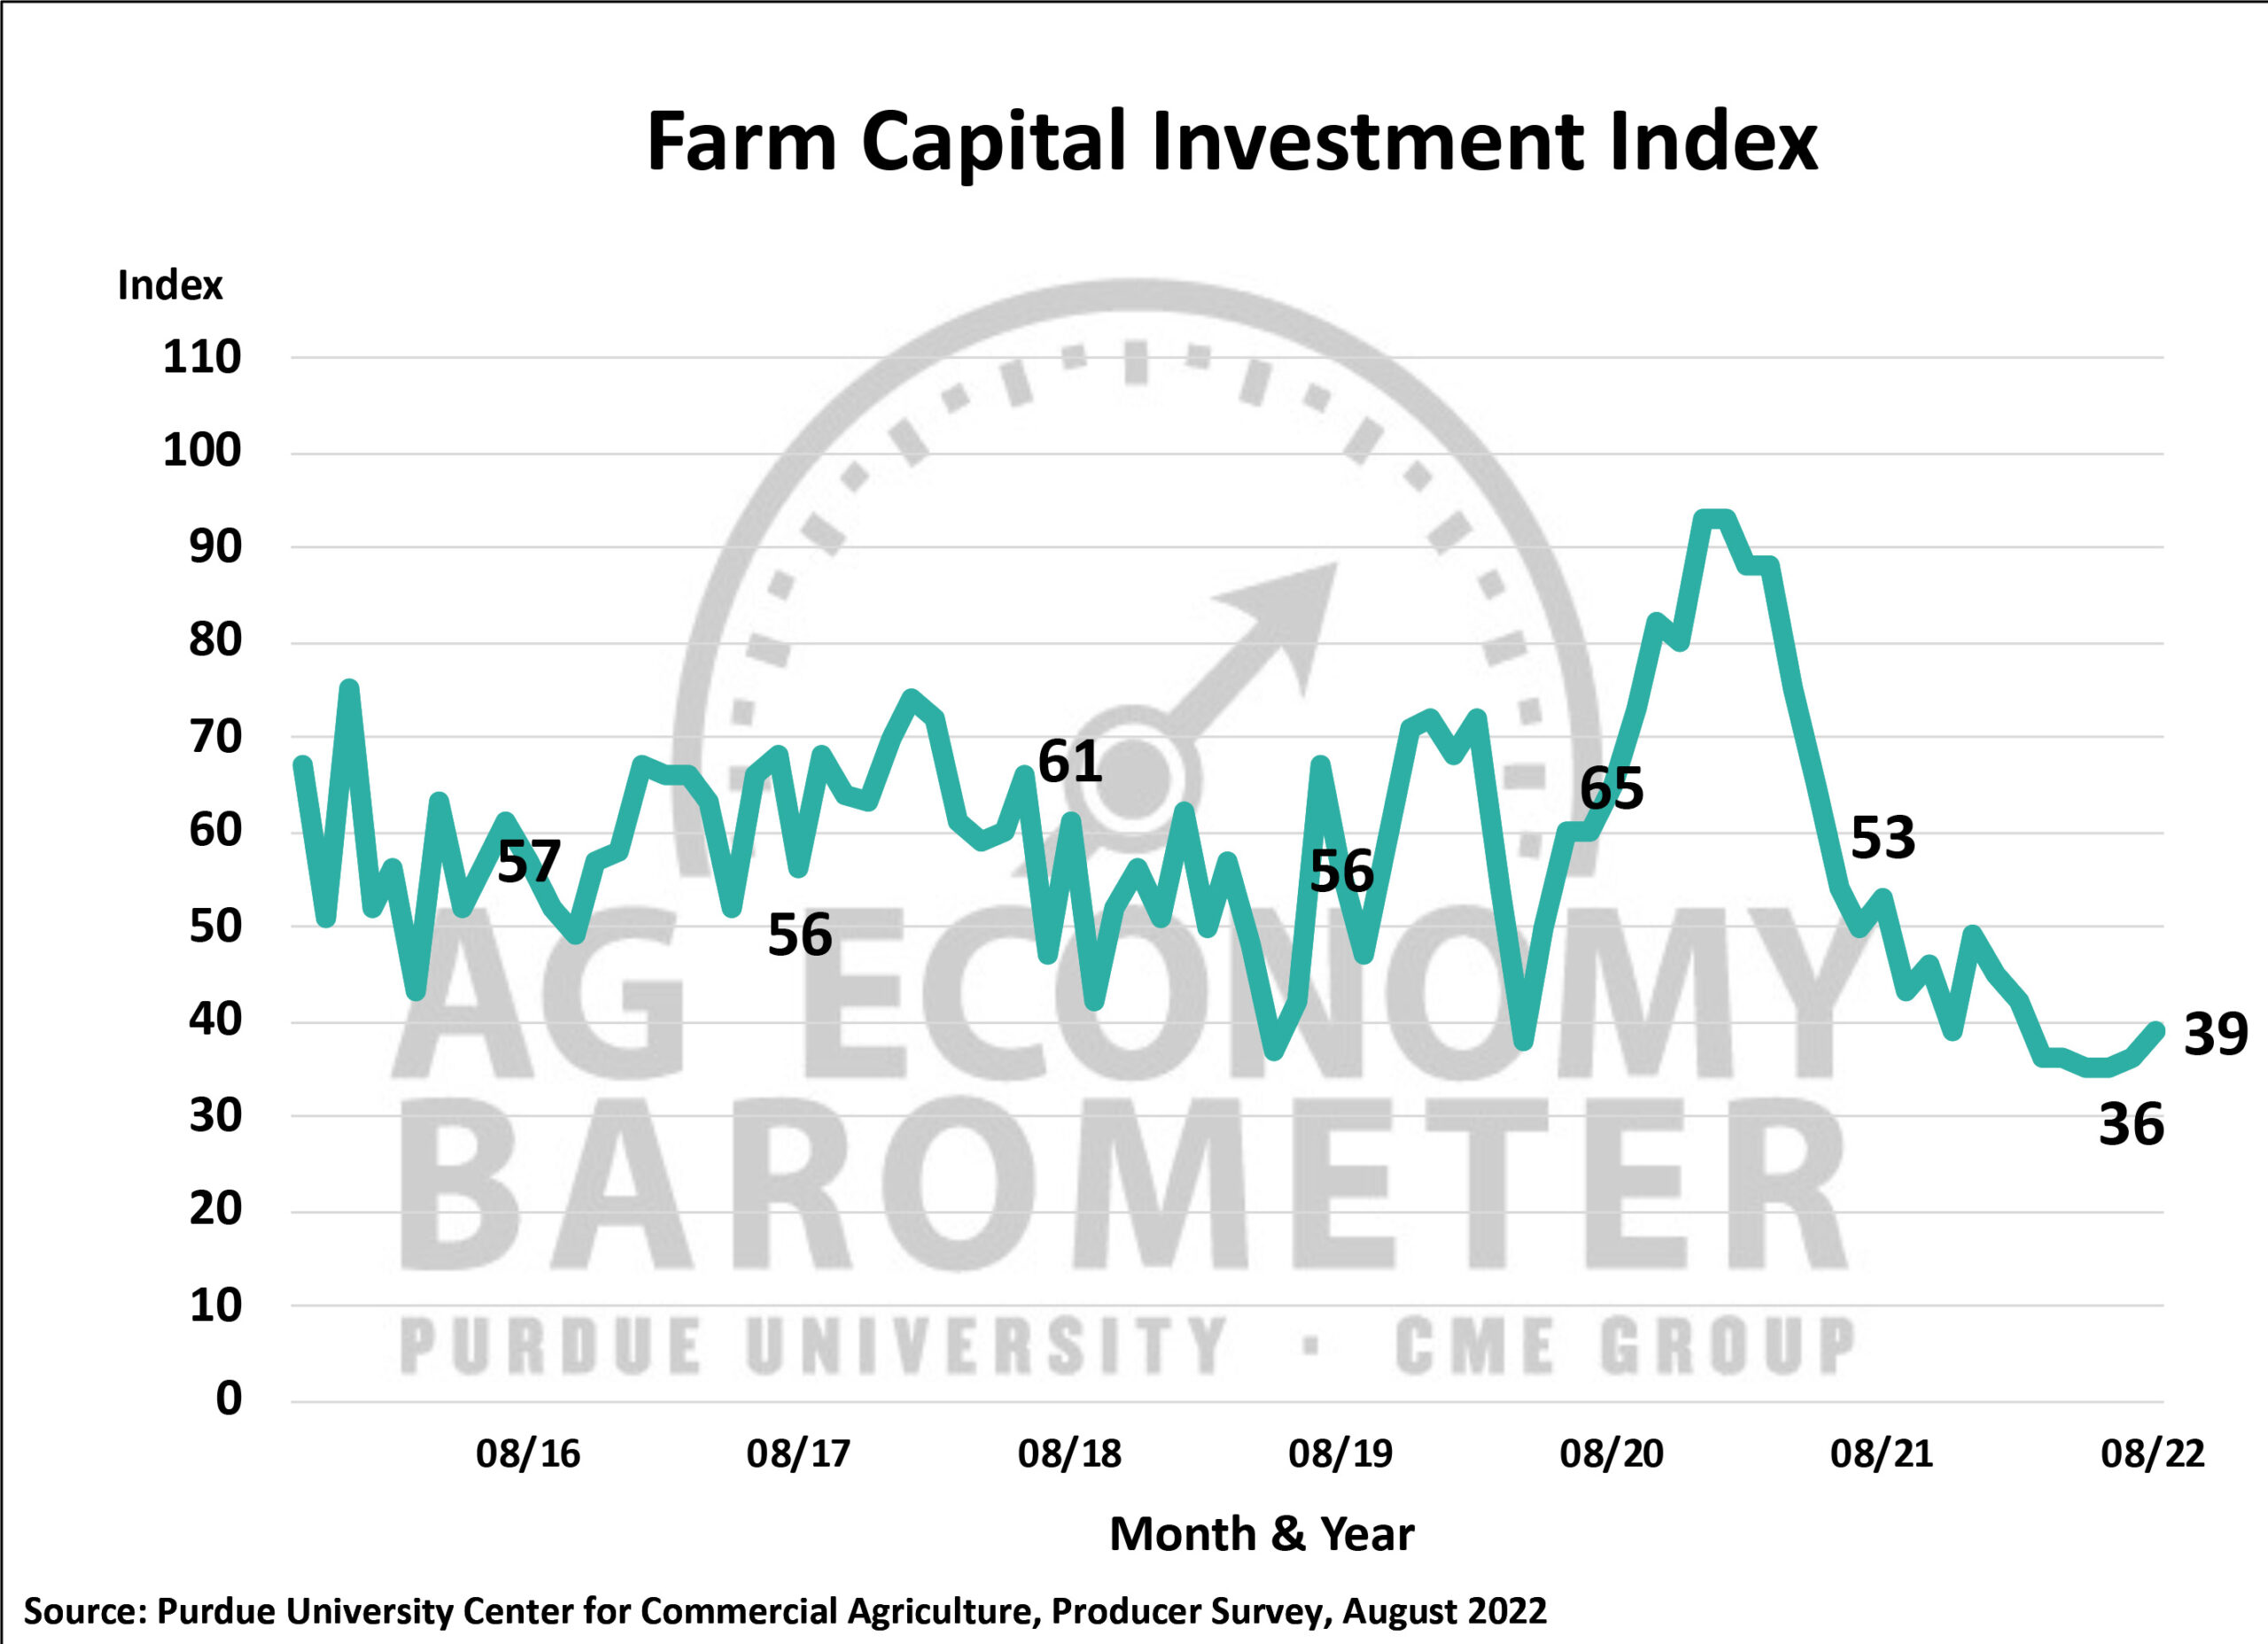
Figure 4. Farm Capital Investment Index, October 2015-August 2022.
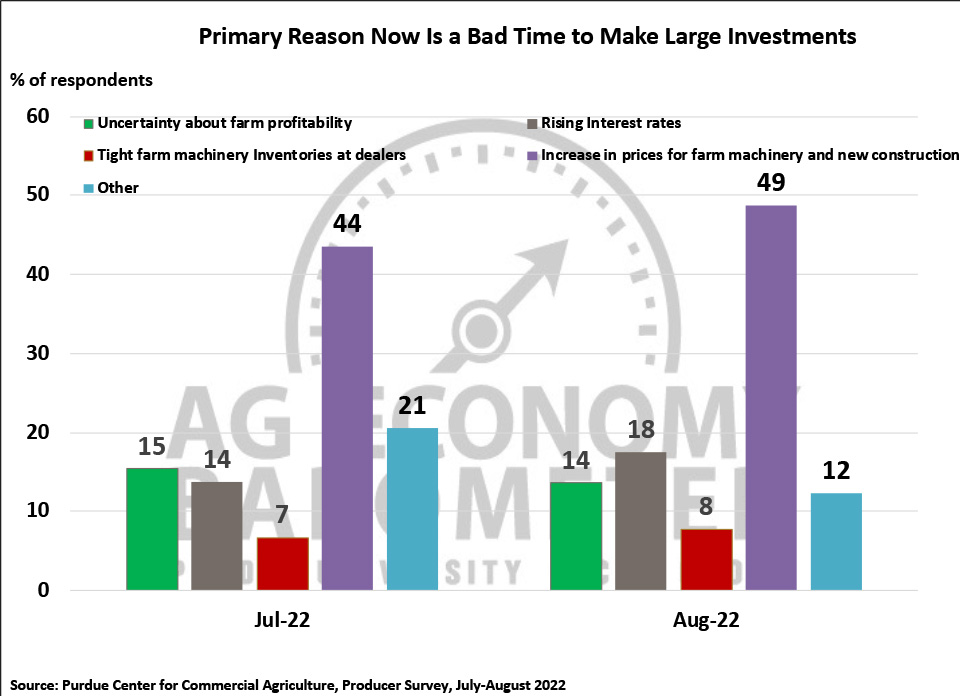
Figure 5. Why is Now a Bad Time to Make Large Investments?, August 2022.
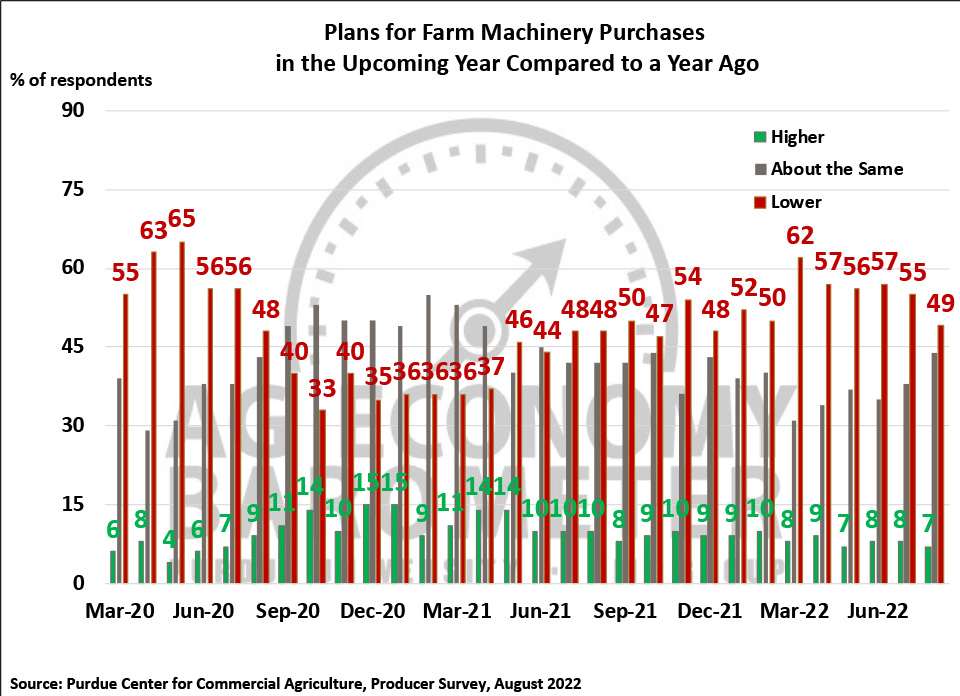
Figure 6. Plans for Farm Machinery Purchases in the Upcoming Year Compared to a Year Ago, March 2020-August 2022.
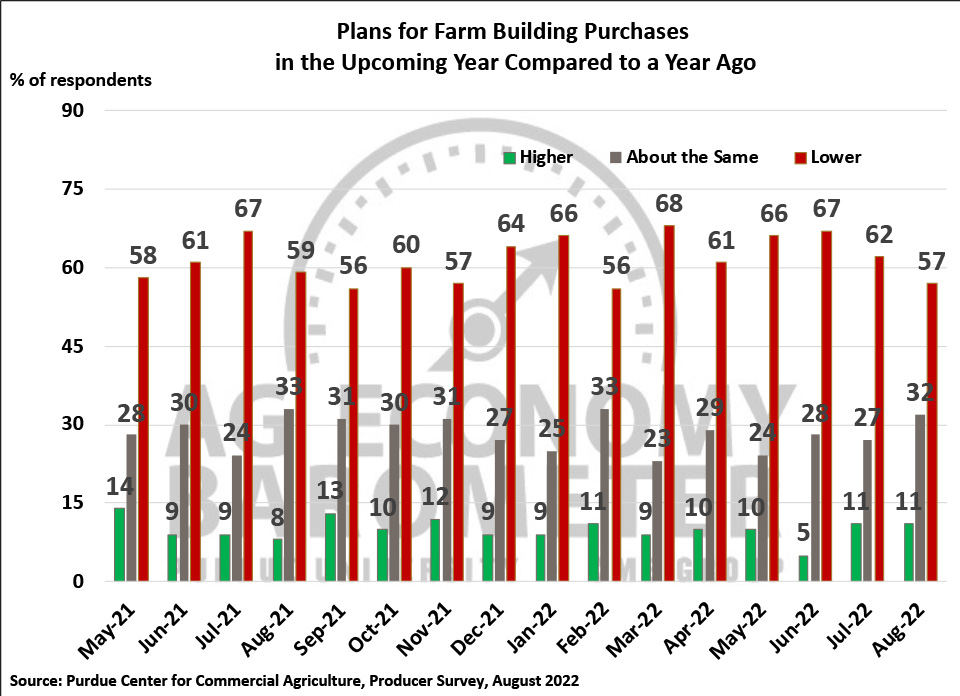
Figure 7. Plans for Constructing New Farm Buildings and Grain Bins, May 2021-August 2022. Plans for Constructing New Farm Buildings and Grain Bins, May 2021-August 2022.
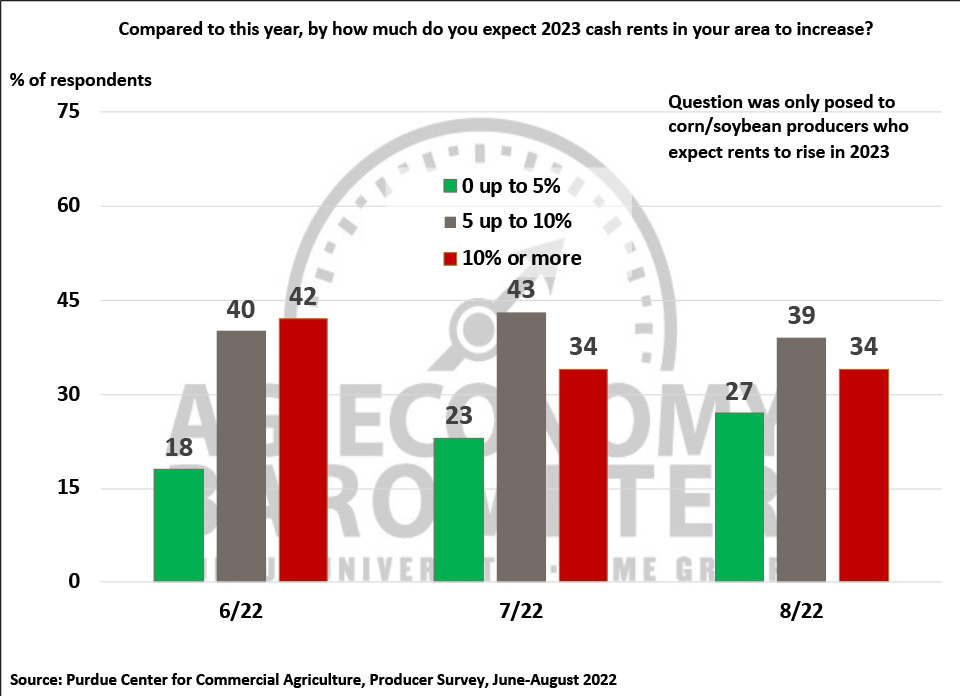
Figure 8. Percentage Increase Expected in 2023 Farmland Cash Rental Rates By Corn/Soybean Producers, June-August 2022.
Four out of ten corn and soybean producers expect farmland cash rental rates to rise in 2023 compared to 2022, which was virtually unchanged from responses received in the July survey. Among respondents who expect rental rates to rise, however, there was a modest shift in how large they expect the rate increase to be. This month 27% of respondents said they expect rates to rise up to 5% compared to 23% who were expecting a rise of that magnitude in July. At the same time, the percentage of respondents expecting rates to rise from 5 up to 10% declined 4 points to 39%.
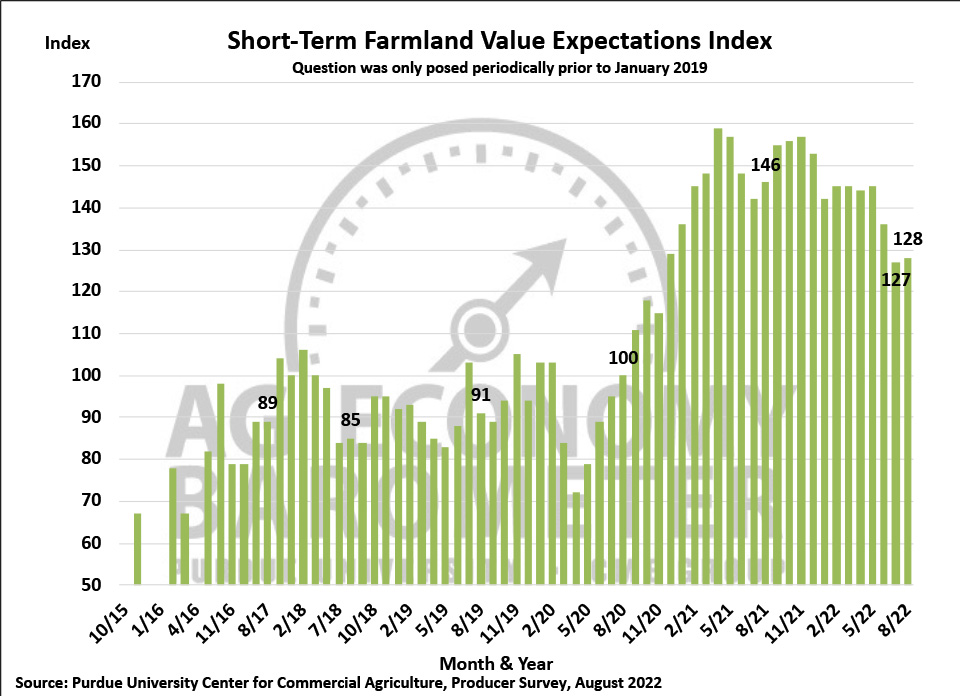
Figure 9. Short-Term Farmland Value Expectations Index, November 2015-August 2022.
The Short-Term Farmland Value Index was nearly the same in August as in July, rising just one point to a reading of 128. The Long-Term Farmland Value Index fell 4 points this month to 146. This month’s small decline in the long-term index follows last month’s 9 point rise. Interestingly, among survey respondents who say they expect farmland values to rise over the next five years, there’s evidence of a trend developing with an increasing percentage of producers choosing non-farm investor demand as the main reason they expect values to rise. This month nearly six out of ten (57%) respondents who expect values to rise chose non-farm investor demand as the main reason.
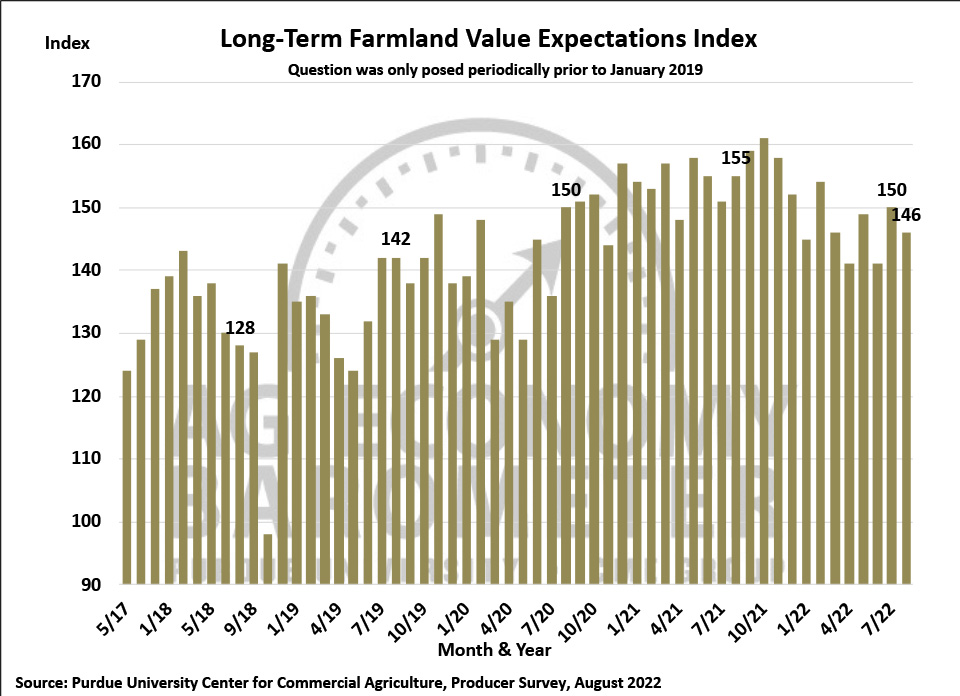
Figure 10. Long-Term Farmland Value Expectations Index, May 2017-August 2022.
Several Ag Economy Barometer survey’s over the last two years have included questions regarding producers’ exposure to and experience with companies offering payments for capturing carbon. In this month’s survey, 9 percent of respondents said they have engaged in discussions with companies offering payments for carbon capture. This is by far and away the highest percentage of respondents indicating they’ve engaged in carbon capture discussions with one or more companies. In prior surveys, the percentage of producers talking to companies about receiving payments for carbon capture ranged from a low of just over 2% to less than 6%. Three-fourths of respondents said the payment rate per metric ton of carbon offered was less than $20. Just 1% of all respondents to the August barometer survey said they have signed a carbon contract. The survey asked respondents who said they engaged in discussions but chose not to sign a carbon contract the minimum payment per acre they would accept to enroll their farm in a carbon capture program. Two-thirds of respondents said the payment rate needed to be at least $30 per acre, suggesting that payment rates need to rise to encourage more participation in carbon capture programs.
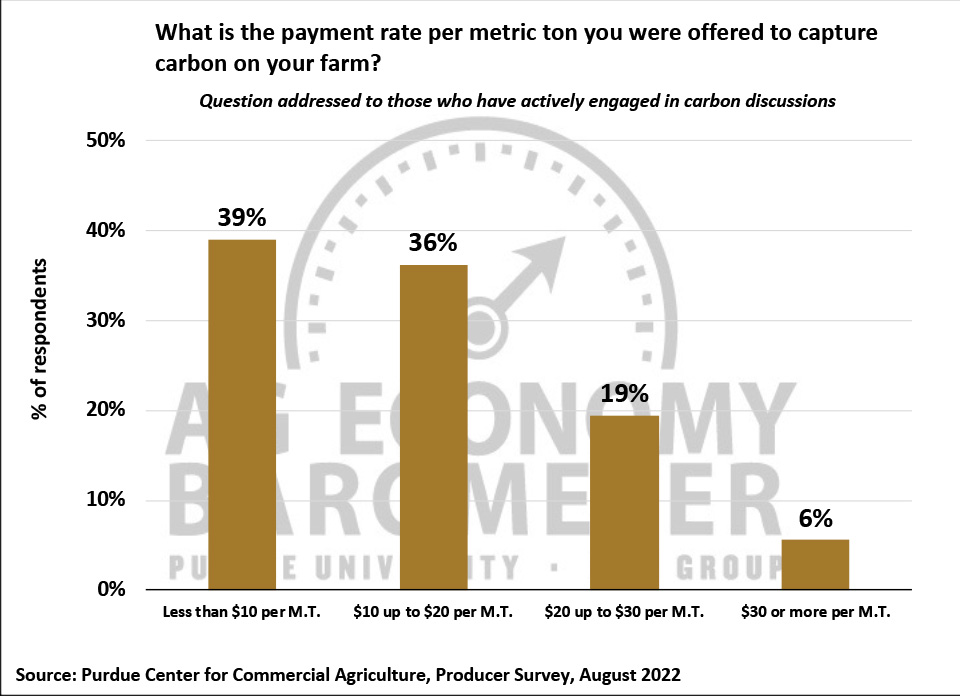
Figure 11. Payment Rates Per Metric Ton of Carbon Captured Offered to Farmers, August 2022.
Wrapping Up
Farmer sentiment improved in August as the Ag Economy Barometer rose 14 points to a reading of 117. Producers expressed more confidence regarding both current conditions on their farms and especially their expectations for the future. U.S. farmers are still uneasy about what input costs will be for crops planted in 2023 as well as the impact of inflation on their family’s expenditures in the year ahead. Despite these concerns, producers remain relatively optimistic about farmland values both in the short and long term as they continue to expect non-farm investor interest to support farmland values. Finally, this month’s survey revealed an uptick in the percentage of farmers engaged in discussions with companies offering payments to sequester carbon. However, just 1% of respondents to this month’s survey said they’ve signed a carbon contract with the majority of those choosing not to sign suggesting that payment rates offered to them remain too low.