Clarification on the ”Land Values” Article in the August PFMR
August 11, 1976
PAER-1976-2
J. H. Atkinson and Gary Van Hoozer, Agricultural Economics Department
![]()
![]()
![]()
![]()
![]()
Several readers have called attention to the fact that the percentage changes in land values calculated from Table 1 of our August Purdue Farm Management Report on land values are not the same as the figures reported in Table 3. For example, West Central average land was
reported to be worth $1275 per acre in the fall of ? 9.75; and $1555 was the projected estimate for the fall of 1976, or an increase of 22 percent. But Table 3 reports a 19 percent change. Why the difference?
The figures in Table 3 were obtained by calculating the percentage change in land values as reported by each person, then averaging these changes. Not all respondents reported values for all time periods, but any estimates they made were included in the averages in Table 1. Thus, there might have been 25 persons who reported both fall ’75 and ’76 values, and 28 who reported spring but not fall estimates.
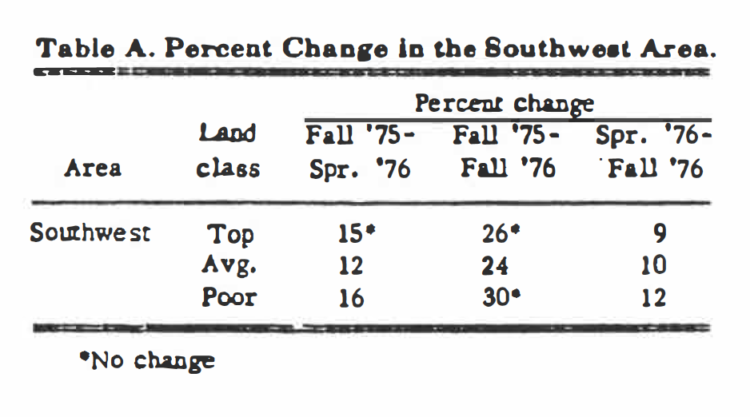
Table A. Percent change in the southwest area.
In addition, a lot of variation in the estimates from the Southwest area resulted in the percentage changes shown in Table A.
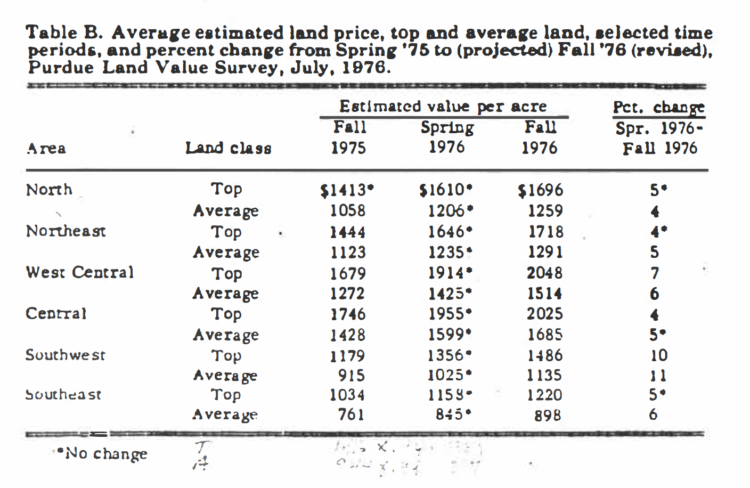
Table B. Average estimated land price, top and average land, selected time periods, and percent change from Spring ’76 to (projected) Fall ’76 (revised), Purdue Land Value Survey, July, 1976.
In order to make Tables 1 and 3 in the August Article approximately comparable, estimates of values for top and average were re-calculated and are presented in Table B here. (Due to wide variability and relatively small numbers of responses, we suggest you use estimates for poor and transitional land only as general guides).
The re-calculations were made adjusting the spring ’76 estimates back to fall ’76 by using the fall-to-spring percentage change shown in Table 3 of the original article. The fall ’75 estimate was then increased by the fall-to-fall percentage change (Table 3).
The results differed slightly from the figures in Table l of the August article – less than $15 per acre for half of the estimate, and a maximum of $41 per acre. Some of the percentage changes from Spring ’76 to fall ’76 also changed by 1 percentage point as shown in the last column of the accompanying table.
![]()
![]()
![]()
![]()
![]()