
Farmland Values Edge Upward
August 1, 1991
PAER-1991-10
Authors: J.H. Atkinson, Professor and Kim Cook, Research Associate
![]()
![]()
![]()
![]()
![]()
The Purdue land values survey revealed a statewide increase of about 1.8% in the value of average quality bare tillable land in the year ending in June 1991. Early this year, the USDA reported that Indiana farmland values had increased 2% in the year ending in January 1991. The Federal Reserve Bank of Chicago survey of bankers indicated a 3% increase for the year ending in March 1991. This is the fourth year of increasing Indiana land values. According to the Purdue study, top and average land values are 36% above the low levels of 1987.
Statewide Land Prices
The survey showed statewide average increases for the six months ending in June 1991 of 1.6% on top land and 1.4% on average and poor land. These increases are less than were reported for the same period a year ago. Forty percent of the respondents reported that most classes of land increased during the six-month period, 8% reported declines, and 50% felt there was no change in land values. Last year, 64% of the respondents indicated increases in land values and 30% thought they had been stable.
The statewide increase in value for the year ending in June 1991 was 2.8% on top land, 1.8% on average land, and 3.7% on poor land (Table 2). These increases are the smallest since land values turned up in 1987.
Statewide, land with an estimated long-term com yield of 142 bushels per acre had an average estimated value of $1633 per acre (Table 1) or $11.50 per bushel (Table 3). Average land (116 bushel yield) was valued at $1245 per acre, while the 90 bushel poor land was estimated to be worth $893 per acre. Land values per bushel of yield were $10.73 on average land and $9 .92 on poor land. These per bushel figures are $.15 higher than last year on top land, $.09 lower on average land and $.25 higher on poor land.
Transition land moving into nonfarm uses was estimated to have a value of $3163 per acre in June 1991, up 3.5% for the 12 months ending in June (Table 2). Only 37% of the respondents report on transition land values, the range in estimates is quite wide, and the reliability of the averages is not as good as with farmland.
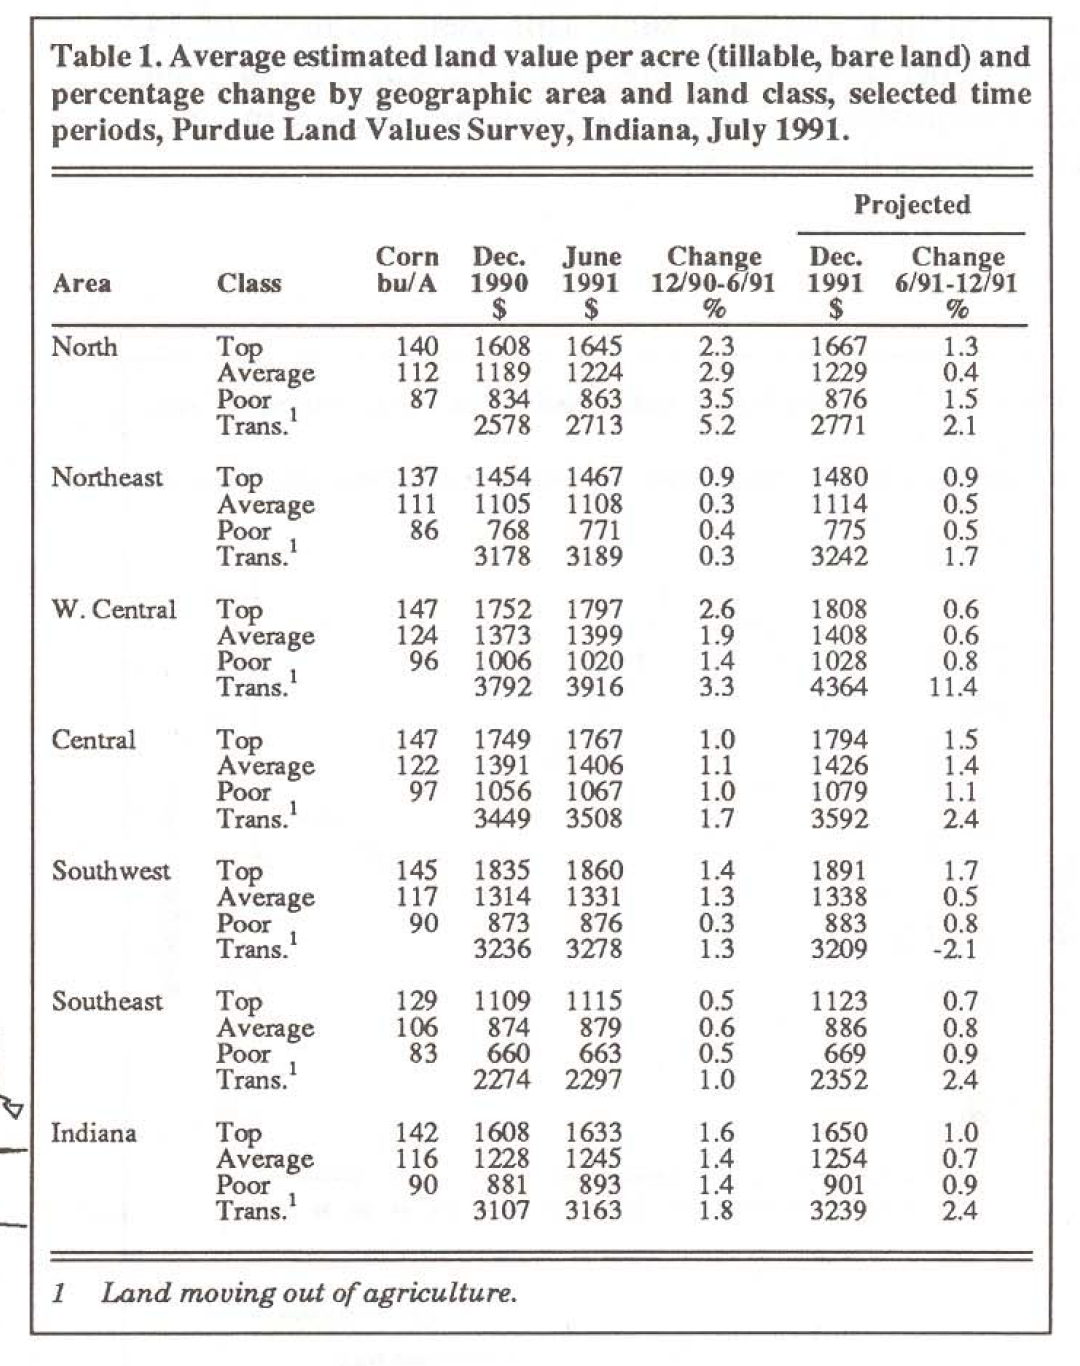
Table 1. Average estimated land value per acre (tillable, bare land) and percentage change by geographic area and land class, selected time periods, Purdue Land Values Survey, Indiana, July 1991.
Statewide Rents Increase Slightly
Cash rents increased statewide from 1990 to 1991 by 1.9% on top land, I.I% on average land, and 3.1 % on poor land (Table 4). The estimate for average land was $88 per acre, $1 more than last year’s estimate. Rent per bushel of estimated yield was $.77 on top land, $.76 on average land, and$. 74 per bushel on poor land. Cash rent on average land in 1991 was 17% below the record 1981 level and equal to the 1978 estimate (Figure 1).
Statewide cash rent as a percentage of estimated land value was unchanged from 1990 (Table 4). Average figures for both years are slightly below 7% for top land, 7.1 % for average land, and 7.5% for poor quality land. In 1979, rent reported for average and top cropland was only 4.8% of the estimated value of the land. Land values fell faster than cash rents in the early 1980s, so that rent as a percentage of average land value rose to 8.1 % by 1986 and has fallen a full percentage point since then.

Table 2. June 1990 and June 1991 average estimated land value (tillable, bare land) and percentage change by geographic area and land class, Purdue Land Values Survey, July 1991.
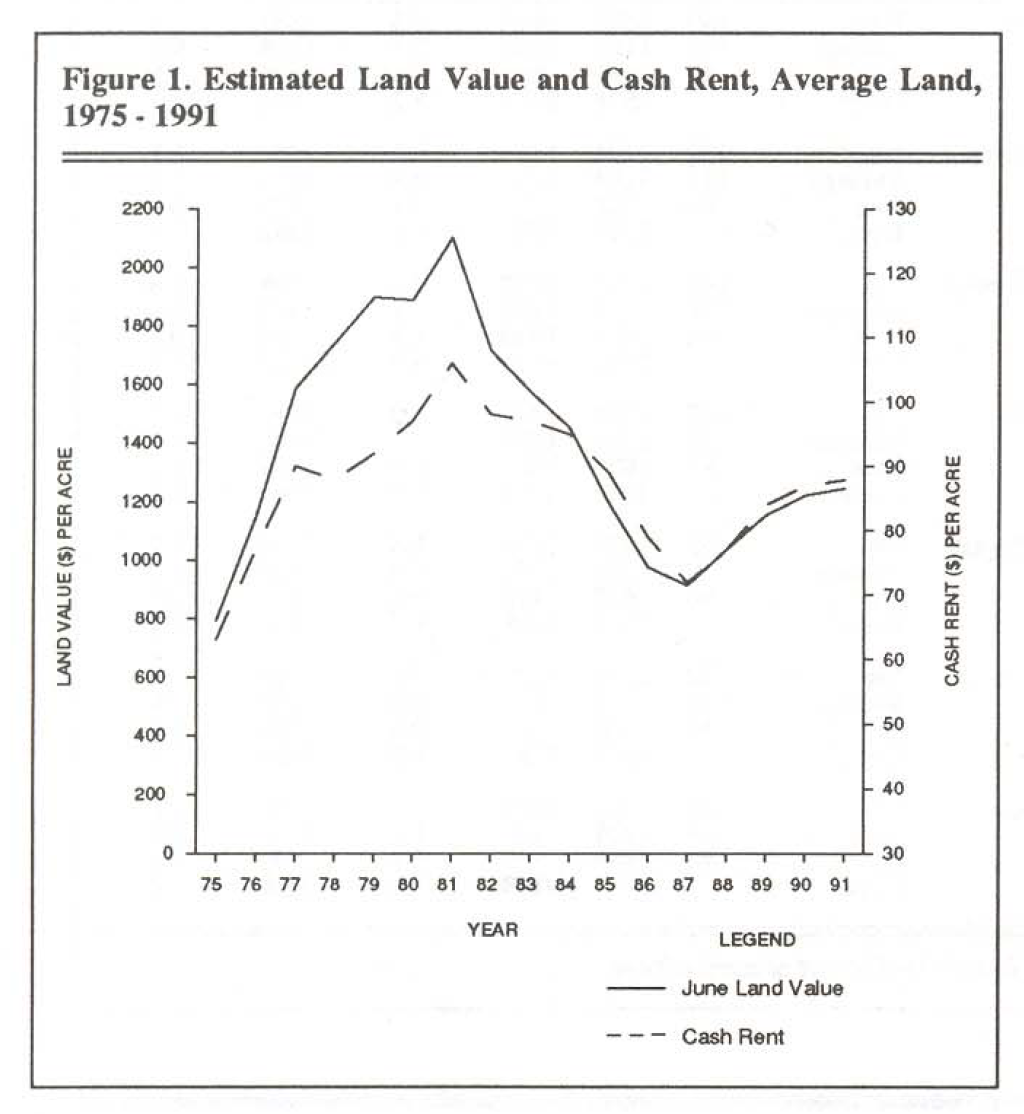
Figure 1. Estimated Land Value and Cash Rent, Average Land, 1975 – 1991
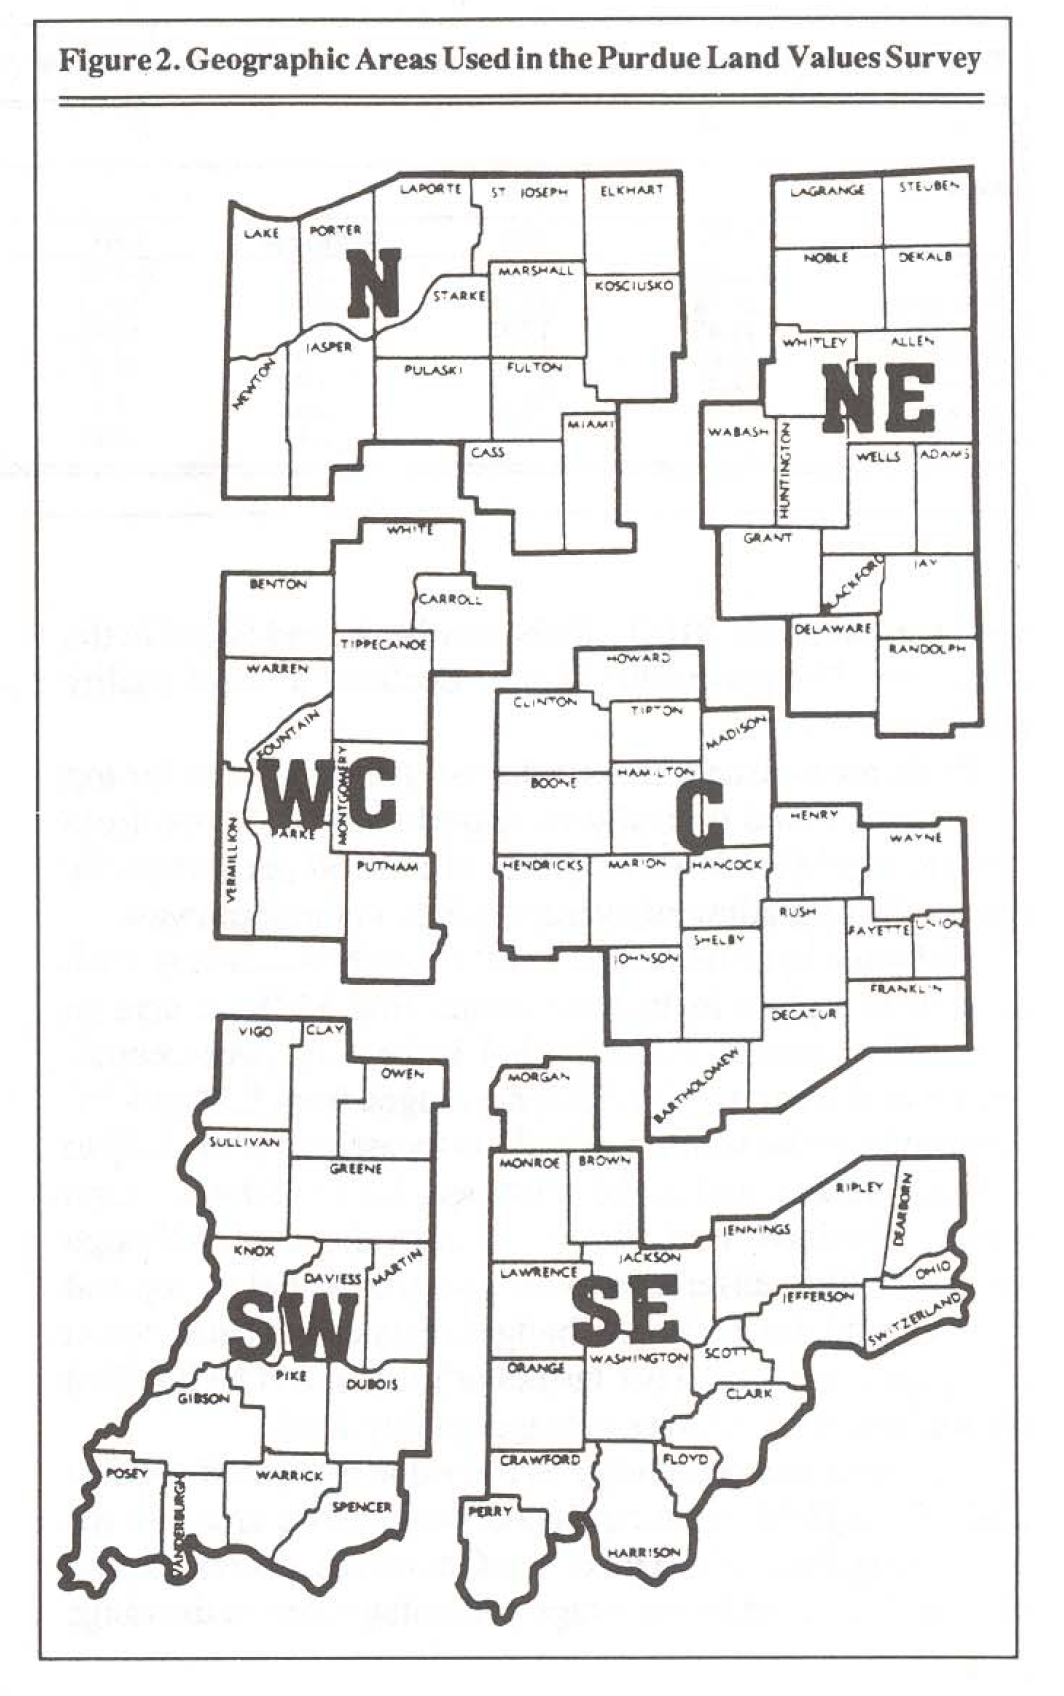
Figure 2. Geographic Areas Used in the Purdue Land Values Survey
Area Estimates
Farmland value increases from December I 990 to June 1991 were under 1.5% in the northeast, central, southwest, and southeast areas (Table 1). Increases in the north and west central areas were somewhat higher, mostly falling in the range of about 2-3%.
The greatest increase in farmland values from June 1990 to 1991 was 9.4% for top-quality land in the west central area (Table 2). About a third of this increase was due to an average increase in the corn yield which respondents assigned to top-quality land. This yield estimate of 147 bushels per acre is the same as the central area, and land value estimates for all three classes of land in those two areas vary by less than $50 per acre.
Farmland values were strong in the southwest where the 12-month increases ranged from about 5-8%. Increases also were reported in the north, ranging from 4% for top land to 8.4% for poor land.
Three areas of the state, the northeast, central, and southeast, registered slight declines for the year in one or more classes of land. Thus, while the statewide estimates show small increases in farmland values, there are indications of slight declines in some areas of the state.
The percentage increase from the lows of 1987 has been greater in the southwest than in other areas, ranging from 50-55% for all classes of land. In the other areas, top land has increased between 31-41%. This range was greater for average land, 28-45%, and poor land, 31-52%.
Last year, we noted that land with the same yield potential in the southwest[1] would have a higher per-acre value than land in the central area. Yield estimates increased this year in the southwest and the average per-acre value of top land ($1860) moved ahead of the central area value which had been the highest in the state for several years. Land rated at a 145-bushel com yield had an average value of $1860 or $12.83 per bushel (Table 3). This per-bushel figure for top land was from $11.75 to $12.22 in the north, central, and west central areas, $10.71 in the northeast, and $8.64 in the southeast. The per-bushel figures declined as land quality declined.

Table 3. Land value per bushel of estimated corn yield, Purdue Land Values Survey, Indiana, July 1991.
In all areas except the southwest, per-acre rents for top and average land typically increased a dollar or two from 1990 to 1991 (Table 4). Increases of $5 to $7 per acre partly reflect the upgrading of average yields in the southwest.
Although land values were highest in the southwest, cash rents were highest in the west central area, $128 per acre on top-quality land or $.87 per bushel. In the north, west central, and central areas, per-bushel rents ranged from $.76 to $.87. The range in the southwest and northeast was from $.69 to $.76 per bushel, and in the southeast, $.59 to $.64. As land quality declined, rent per bushel also declined, although there was little difference in the rent per bushel on top and average land. Interestingly, budget analysis indicates that in many situations, $.10 per bushel or more could be justified for top-quality land over average-quality land.
Cash rent as a percentage of the value of top and average land fell slightly in the north and west central areas. In the other areas, there was a mixture of increases, decreases, and no change. These area average percentages fell in the range of 5.9-7.9%. For many years prior to the early 1970s, cash rent as a percentage of Indiana land values generally fell in the range of 6-8%; however, by 1979, this percentage had fallen below 5% on a statewide basis. With falling land values, the percentage rose, peaking in 1986 with a state estimate of over 8% on average land. We are now back in the “thumb rule” range of 6-8%.
Respondents’ Outlook
There was a decline from last year in expectations for short-run increases in farmland values. Only 39% of the respondents expect some or all classes of land to increase, down from 62% last year. The average amount of increase was also smaller -0.7% for average land (Table 1) versus 1.6% last year. Under 10% expected declines in some or all classes of land, while over half expected no change. Small increases mostly under 1.5% were expected in all areas of the state.
Seventy-eight percent of the 1991 respondents expect land values to be higher five years hence. This year, the group expected an average increase of 9% for the five-year period, down from 13% last year.

Table 4. Average estimated cash rents, bare tillable land, 1990 and 1991, Purdue Land Values Survey, Indiana, July 1991.
Respondents were asked to estimate annual averages over the next five years for corn and soybean prices, the farm mortgage interest rate, and the rate of inflation. The projections they made in each year since 1984 are shown below:
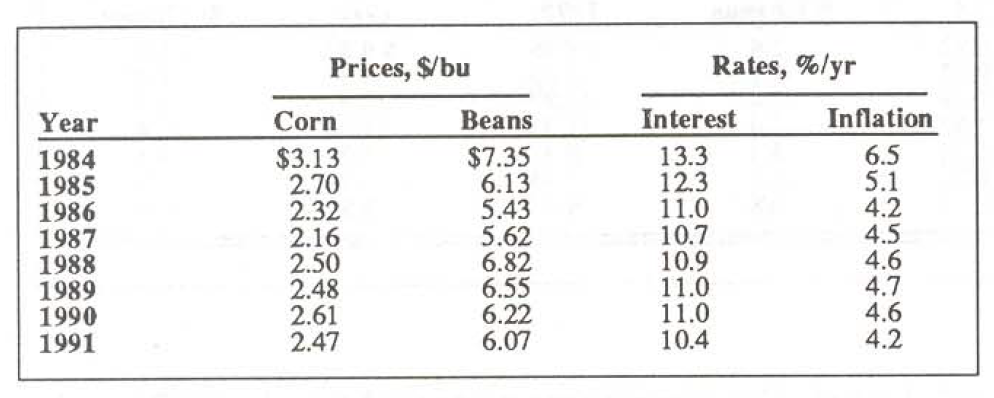
Table 5. Respondent estimated annual averages (over the next five years) for corn and soybean prices, the farm mortgage interest rate, and the rate of inflation.
Lower com and bean price expectations probably were influenced by declines in these prices reflecting late spring expectations of bumper crops. Even these lower expectations are higher than they were in 1987 when several years of declines in both land values and com and bean prices ended. Interest rate expectations dropped from 11 % last year to 10.4%, the lowest level since this question was first asked in 1983. The expectations for inflation declined to 4.2%, a figure lower than was reported in eight of the past 10 years. The difference between the interest rate and the inflation rate, sometimes used as a rough measure of the “real” interest rate, was 6.2, slightly lower than it has been in the past three years.
Current farm mortgage interest rates as low as 10% or less are favorable relative to rates over most of the past decade or more and may provide some stimulus to the demand for farmland.
Our Views of the Future
At the time this survey was conducted in June, bumper crops were in prospect, corn and bean prices had drifted downward, and a leveling off or decline in farmland prices appeared likely. But by mid to late July, dry weather in major production areas of Indiana, Illinois, and Ohio raised the possibility of significant reductions in U.S. production of com and beans. As of this writing, the extent of drought damage is uncertain. There is uncertainty with regard to prices and the extent of reductions in previous expectations of fall stocks of com and beans. This uncertainty extends to the future direction of farmland values. Some farmers in some areas of Indiana will suffer such low yields that higher corn and bean prices will not prevent financial stress. Some farmers will be forced to sell land and in areas hard hit by the drought, prices may decline, at least in the short run.
On the other hand, many Indiana farmers will have crop incomes equal to or higher than their earlier expectations if the drought reduces overall yields sufficient to boost expectations of harvest-time prices well above the earlier $2 level for com and $5 or less for beans. In areas where yields are fairly good, some strength could develop in land prices. If U.S. yield estimates drop to levels which indicate carryover stocks this fall of under a billion bushels of com and under 200 million bushels of beans, price expectations for 1992 and beyond likely would be improved considerably over the expectations of last spring and early summer. This raises the possibility of additional strength in the land market, at least until next summer’s assessment of 1992 yields. In summary, we are suggesting some short-run weakness in land values in areas hard hit by drought, but with the possibility of widespread modest strength after harvest.
The land values survey was made possible by the cooperation of professional farm managers, appraisers, brokers, bankers, and persons representing the Farm Credit System, the Farmers Home Administration, ASCS county offices, and insurance companies. Their daily work requires that they keep well-informed about land values and cash rent in Indiana. To these friends of Purdue and Indiana agriculture, we express our sincere thanks. They provided over 400 responses representing most of Indiana’s counties. Thanks also to Kelly Neskov of the Department of Agricultural Economics for her help in conducting the survey and to Ag Econ professors Chris Hurt and Don Pershing for their review of this report and helpful suggestions.
[1] There are two possible reasons for this increase. First, the composition of the respondent group changes from year to year as new names are added to the mailing list to replace those who drop out of the survey. The new respondents in the southwest may have assigned somewhat higher yields than those whom they replaced. Second, repeat respondents in the southwest have tended to increase their yield estimates on top-quality land from the low level to which they had fallen in 1984 following the 1983 drought.
![]()
![]()
![]()
![]()
![]()
