Indiana Farmland Transactions, 2016 – 2020
July 26, 2021
PAER-2021-12
Authors: Todd H. Kuethe, Associate Professor and Schrader Endowed Chair in Farmland Economics; Chad Fiechter, Ph.D. student in the department of agricultural economics
![]()
![]()
![]()
![]()
![]()
The Purdue Land Values and Cash Rents Survey has been an important source of information for Indiana farmland market conditions since 1974. For many years, the survey was the only source of disaggregated farmland price information for the state, but among other sources, detailed transaction information has emerged in recent years. This article compares the information obtained from recent years from both the Purdue Land Values and Cash Rents Survey and a detailed transaction record. We highlight two pieces of information that are captured by both sources, transaction volumes and prevailing per acre prices, and highlight the relative strengths of each source.
Indiana farmland transaction records were obtained from Land Sales Bulletin, which collects sales records from disclosure forms filed in all 92 Indiana counties. The sales disclosure forms include a number of attributes for each transaction, including acreage, date of sale, and price per acre. In addition, the transaction record includes comments that outline additional important features of the sale and parcel. In order to estimate the volume of sales, we screen the data on a number of characteristics outlined in the disclosure comments. First, we eliminate all sales between related parties, as transaction prices generated through non-“arm’s length” sales are often not reflective of broader pricing patterns. Second, we eliminate sales below $100 per acre or above $50,000 per acre to minimize the influence of statistical outliers or transactions that are not likely representative of the broader farmland market. Third, we remove all sales that include forests, wetlands, or wildlife uses so that the transactions represent bare crop or pastureland, consistent with the definitions used in the Purdue Land Value and Cash Rent Survey. In sum, we observe 26,430 transactions between January 1, 2016 and December 31, 2020.
Farmland Turnover Rates
Between 2016 and 2020, the majority of Purdue Land Values and Cash Rents Survey respondents reported that less farmland was available on the market compared to the previous June, with the exception of 2018 (Table 1). Economic theory suggests that farmland prices should rise as the amount of land available to purchase declines, all else equal. And as a result, the reported decline in farmland available on the market has been credited with supporting farmland price growth in recent years.
Table 1: Share of Respondents Indicating Less, Same, or More Farmland on the Market than in the Previous June
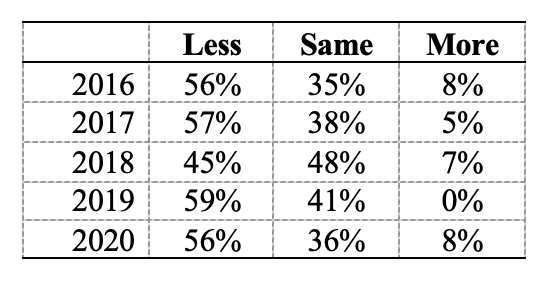
Table 1: Share of Respondents Indicating Less, Same, or More Farmland on the Market than in the Previous June
Figure 1 plots the number of transactions (solid line, left axis) and total acreage sold (dashed line, right axis) by month between January 2016 and December 2020. Contrary to the opinions expressed by Land Values and Cash Rents Survey respondents, Figure 1 suggests that farmland transaction volumes and acres sold were relatively stable throughout this period.
Figure 1: Monthly Number of Transactions and Transacted Acres, 2016 – 2020
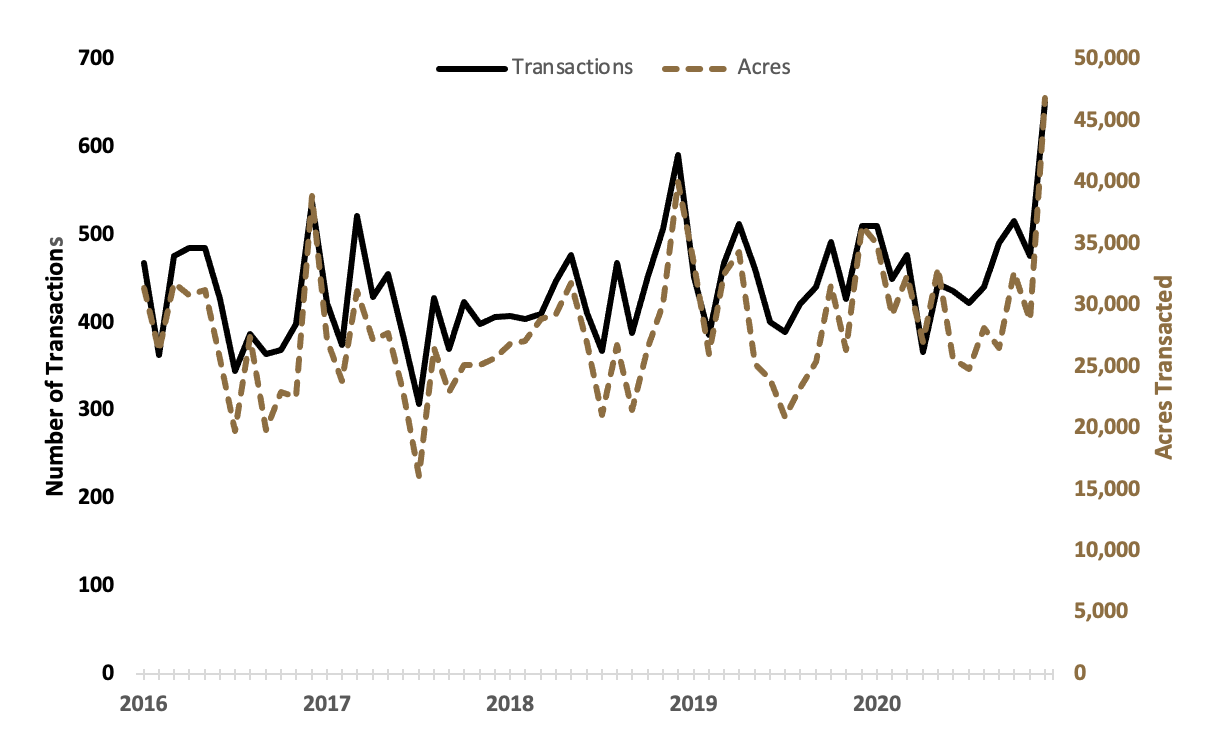
Figure 1: Monthly Number of Transactions and Transacted Acres, 2016 – 2020
The variability in Figure 1, however, suggests that farmland sales may be seasonal. Figure 2 similarly plots the mean number of transactions by month between 2016 and 2020. While transaction volume is relatively stable, December has the highest number of transactions on average, at 539.8. In addition, transaction volumes tend to be smaller in the summer months, with July (367) exhibiting the fewest average number of sales per month. This is likely driven by the fact that major Indiana crops are in the ground during the summer months, which complicates buying and selling the land.
Figure 2: Mean Number of Transactions by Month, 2016 – 2020
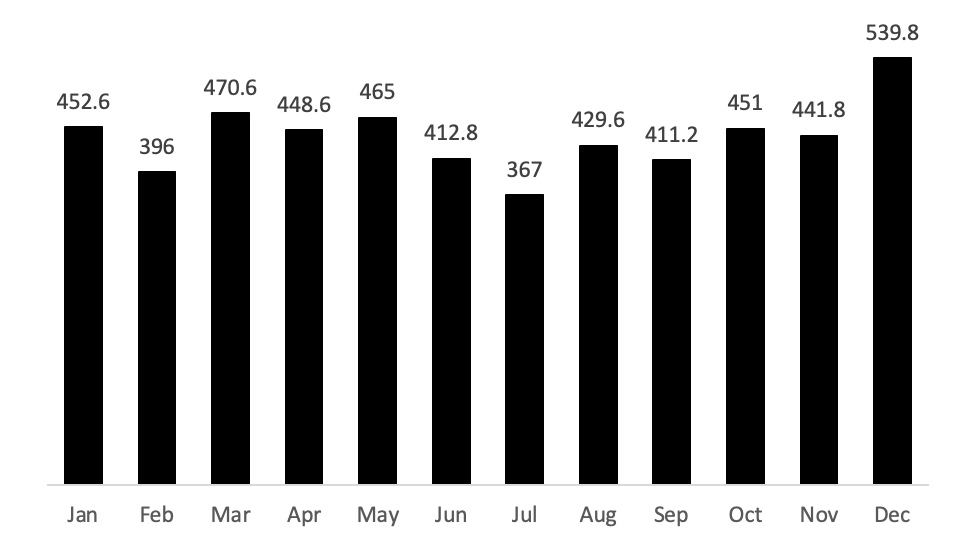
Figure 2: Mean Number of Transactions by Month, 2016 – 2020
Figures 1 and 2 examine the transactions across all 92 Indiana counties, in aggregate. However, given that farmland, by definition, is tied to a specific location, farmland markets are often driven by localized economic forces, such as land development patterns or agricultural production volumes. Figure 4, therefore, plots the total number of transactions in each of the six regions of the Land Values and Cash Rents Survey (Figure 3). Figure 4 suggests that the Central region has the largest number of transactions in most years, and the neighboring West Central region has the fewest.
Figure 3: County Clusters used in the Purdue Land Values and Cash Rent Survey to create regions
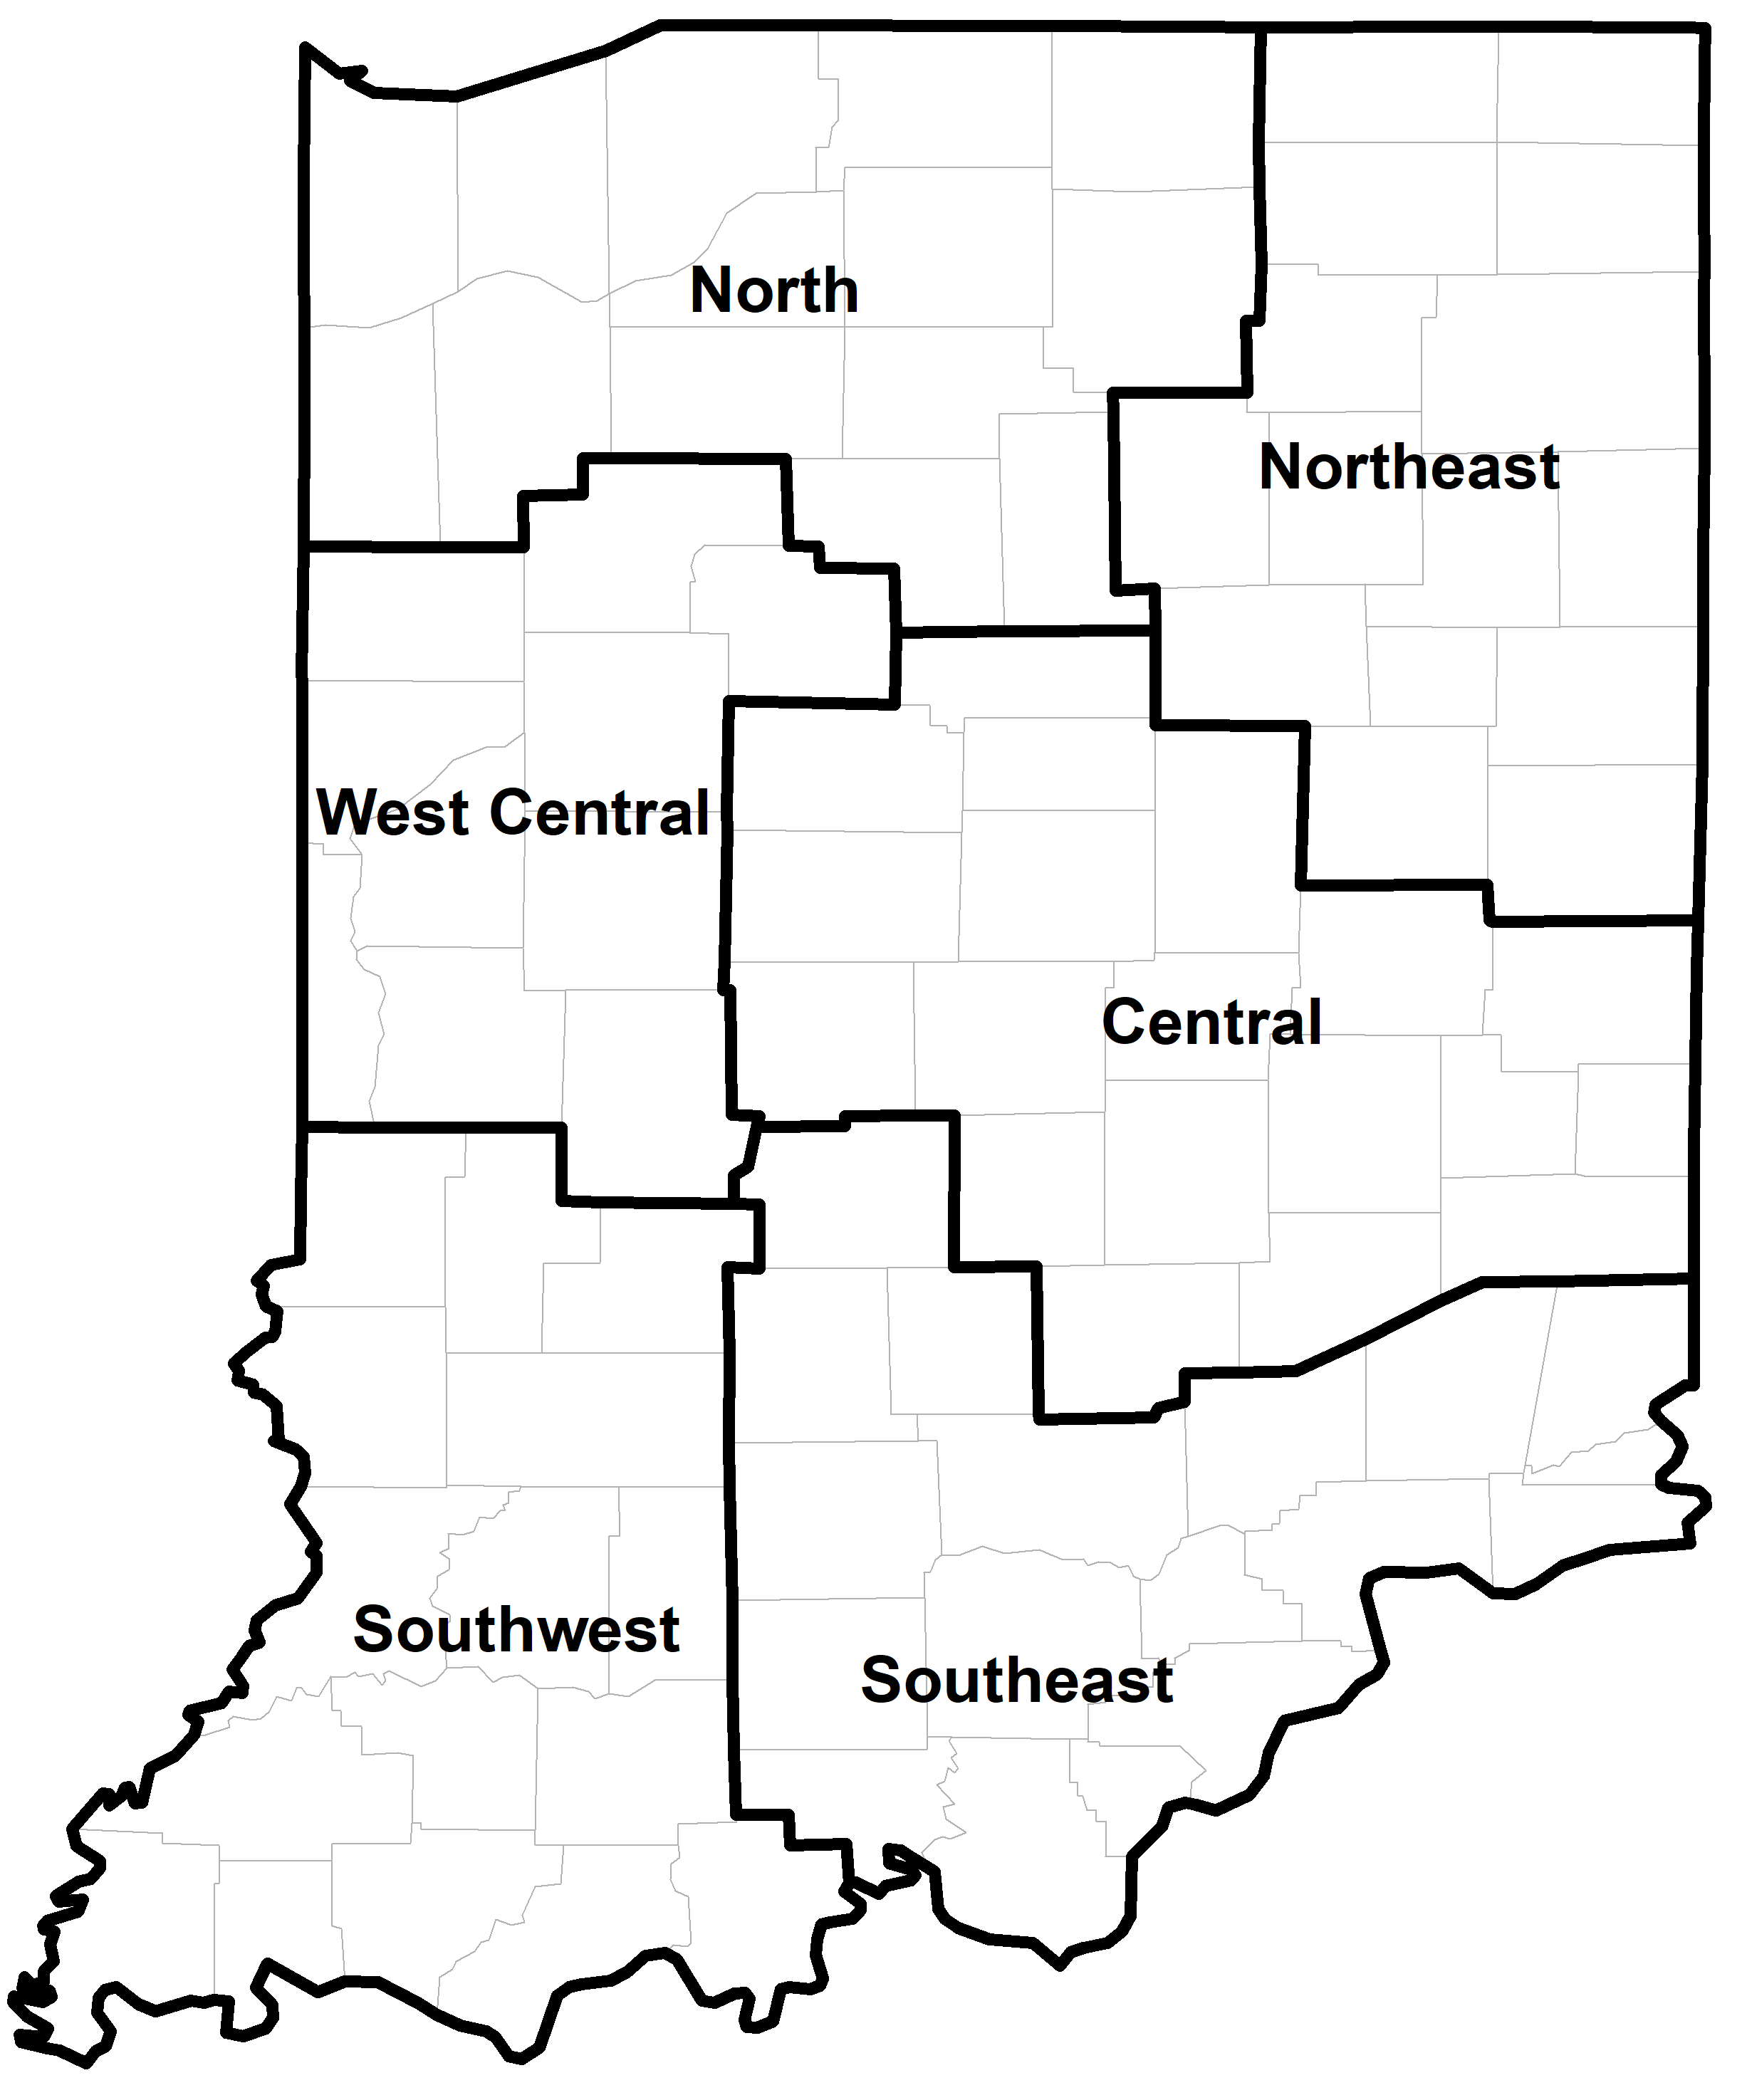
Figure 3: County Clusters used in the Purdue Land Values and Cash Rent Survey to create regions
Figure 4: Number of Transactions by Region, 2016 – 2020
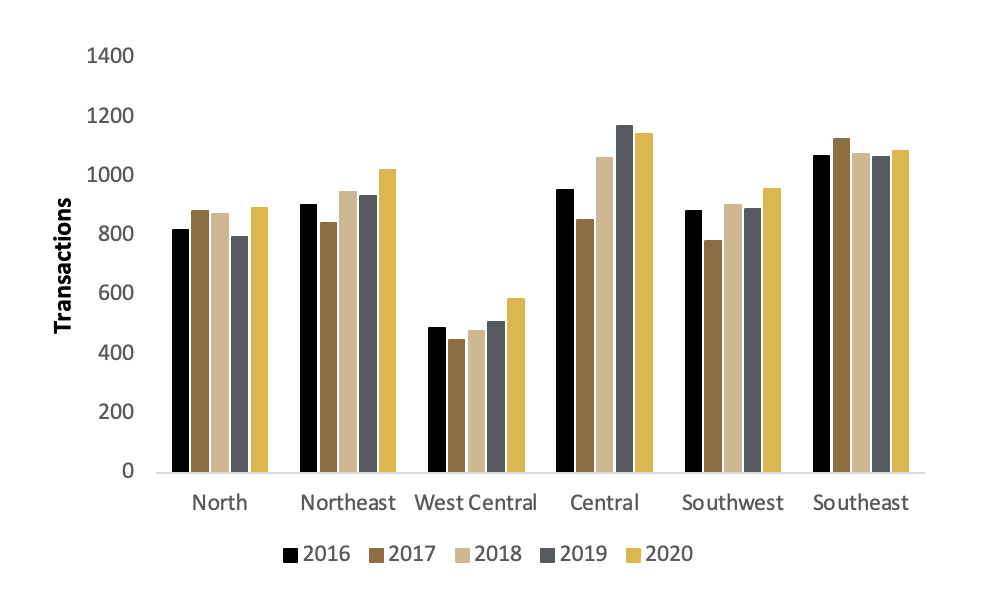
Figure 4: Number of Transactions by Region, 2016 – 2020
The number of transactions in a given region, however, is driven in large part by the amount of farmland in each region. Figure 4 similarly plots an estimate of the turnover rate for each region and for the state of Indiana as a whole. The aggregate stock of farmland in each region is difficult to measure. The turnover rates plotted in Figure 5 are calculated by dividing the transacted acres in each region by the total farmland acreage obtained from the most recent USDA Census of Agriculture. Conducted every five years, the Census of Agriculture provides detailed measures of farmland acreage in 2012 and 2017. Thus, the estimated turnover rate considers the transactions in 2016 relative to the 2012 Census of Agriculture, but for all remaining years, we use the 2017 Census.
As shown in Figure 5, the statewide turnover rate was approximately 2.5% in 2020. The turnover rates are relatively stable at the state level and within each region. The Southeast region has the highest estimated turnover rate at 3.6%, while the Northeast region has the lowest estimated turnover rate at 2.2%. In sum, Figure 5 suggests that roughly 2% to 2.5% of farmland changes hands in a given year.
Figure 5: Approximate Turnover Rate by Region, 2016 – 2020
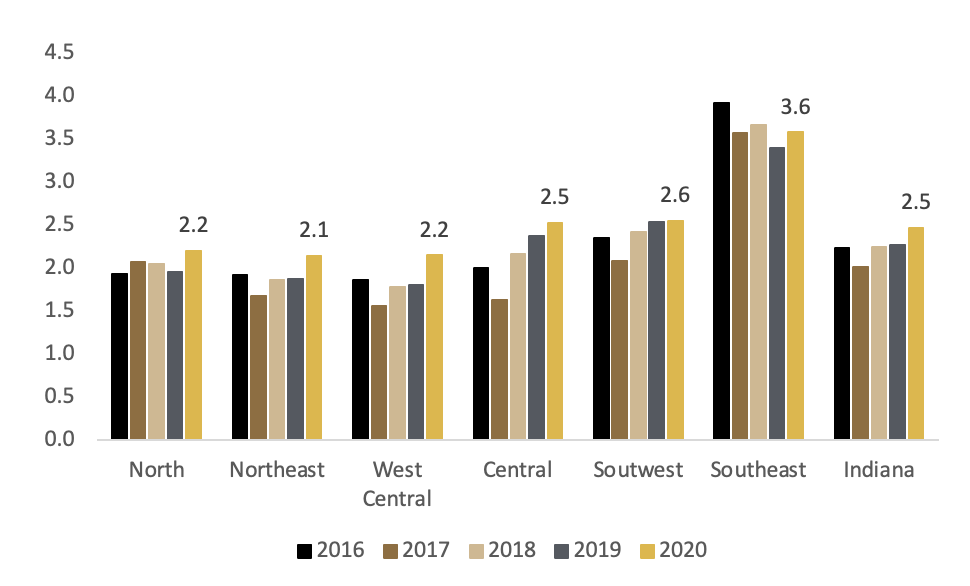
Figure 5: Approximate Turnover Rate by Region, 2016 – 2020
Average Farmland Prices
As previously stated, the transactions record also reports the price per acre for all transactions. Figure 6 plots the state-wide mean (average) per acre price for all farmland within our restricted dataset. While the transaction record provides a wealth of information on parcels sold, it is difficult to differentiate by land quality in a manner that is consistent with the Purdue Land Values and Cash Rent Survey. Figure 6 also includes the state-wide estimated per acre value of farmland across three land quality gradients: top, average, and poor. Figure 6 suggests that the in most years, the mean transactions price per acre is similar to the average quality land value from the survey.
Figure 6: Transaction Prices and Survey Values, 2016 – 2020
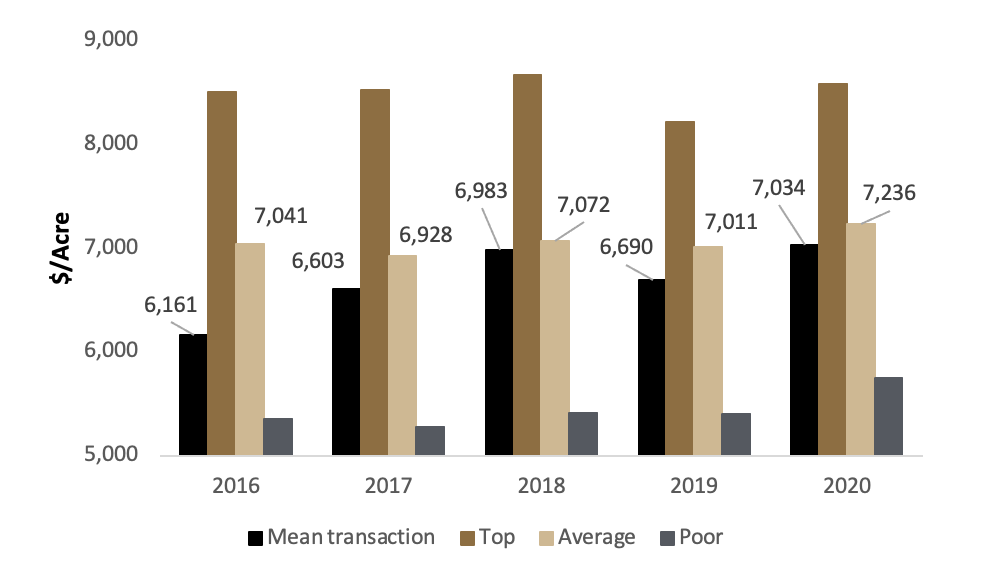
Figure 6: Transaction Prices and Survey Values, 2016 – 2020
Finally, Figure 7 similarly reports the mean per acre transaction price and the land value estimate for each land quality grade across the six regions for 2020. For most regions, the mean transaction price lies within the survey estimates for top and low quality farmland, with the exception of the Central region. The differences between transactions and survey values, however, may diverge for smaller geographic areas because of the limited number of observations or potential “outliers” far above or below the prevailing price.
Figure 7: Transaction Prices and Survey Values by Region, 2020
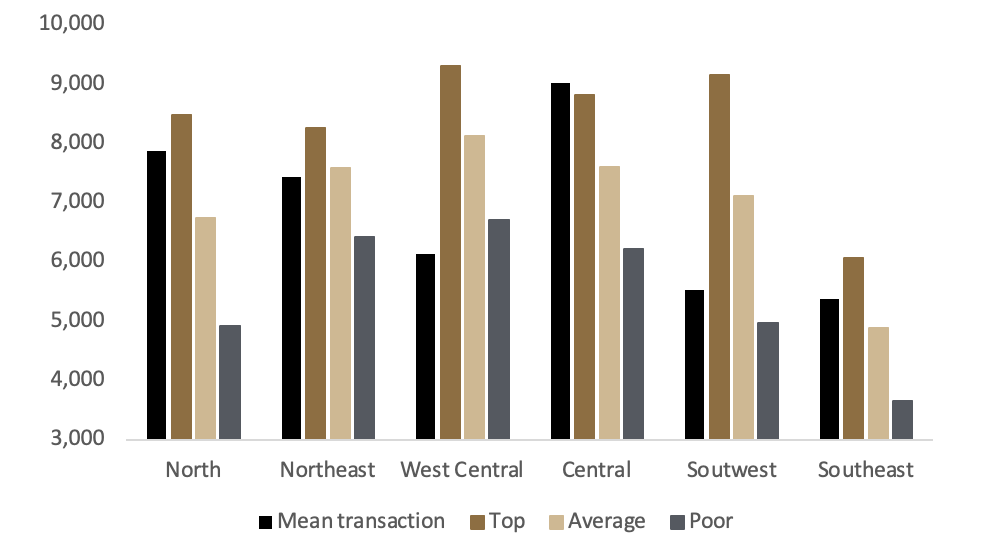
Figure 7: Transaction Prices and Survey Values by Region, 2020
While the estimated turnover rates and transaction volumes diverge between the transaction records and Purdue survey responses, the estimated value of farmland per acre from the two sources is reassuringly similar at the state level. The differences between market transactions and opinion surveys are likely to emerge, however, at the regional level due to limited sample size or “outliers.”
Both the transaction record and opinion survey provide important information on current farmland market conditions, but each information source has relative strengths and weaknesses. Transaction records have the advantage of generating farmland values through “real world” market interactions. In other words, buyers and sellers provide concrete information on the value of a given parcel, which economists call “revealed preferences.” The Purdue Land Values and Cash Rent Survey, on the other hand, collects opinions of market professionals, which economists call “stated preferences.” The two sources can differ as the result of survey respondents’ biases, preferences, or relative information sets or measurement problems with transaction records. Transactions are generated by complex combination of buyers and sellers, and aggregate market trends can be difficult to observe. Or, as economists note, it can be difficult to disentangle the “signal from the noise.” It is difficult to classify land by quality using transaction records alone. In addition, it can be difficult to identify the relative influence of various factors using transaction records, such as economic conditions, aggregate agricultural production and trade, and the influence of policy. For these important forces, the stated preferences of the Purdue Land Values and Cash Rent Survey offer one of the few sources of information.
![]()
![]()
![]()
![]()
![]()