
Soybean Prices Depend on China
December 5, 2018
PAER-2018-21
Author: Chris Hurt, Professor of Agricultural Economics
![]()
![]()
![]()
![]()
![]()
With a record amount of soybeans to sell from the 2018 crop it is a bad year to jeopardize our largest buyer. The U.S. had record soybean yields and record total production in 2018 and also lost the opportunity to sell to China, our largest customer during their peak buying season.
China’s biggest purchases of soybeans from U.S. farmers are in October-November-December. The biggest purchases tend to come in October (our peak harvest month). In the previous two harvest of 2016 and 2017 we sold China about 250 to 300 million bushels each year in October. This year we sold them merely 10 million bushels in October.
The 25% tariff on U.S. soybeans going to China largely made U.S. origin beans uncompetitive in China in the last-half of 2018. These tariffs caused a reshuffling of soybean flows across the globe adding additional transportation costs and creating logistic issues.
What are the impacts of the Chinese soybean tariff on U.S. soy- beans sales so far this marketing year which started in September? Total sales are down 467 million bushels from the same period for the previous marketing year. Soybean sales are currently down 1/3 this marketing year versus last.
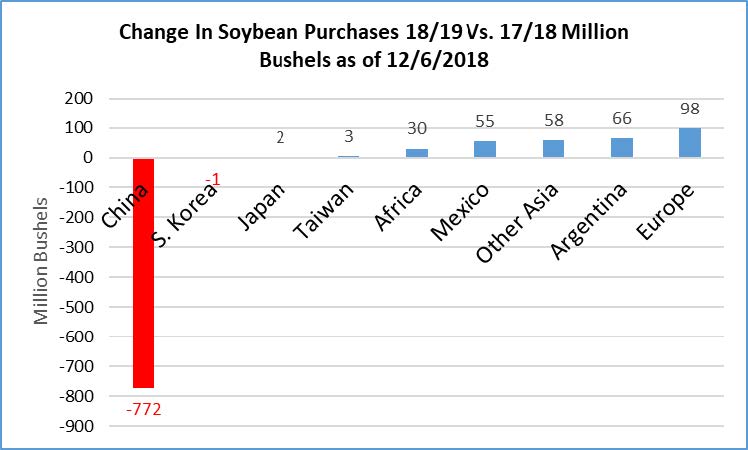
Chinese purchases of U.S. beans this year (through December 6, 2018) are down 98% as they have made good (so far) on their threat to avoid buying U.S. origin. The reduction in Chinese purchases is 772 million fewer bushels, which has not been offset by 305 million bushels of greater purchases by the rest of the world. The chart shows the enormous decrease in Chinese purchases as well as several regions buy- ing more beans including Europe, Argentina, Mexico and Africa. Argentina sold many of their soybeans to China and then purchased cheaper U.S. origin beans for their own crushing plants. U.S. soybean prices at the Gulf of Mexico dropped to as much as $2.50 a bushel under Brazilian port prices at times this past fall. The rest of the world has purchased more U.S. beans largely because U.S. beans were lower priced this past fall than South American sources. Brazil as an example sold their beans to China and this gave an opportunity for the U.S. to sell more beans to Europe, but at low prices.
There is a lot of uncertainty on how many bushels of soybeans the U.S. will export from the 2018 crop. Of course how the trade conflict with China evolves is the primary source of that uncertainty. The U.S. has already missed the prime shipping months for the Chinese market. China still needs some of our 2018 beans but it is unclear how many and when those will be shipped. This could mean it will be our 2019 crop before tariff distortions can work their way through the global markets. If so, it is likely that large inventories of U.S. beans and low prices could extend to the 2019 crop.
There is a bullish possibility however. That would be a negotiated settlement with China in which they agree to buying larger amounts of U.S. Ag goods. China has already said they are willing to increase the amount of U.S. goods they purchase and Ag goods are one of the categories they have listed. In 2017 we sold them about $26 billion of Ag and food products. If a negotiated settlement increased that by $10 billion, that would represent about a 40% in- crease. New purchases of U.S. Ag goods in that magnitude would be bullish for a host of commodities, but soybeans and animal protein would likely be favored.
Soybean exports were moved downward to 1.9 billion bushel for the 2018 crop by USDA analyst. That is a decline of 11% from last year. Keep in mind that no one knows how export numbers will evolve (China). While USDA is using an 11% reduction actual sales so far are down 33% and thus pointing to a much lower export total, at least at this writing.
The contrast between the fundamentals for corn and soybeans could not be more stark. Corn inventories are coming down as usage is greater than production for the second year. On the other hand, soybean inventories are likely to be at burdensome levels (see chart in corn section).
On December 1, the U.S. and China agreed to have a cooling period of 90 days to freeze threats of additional tariffs, open some trading opportunities, and to start to develop a framework to resolve the trade issues. On December 13, 2018 the first announcement of Chinese purchases of 2018 crop U.S. soybeans was made.
The marketing year average price (MYA) for the 2017 crop was $9.33 per bushel. With the potential for burdensome inventories, USDA lowered their 2018 crop estimate to $8.60. It is important to recognize that if inventories are this large, then prices certainly could be lower.
Soybean prices rallied on the prospects of opening some soybean trade with China and on the possibilities of a longer term road map to settle trade disputes. March futures in the $9.20 to $9.40 range have been targets for beans that need to be sold in the short run. Most will want to hold some inventory for the possibility of a favorable negotiated settlement with China and/or for some harmful growing weather in South America in the next few months. These possibilities could result in March 2018 futures testing $10.
Like corn, soybean bids show premiums for delivery into the summer. These are 35 to 50 cents for summer delivery compared to current delivery and depends on location. Foregone interest costs to store until early summer might be 15 to 18 cents. So, those with on- farm storage can generate favorable returns from selling for early summer if premiums are 35 to 50 cents.
Unlike most years, early summer premiums may be high enough to cover foregone interest costs and commercial storage charges. This is unusual but encourages those with beans in commercial storage to examine their potential added revenues and added costs of selling for early summer delivery.
New crop pricing might be considered if November 2019 futures reach or exceed $10.
Like corn, Indiana returns for 2018 soybeans will be much higher (on average) than from the 2017 crop. Record yields at 60 bushels per acre were 6 bushels higher than 2017. While prices are expected to be down 73 cents (U.S. $9.33 dropping to $8.60), the market facilitation payment for trade assistance on the first-half of production was the equivalent of $.825 on each bushel produced. So prices from the market plus trade assistance were $9.425. This is higher than the $9.33 price for 2017. Indiana soy- bean estimated revenues from the 2018 crop are up $59 per acre from the 2017 crop and if $8 per acre is taken off to account for higher costs, then returns are about $50 per acre higher. On 5.9 million harvested acres, this is around $300 million more estimated income than the 2017 soybean crop.
On December 17, 2018, USDA announced trade assistance for the second-half of production. Additional soybean payments of $.825 per bushel will result in nearly $50 per Indiana acre on average. This adds another $300 million of income to the 2018 Indiana soybean crop.
![]()
![]()
![]()
![]()
![]()
