


May 1, 2020
Cover Crops and Farm Profitability in Central Indiana
by: Megan Hughes and Michael Langemeier
![]()
![]()
![]()
![]()
![]()
The addition of cover crops to a farm’s agricultural system can have significant impacts on the bottom line of the business. Despite strong agronomic evidence of the positive impact cover crops have on soil health, farmers are often hesitant to adopt cover crops. This article examines the effect that established cover crop management can have on net return per acre.
A variable nitrogen rate study conducted by a Central Indiana case farm was utilized in this article. The variable nitrogen rate study was conducted in 2011, 2013, 2015, and 2017, and examined the relationship between applied nitrogen fertilizer and corn yields across four cover crop treatments: no cover, annual rye, cereal rye, and an oats/radish blend. The study allowed for comparisons to be made in terms of the production-maximizing and profit-maximizing nitrogen and crop yields across cover crop treatments, and the creation of partial budgets that can be used to determine whether the benefits from cover crops (e.g., lower nitrogen levels and higher crop yields) are larger than the costs associated with cover crops (e.g., seed and planting costs).
The production-maximizing yield represents the highest possible yield. The profit-maximizing yield represents the yield at which a farm makes the highest profit. In general, due to the fact that inputs are not free, the profit-maximizing yield is lower than the production-maximizing yield. As input prices increase, the difference between the profit-maximizing and production-maximizing yields increase. Also, the shape of the production function directly impacts the difference between these two levels. Figure 1 shows the relationship between applied nitrogen and corn yield for the case farm. A separate production function was estimated for each cover crop treatment. All four years of the study were used to develop the production functions in figure 1. Each of the production functions demonstrate the diminishing marginal effect of nitrogen on corn yield. Production-maximizing and profit-maximizing nitrogen levels and corn yields are discussed below.

Figure 1. Relationship between Corn Yield and Nitrogen for a Central Indiana Case Farm
Table 1 shows the production and profit maximizing yields and the associated applied nitrogen levels. Note the large difference in applied nitrogen levels and the small difference in crop yields between the production-maximizing and profit-maximizing levels. These differences are the direct result of the flattening of the production functions for each cover crop treatment at applied nitrogen levels above approximately 120 pounds per acre. The annual rye and oats/radish treatments increase the need for applied nitrogen compared to the no cover control, but also increase the expected corn yield. The cereal rye treatment decreases the applied nitrogen while increasing the expected corn yield.
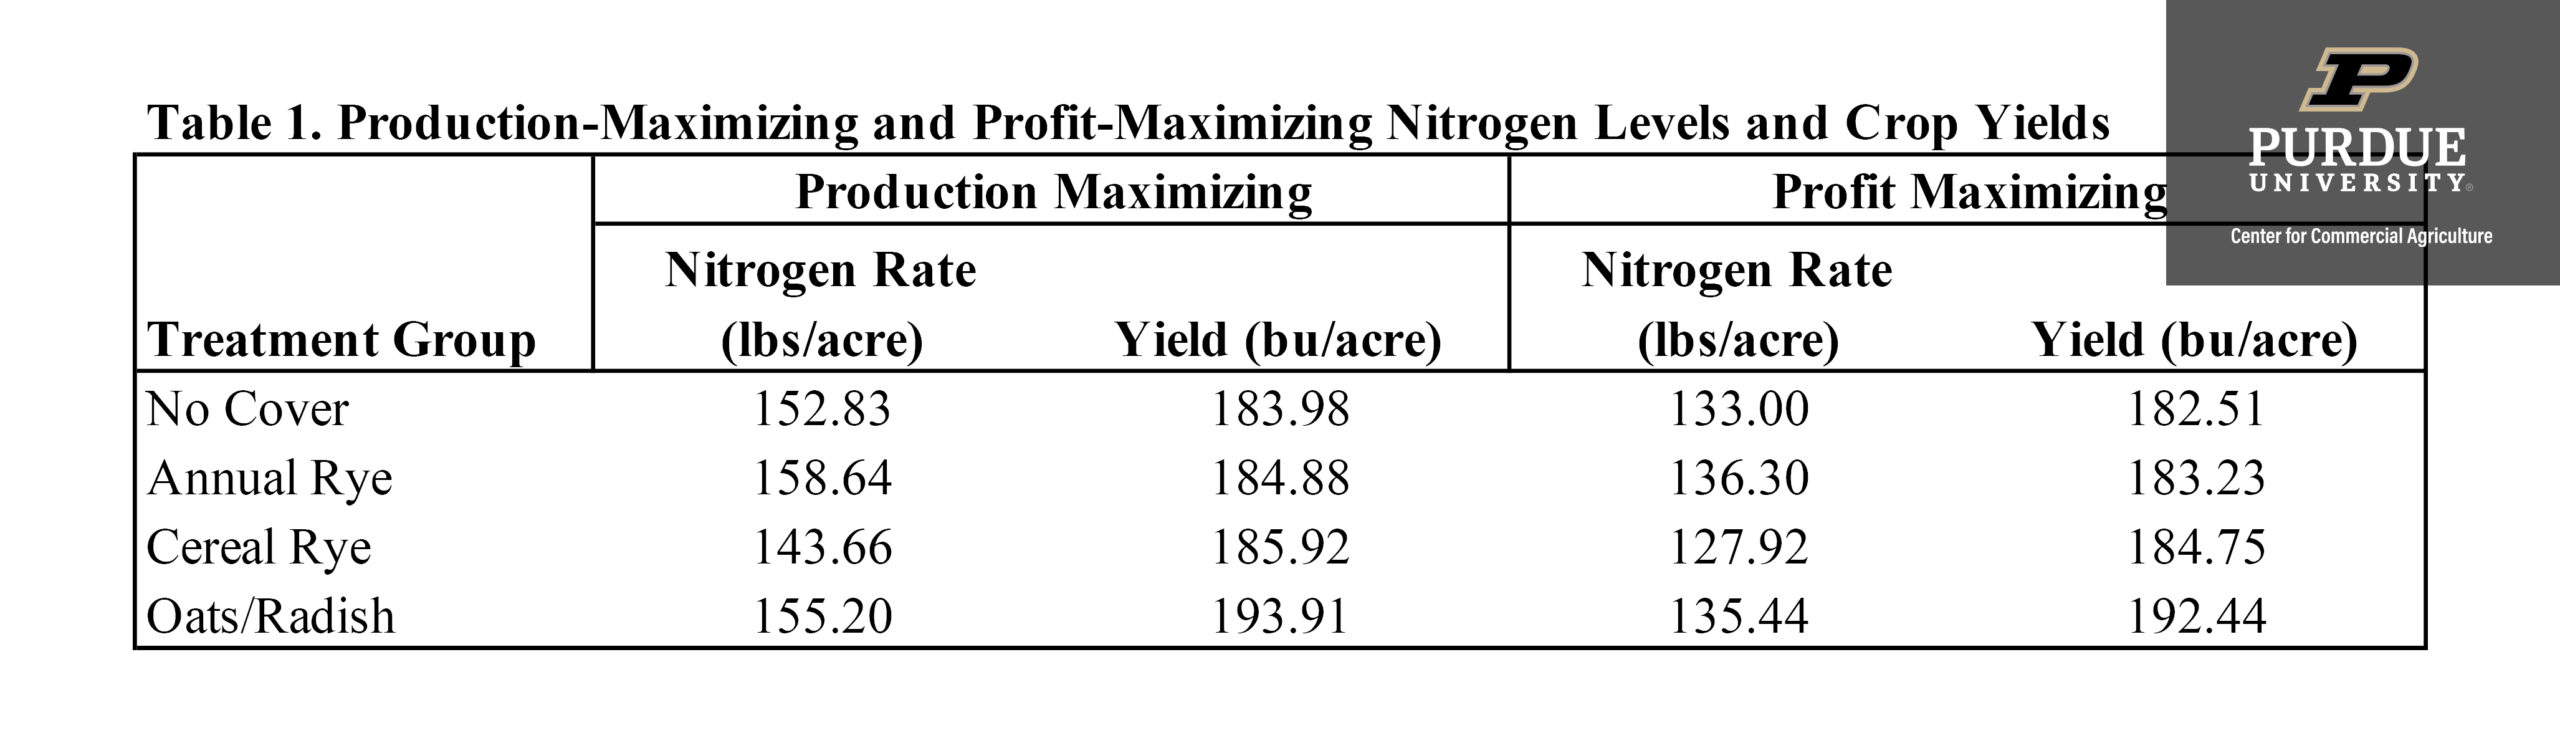
Table 1. Production-Maximizing and Profit-Maximizing Nitrogen Levels and Crop Yields
Differences in profit-maximizing nitrogen levels and crop yields in table 1 have important net return implications. For example, table 2 demonstrates the change in net returns when average corn and nitrogen prices for the study years are used. The partial budget in table 2 accounts for any line items in the farm budget that will be impacted by implementing cover crops. The numbers reported in the table are the changes from no cover crop use. For example, the cost associated with cover crop seeds when you don’t use cover crops is $0. Using an annual rye cover crop will increase the cover crop seed cost by $15.90. A negative change in costs indicates a decrease to costs.
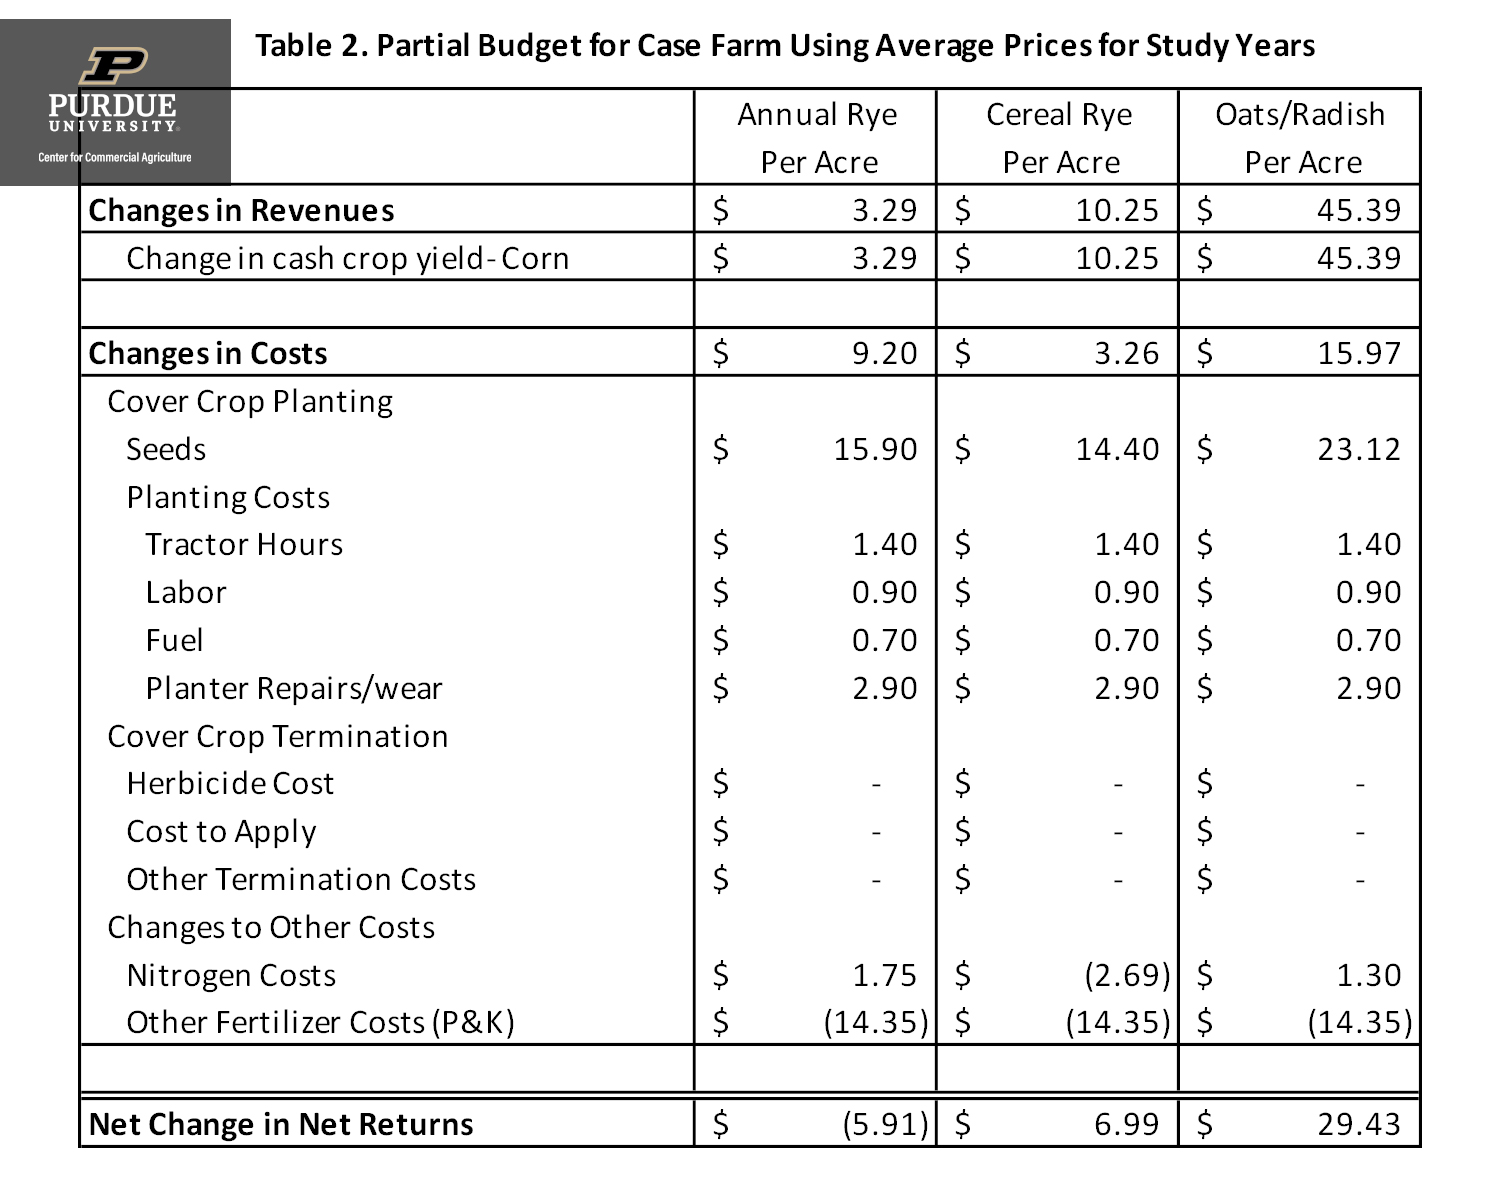
Table 2. Partial Budget for Case Farm Using Average Prices for Study Years
Table 3 shows the results of repeating the process depicted in table 2 using corn and nitrogen prices from each year that the study was run: 2011, 2013, 2015, and 2017. We see that the annual rye treatment caused a decrease to net return per acre in all years, while cereal rye and the oats/radish treatments caused an increase to net return per acre. The results with respect to 2017 are particularly pertinent. Even with relatively low corn prices, the benefits associated with a cereal rye cover or an oats/radish combination outweighed the costs of the cover crops.
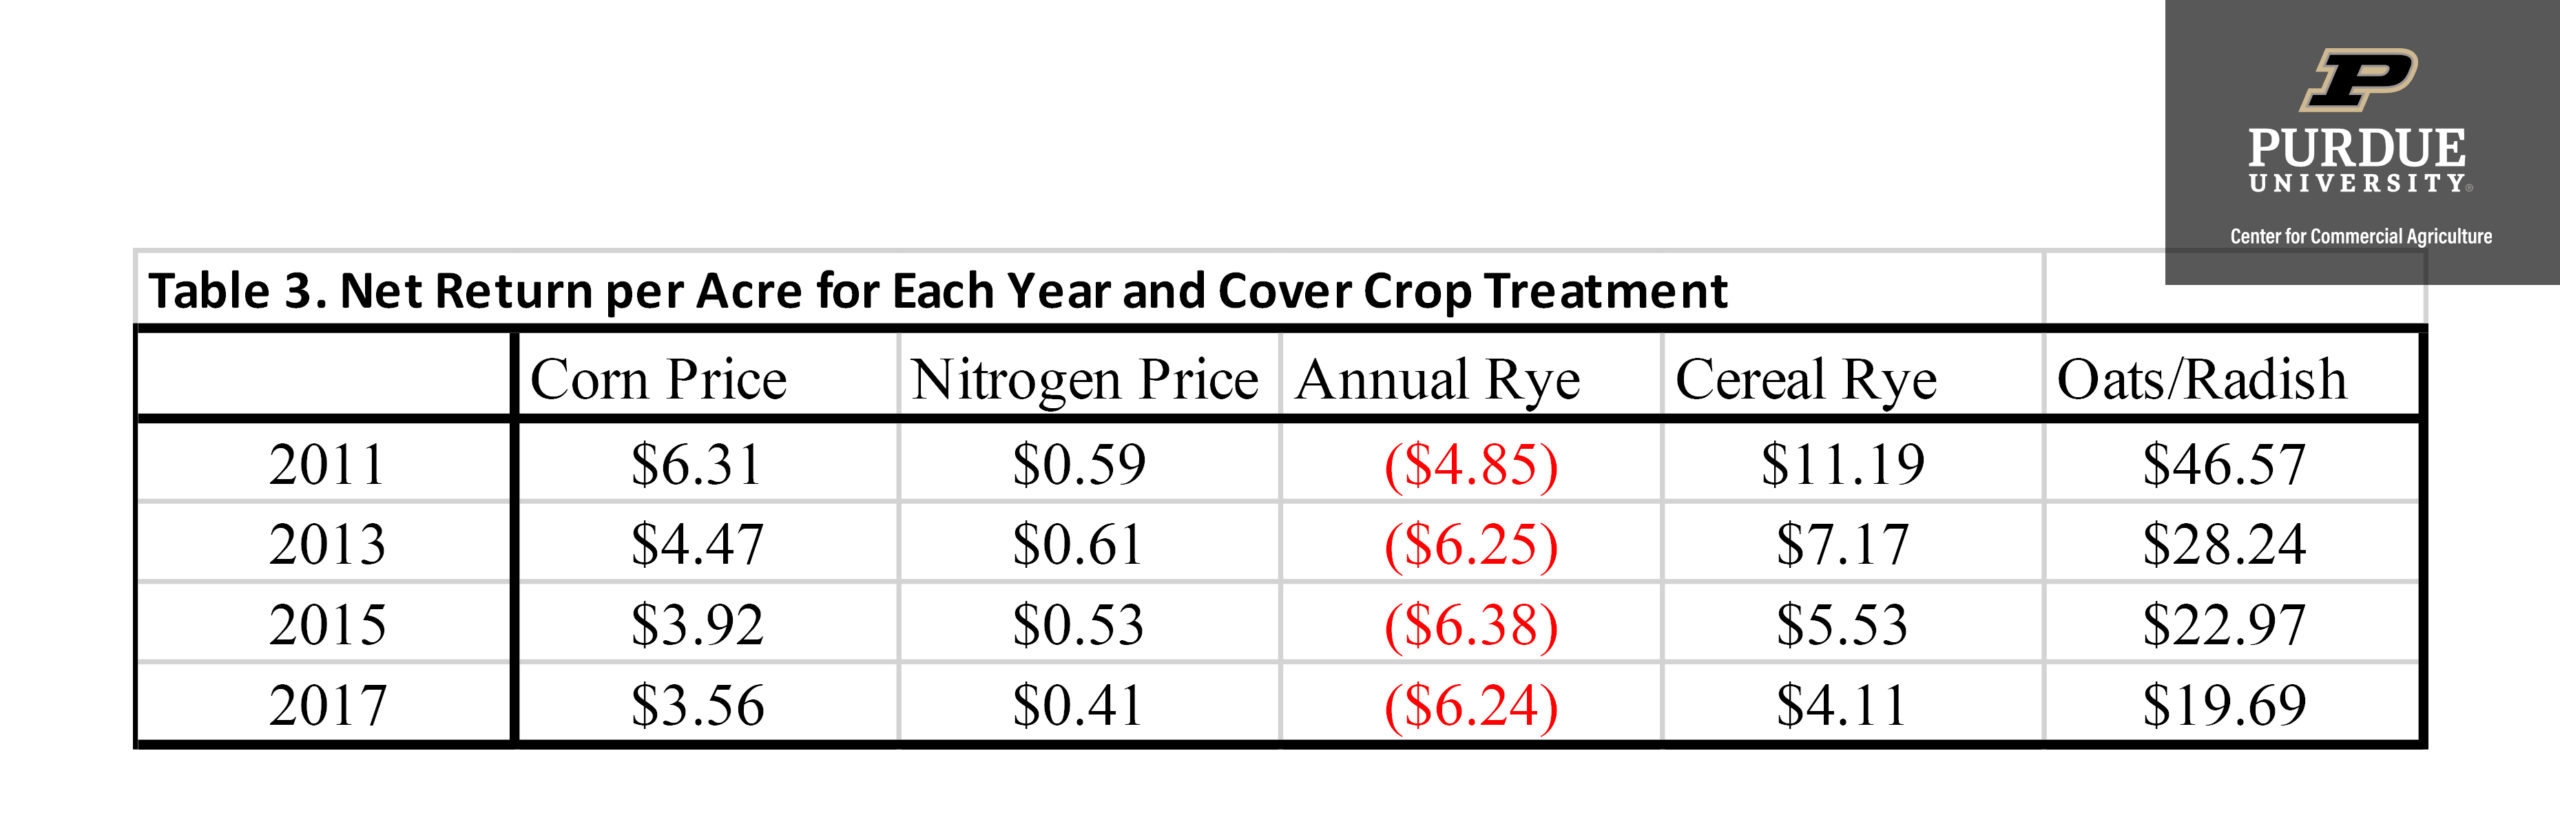
Table 3. Net Return per Acre for Each Year and Cover Crop Treatment
Stochastic simulation of historical corn and nitrogen prices were used to generate simulations of 1000 possible price combinations. Table 4 shows the average to net return per acre that resulted when the 1000 iterations are sorted by corn price. This helps to capture the price risk associated with each cover crop treatment. Again, the results show that with relatively low corn prices, a cereal rye cover or an oats/radish blend can provide benefits that outweigh their costs.
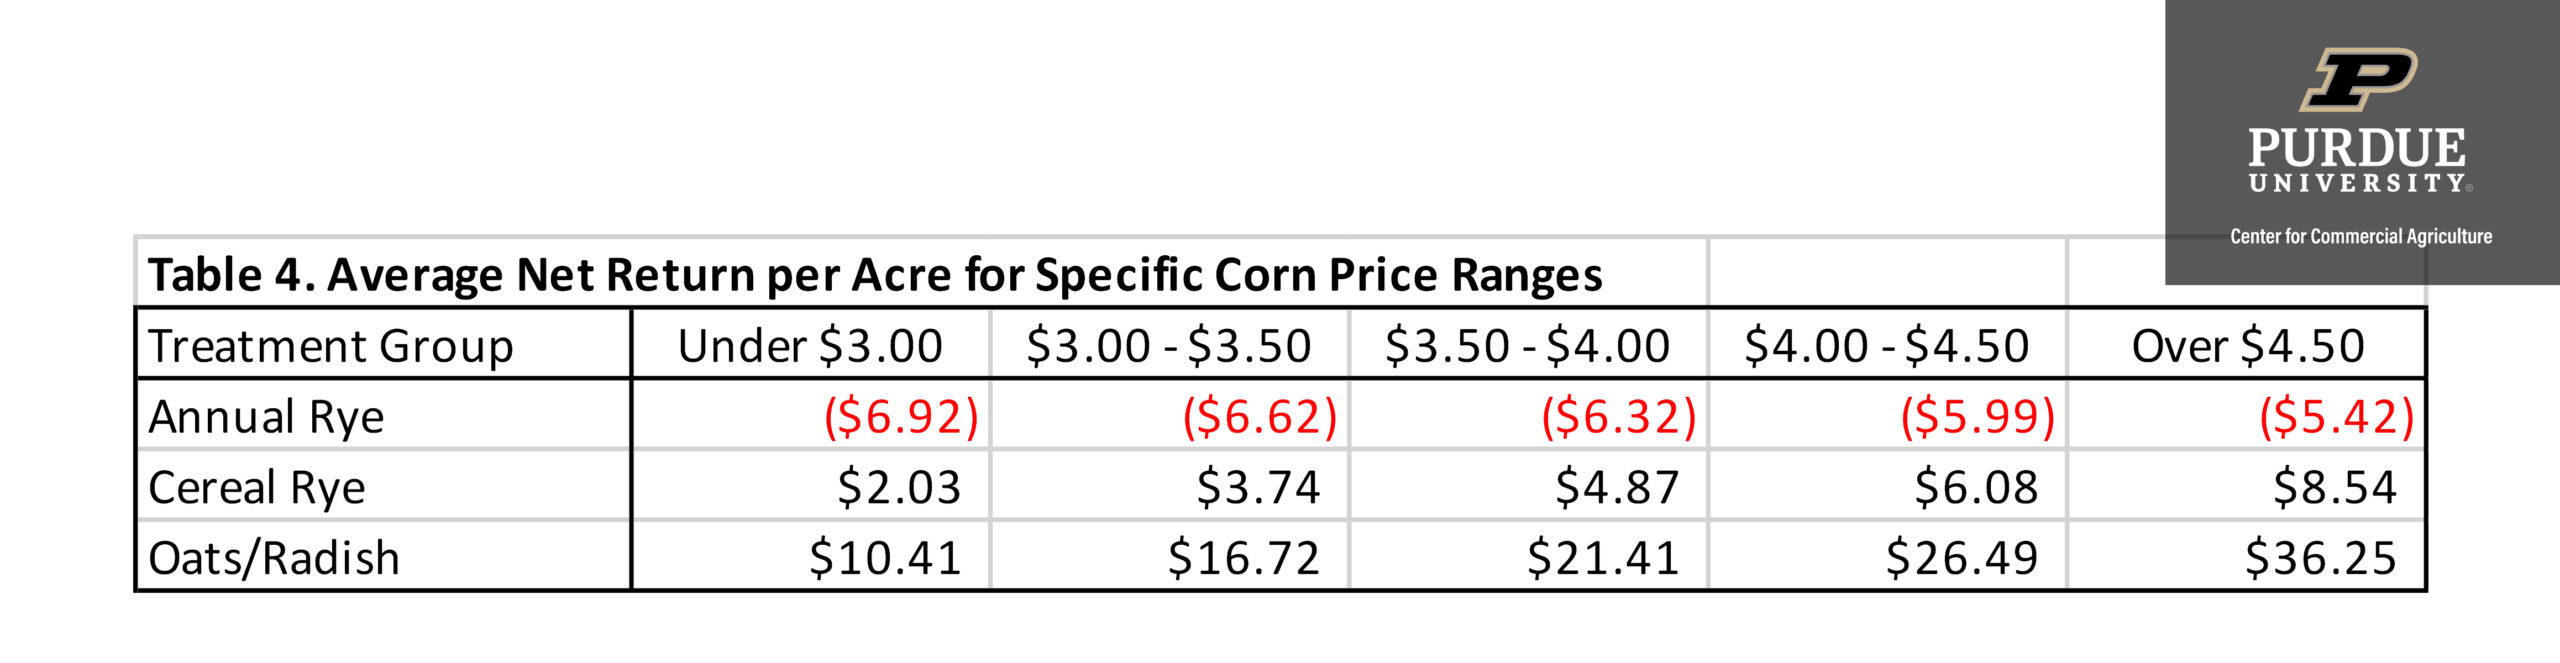
Table 4. Average Net Return per Acre for Specific Corn Price Ranges
Results in this study are influenced by the case farm’s management system. A combination of no-till and cover crops has been in place for at least 15 years. This experiment was also run on a field with a corn-soybean rotation. To terminate the cover crops, this farm utilizes their typical spring burn down routine, and so no additional cost is incurred for cover crop termination.
In summary, adding cover crops to an agricultural system can increase the profit-maximizing yield for the system and/or decrease optimal applied nitrogen levels. Depending on the cover crop treatment used, cover crop treatments were shown to increase net return per acre for a case farm.
** Find our Cover Crop Decision Making Tool to examine whether it is beneficial to use a cover crop.
![]()
![]()
![]()
![]()
![]()
TAGS:
TEAM LINKS:


RELATED RESOURCES
UPCOMING EVENTS
We are taking a short break, but please plan to join us at one of our future programs that is a little farther in the future.