Category: Assist

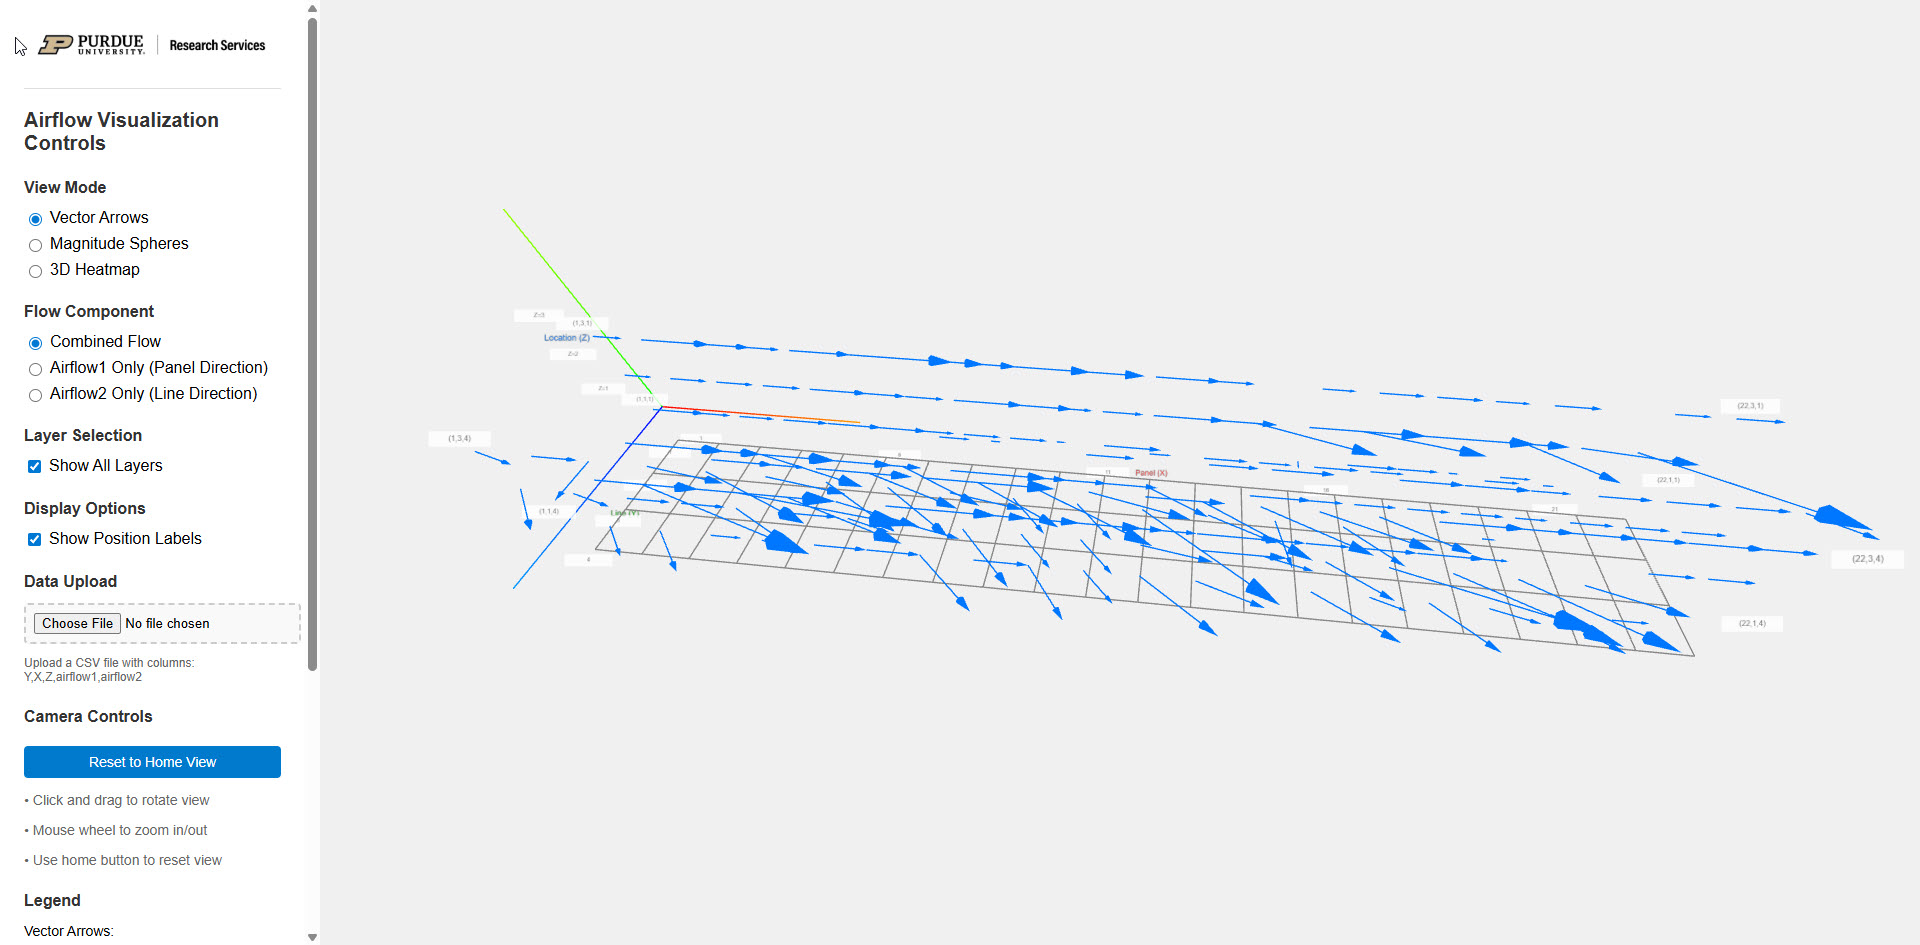
Identifying Causes: Airflow Visualization

The Purdue Student Farm faced challenges with inadequate plant transpiration within their year-round controlled environment growing containers. While the farm team had collected airflow data through their own measurements, they needed a clearer way to interpret these findings. To address...
Read More
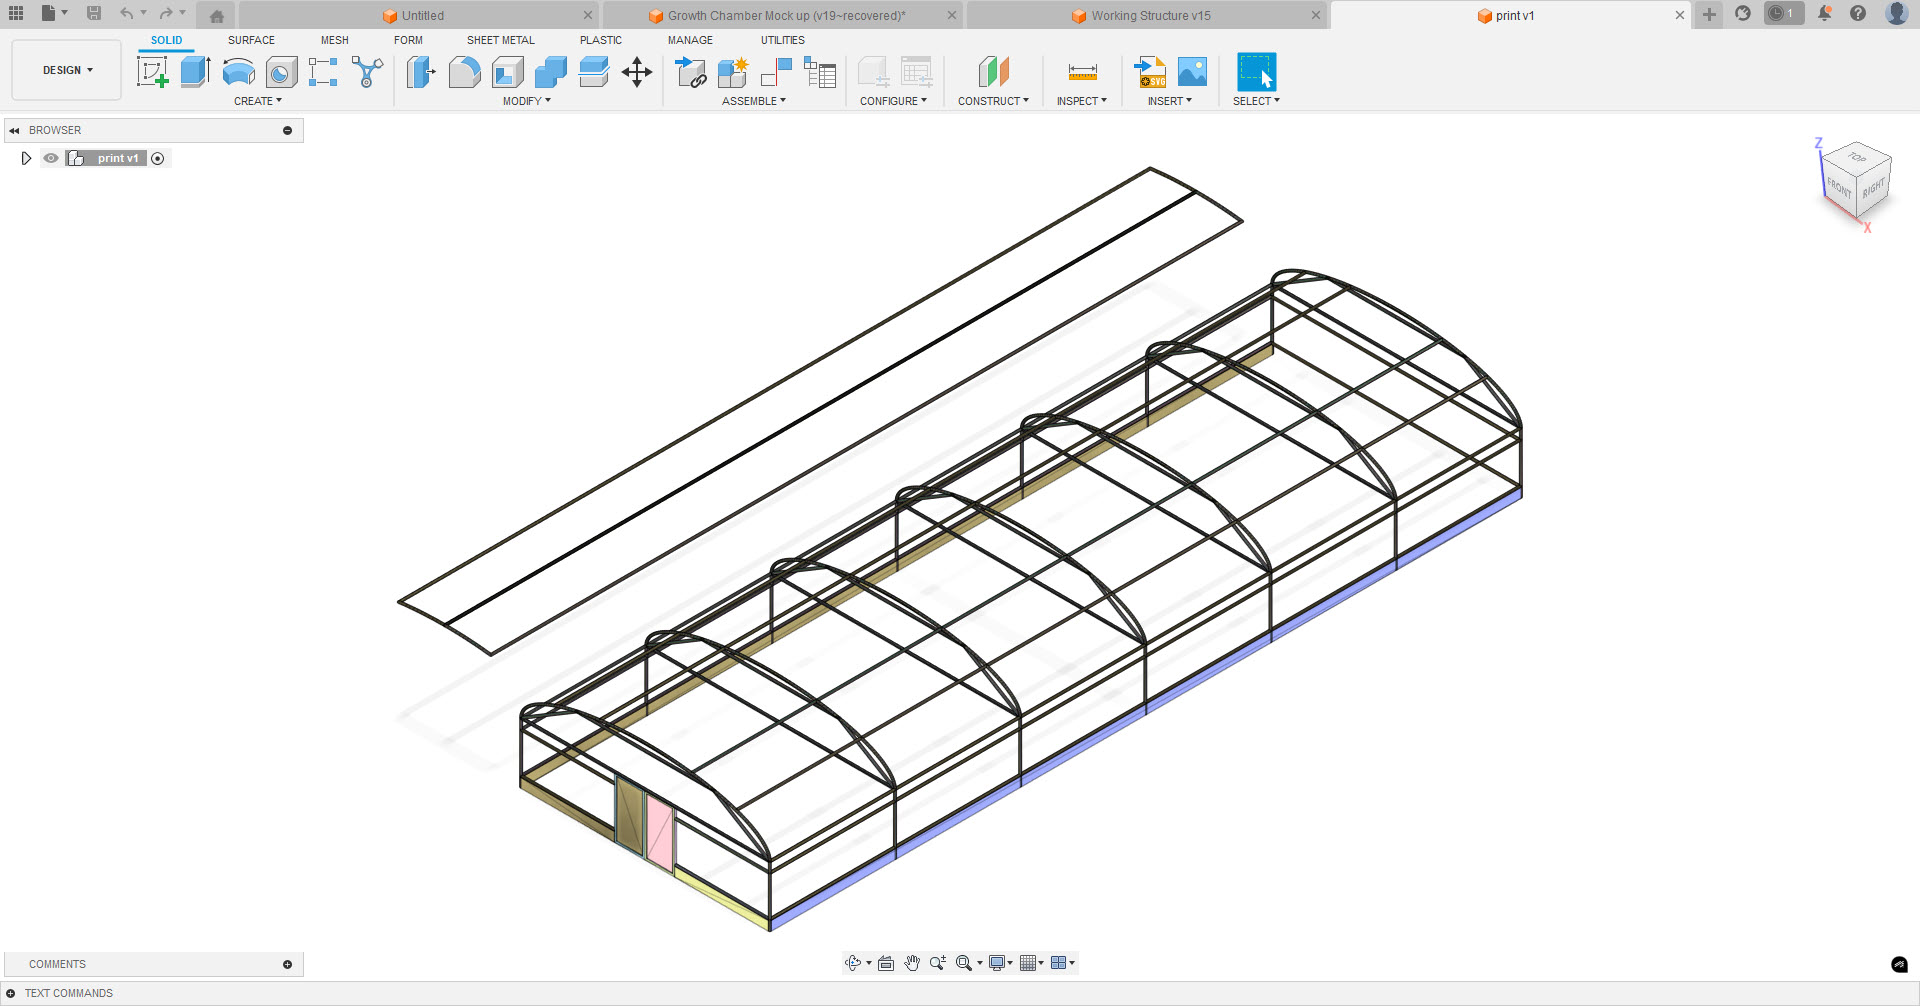
From Sketch to Object – 3D Modeling and Printing Model Greenhouse Designs

Dr. Krishna Nemali's visiting scholar, Ayyaz Ahmed, proposed testing an innovative hoop design for their research. Research Services collaborated with Ahmed to transform his initial concept sketch into a precise 3D model. The team then optimized the design for additive...
Read More
GewGaw visualization

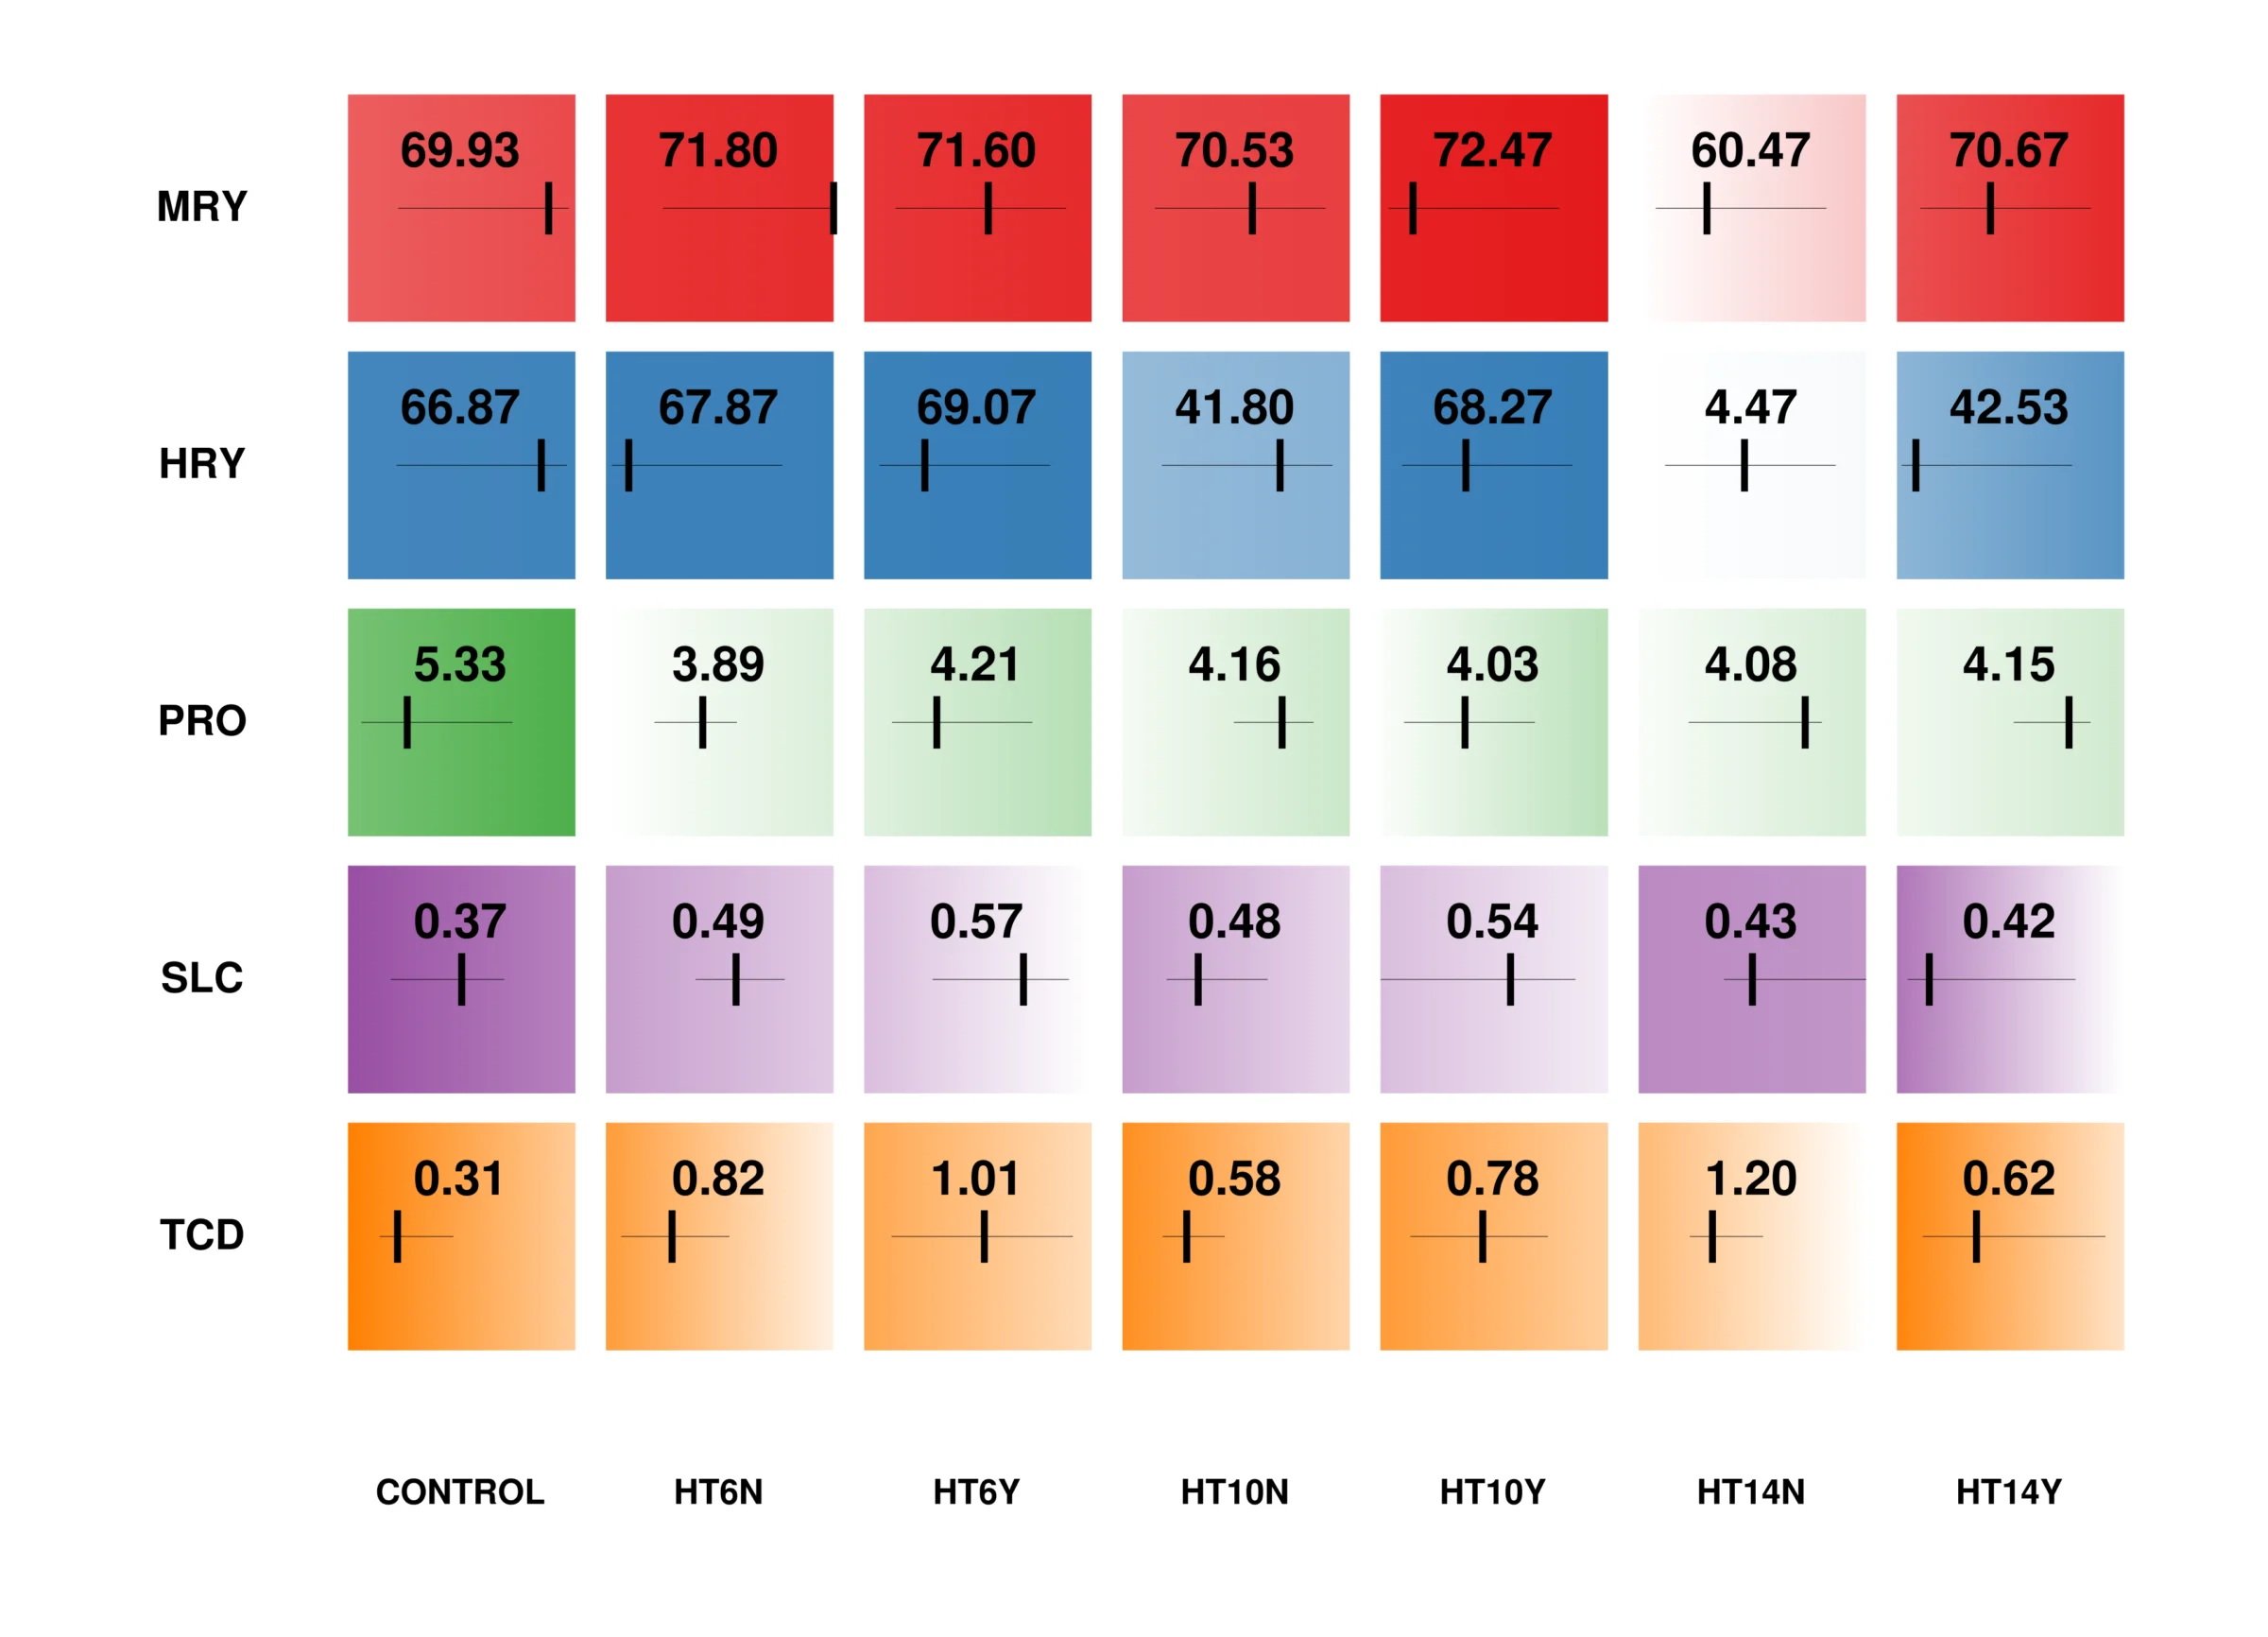
Novel visualization of rice drying methods

Purdue’s ARGE Research Services helped transform complex rice-drying research into a journal-ready visual format by developing the innovative “Gewgaw Grid” data visualization method.

Read More

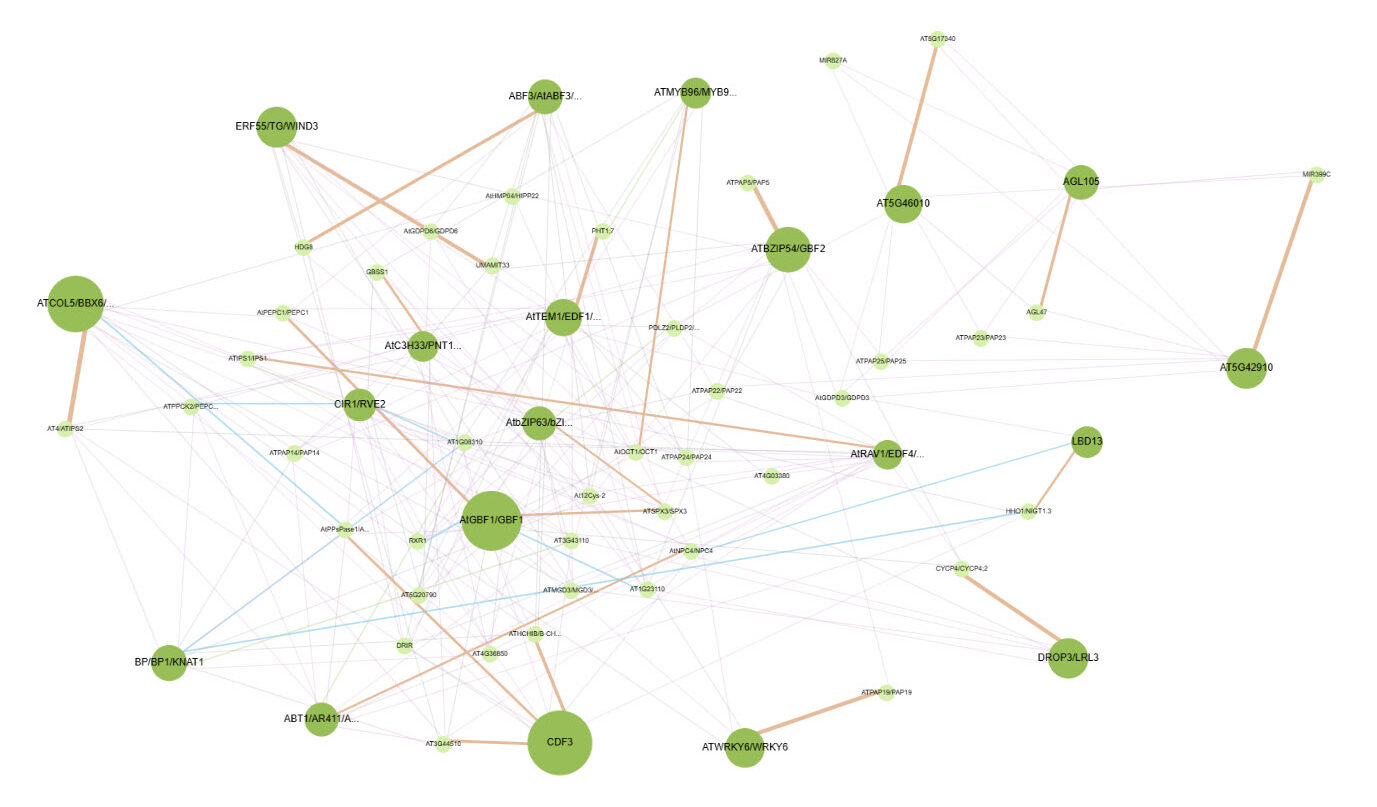
Interactive cytoscape visualization

Dr. Kranthi Varala needed a web-accessible tool to extract data and visualize the regulatory network for WHO. The total amount of data was over 100 million data elements. Our team utilized shared university resources to provide a no-cost solution for...
Read More

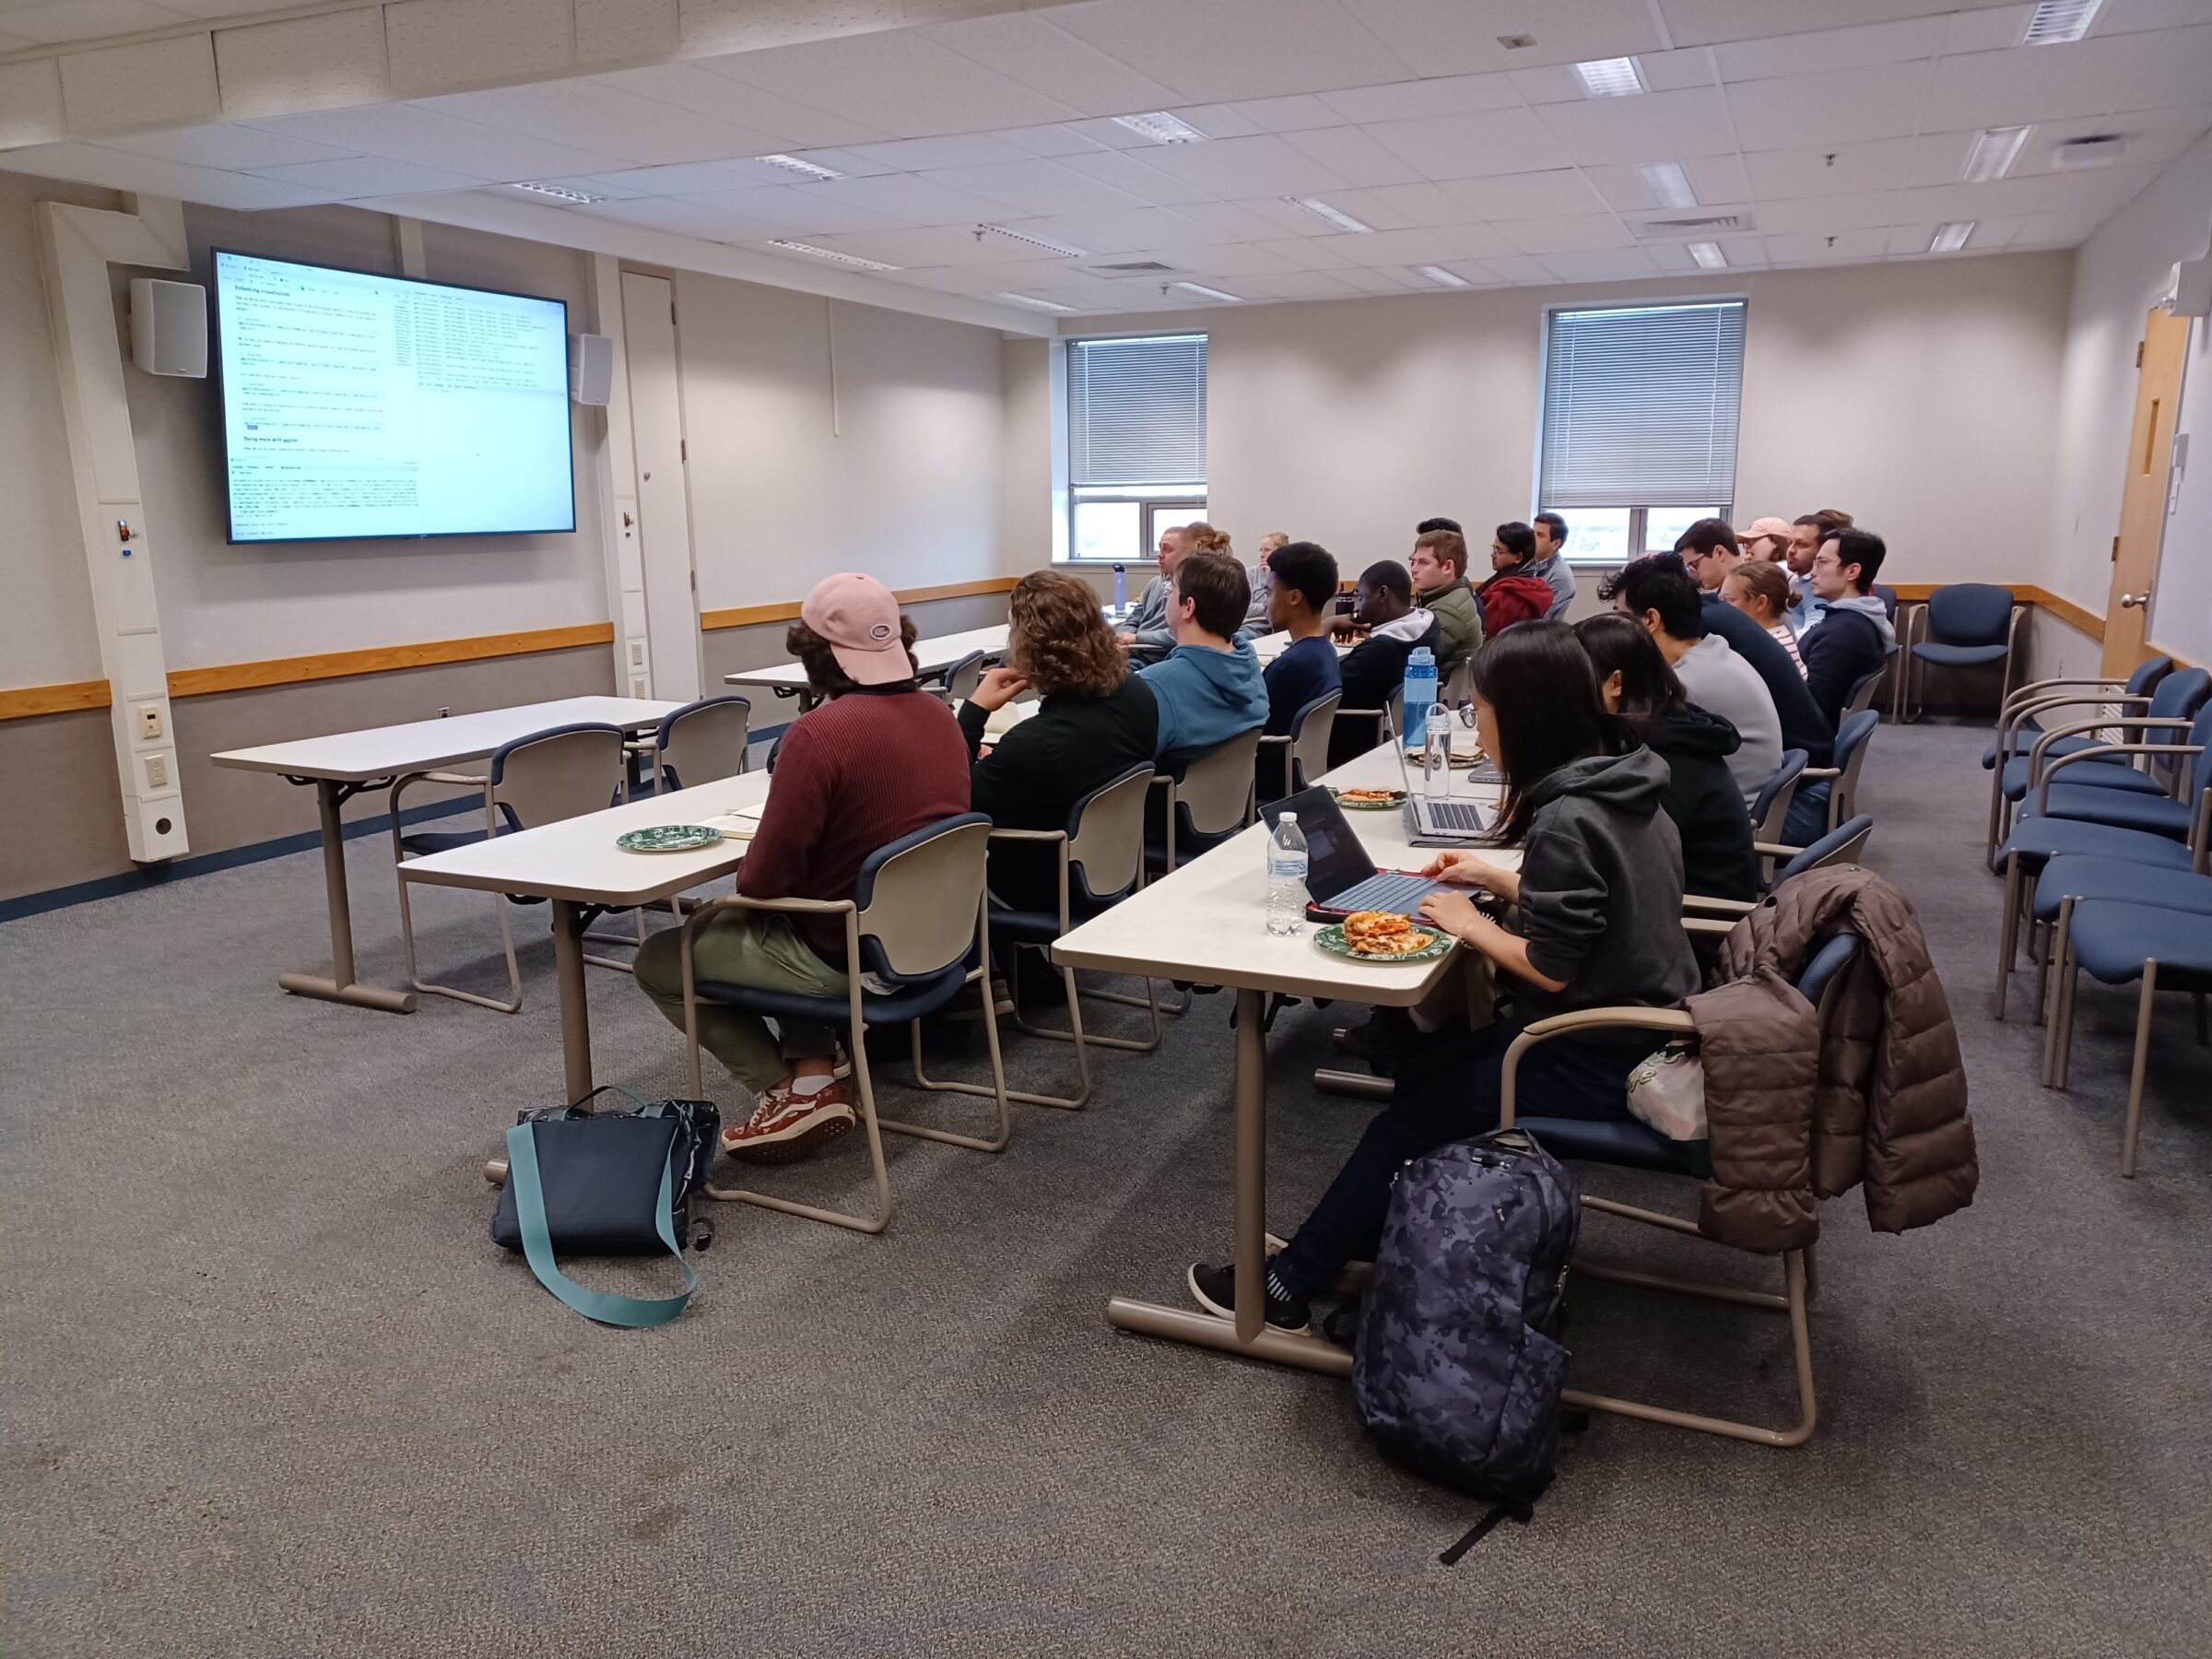
Tailored Workshops

Our team successfully created and delivered tailored workshops for graduate students and labs across the college. These workshops were designed to meet specific research needs, providing hands-on training in data analytics and visualization techniques. By addressing the unique requirements of...
Read More