Tag: Visualization

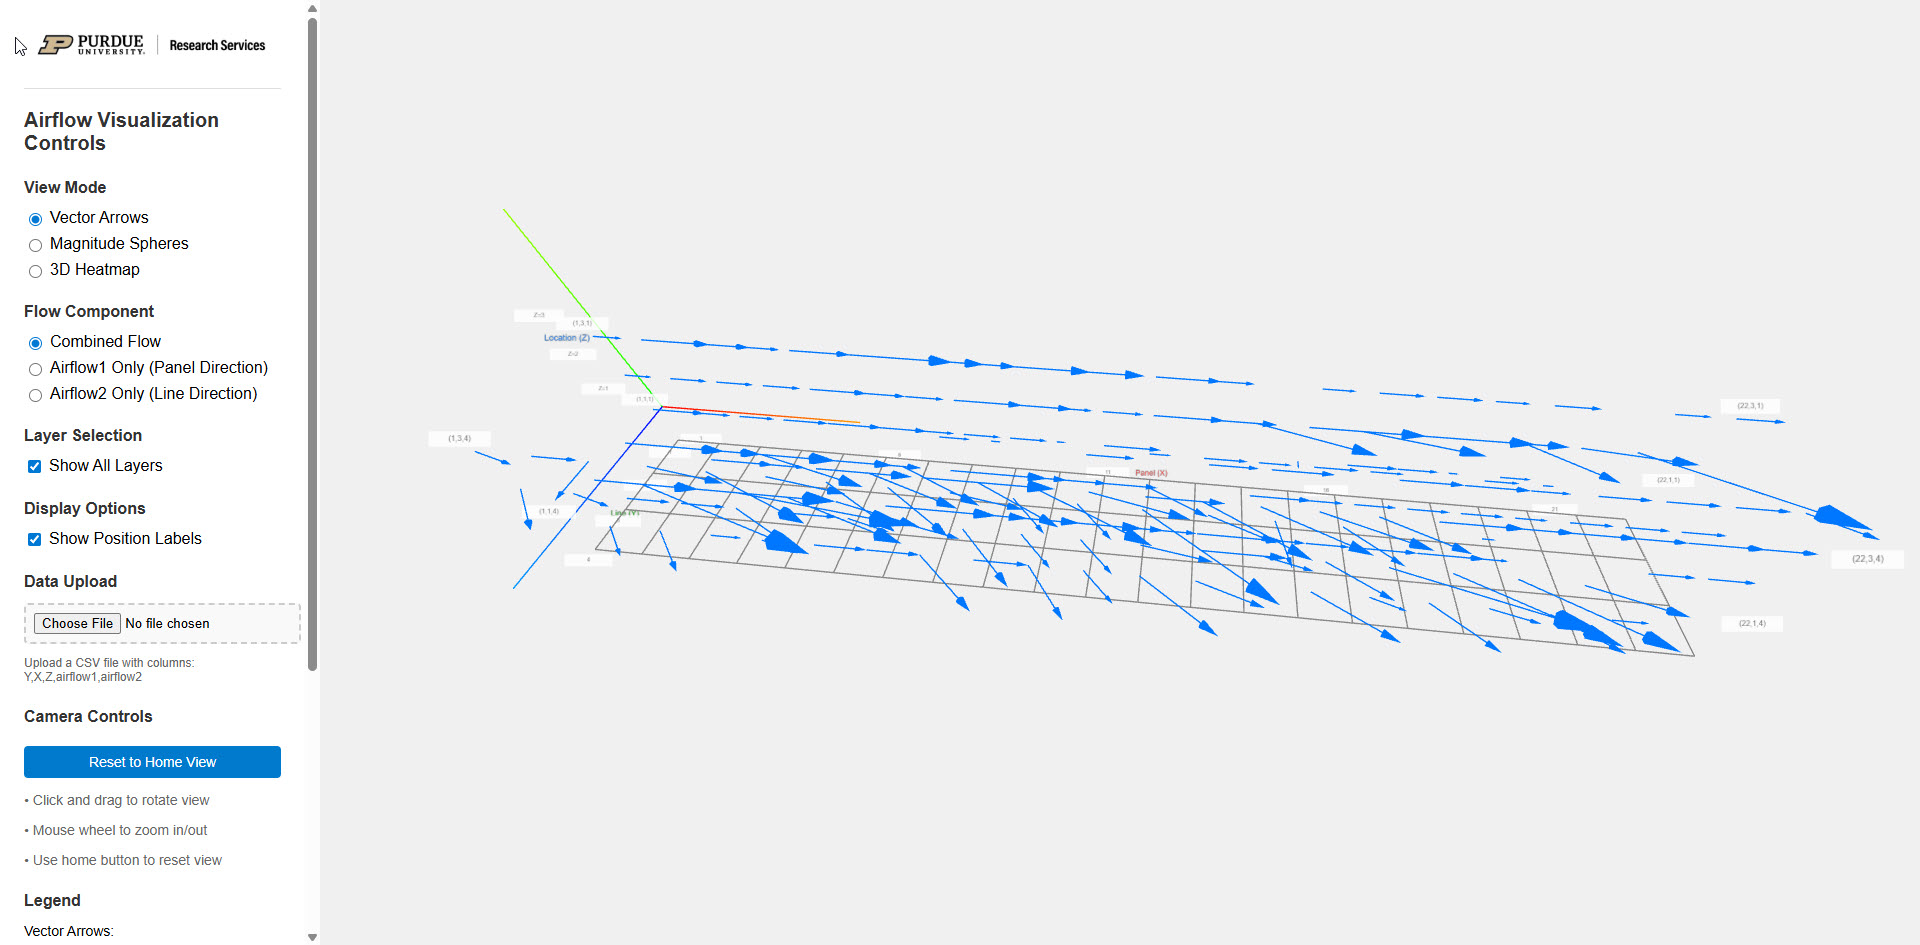
Identifying Causes: Airflow Visualization

The Purdue Student Farm faced challenges with inadequate plant transpiration within their year-round controlled environment growing containers. While the farm team had collected airflow data through their own measurements, they needed a clearer way to interpret these findings. To address...
Read More
GewGaw visualization

Novel visualization of rice drying methods

Purdue’s ARGE Research Services helped transform complex rice-drying research into a journal-ready visual format by developing the innovative “Gewgaw Grid” data visualization method.

Read More

Interactive cytoscape visualization

Dr. Kranthi Varala needed a web-accessible tool to extract data and visualize the regulatory network for WHO. The total amount of data was over 100 million data elements. Our team utilized shared university resources to provide a no-cost solution for...
Read More

Long-term impacts of tile drainage on crop yield

To improve crop yield in poorly drained soil types common in the US Midwest, farmers commonly installed subsurface drainage systems to help remove excess water. Despite being a common practice, we have limited understanding about how different spacings of drain...
Read More

Dr. Shalamar Armstrong – S.E.N.D. Lab

Dr. Shalamar Armstrong's Soil Ecosystem and Nutrient Dynamics (SEND) Lab, in Purdue Agronomy, studies how cover crops protect farmland — the nutrients in the soil, the water that runs off it, and the yields that follow. The harder problem was...
Read More