Rents for Indiana Pasture Land, Irrigated Land, Hay Ground, and On-Farm Grain Storage in 2017

April 15, 2018

PAER-2018-01

Authors: Craig L. Dobbins, Professor of Agricultural Economics and Kim Cook, Research Associate

Estimates for the current rental value of pasture land, irrigated land, hay ground, and on-farm grain storage in Indiana are often difficult to locate. For the past several years, questions about these items have been included in the Purdue Farmland Value Survey. The values from the June 2017 survey are reported here. Because the number of responses for some items is small, the number of responses is reported.

Averages for pasture rent, irrigated land, hay ground, and the rental of on-farm grain storage are presented in Tables 1, 2, 3, and 4, respectively. The rental rate for grain bins includes the situation where there is just a bin and the situation where there is a bin and utilities.
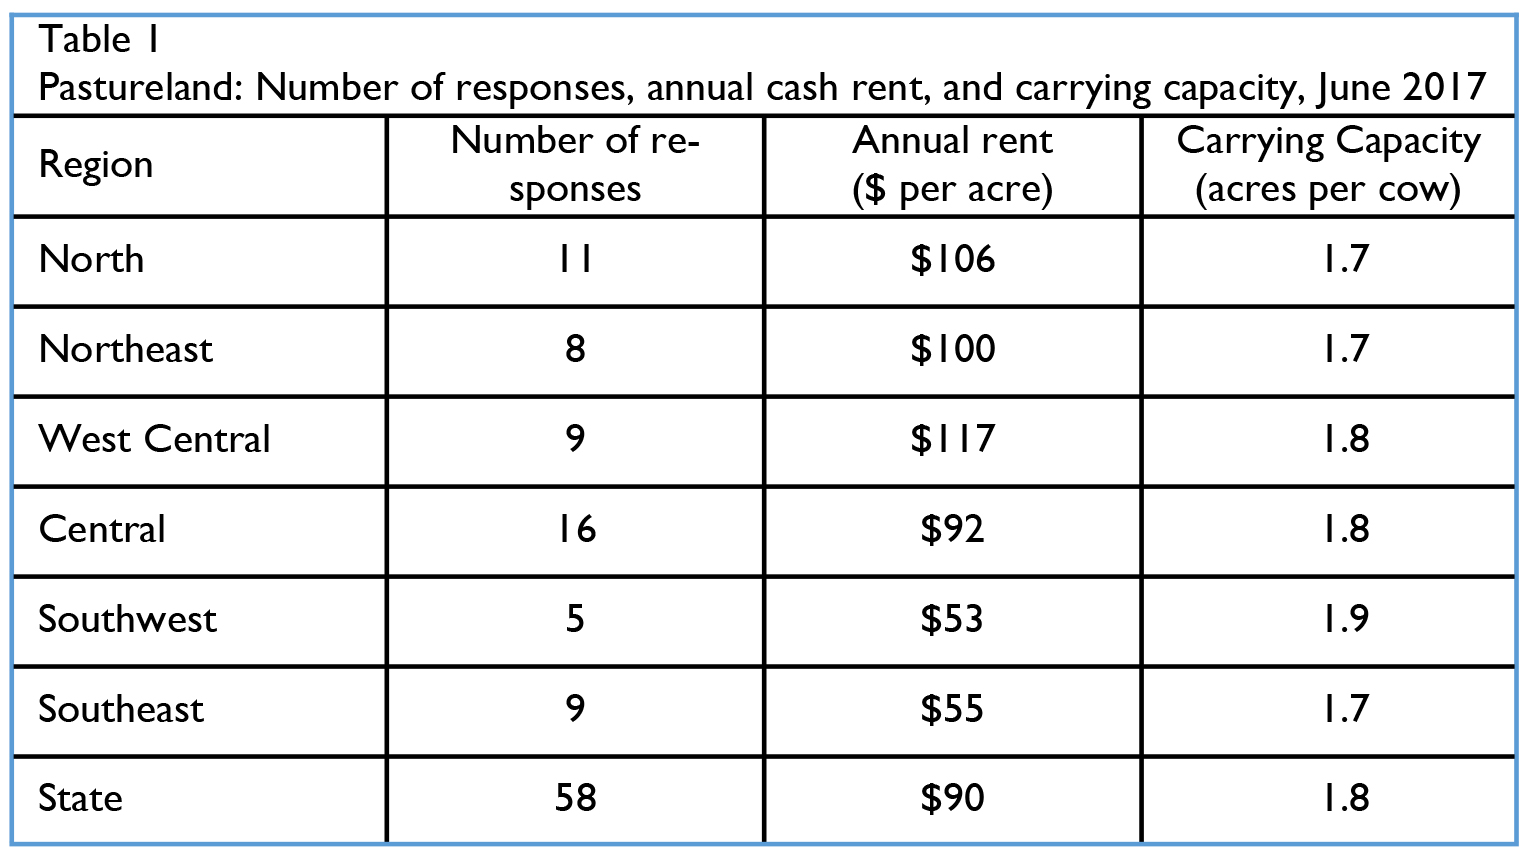
Table 1 Pastureland: Number of responses, annual cash rent, and carrying capacity, June 2017
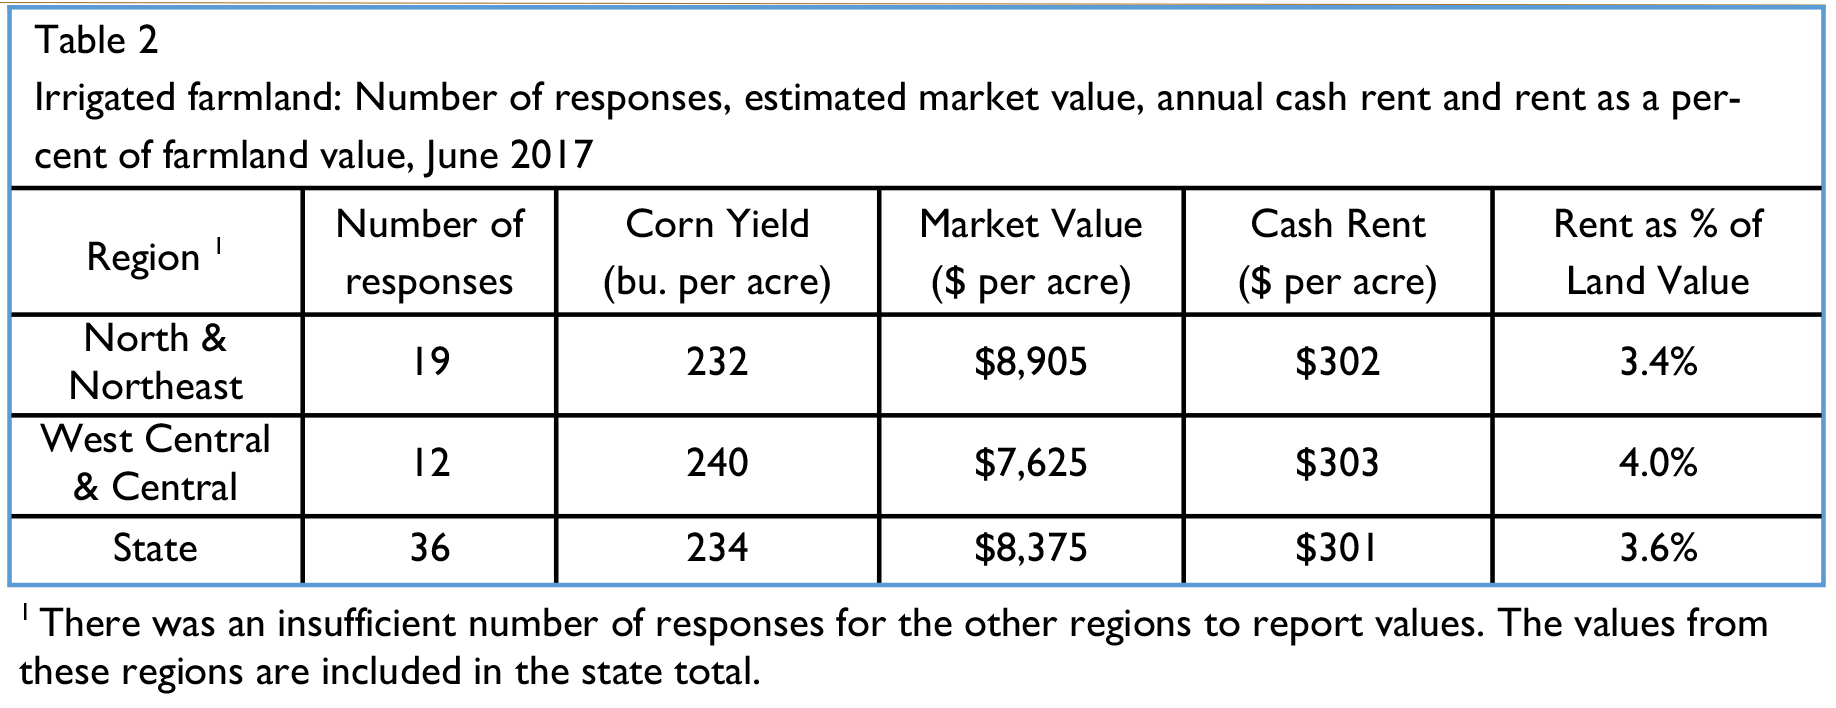
Table 1
Pastureland: Number of responses, annual cash rent, and carrying capacity, June 2017

Table 2 Irrigated farmland: Number of responses, estimated market value, annual cash rent and rent as a per-cent of farmland value, June 2017
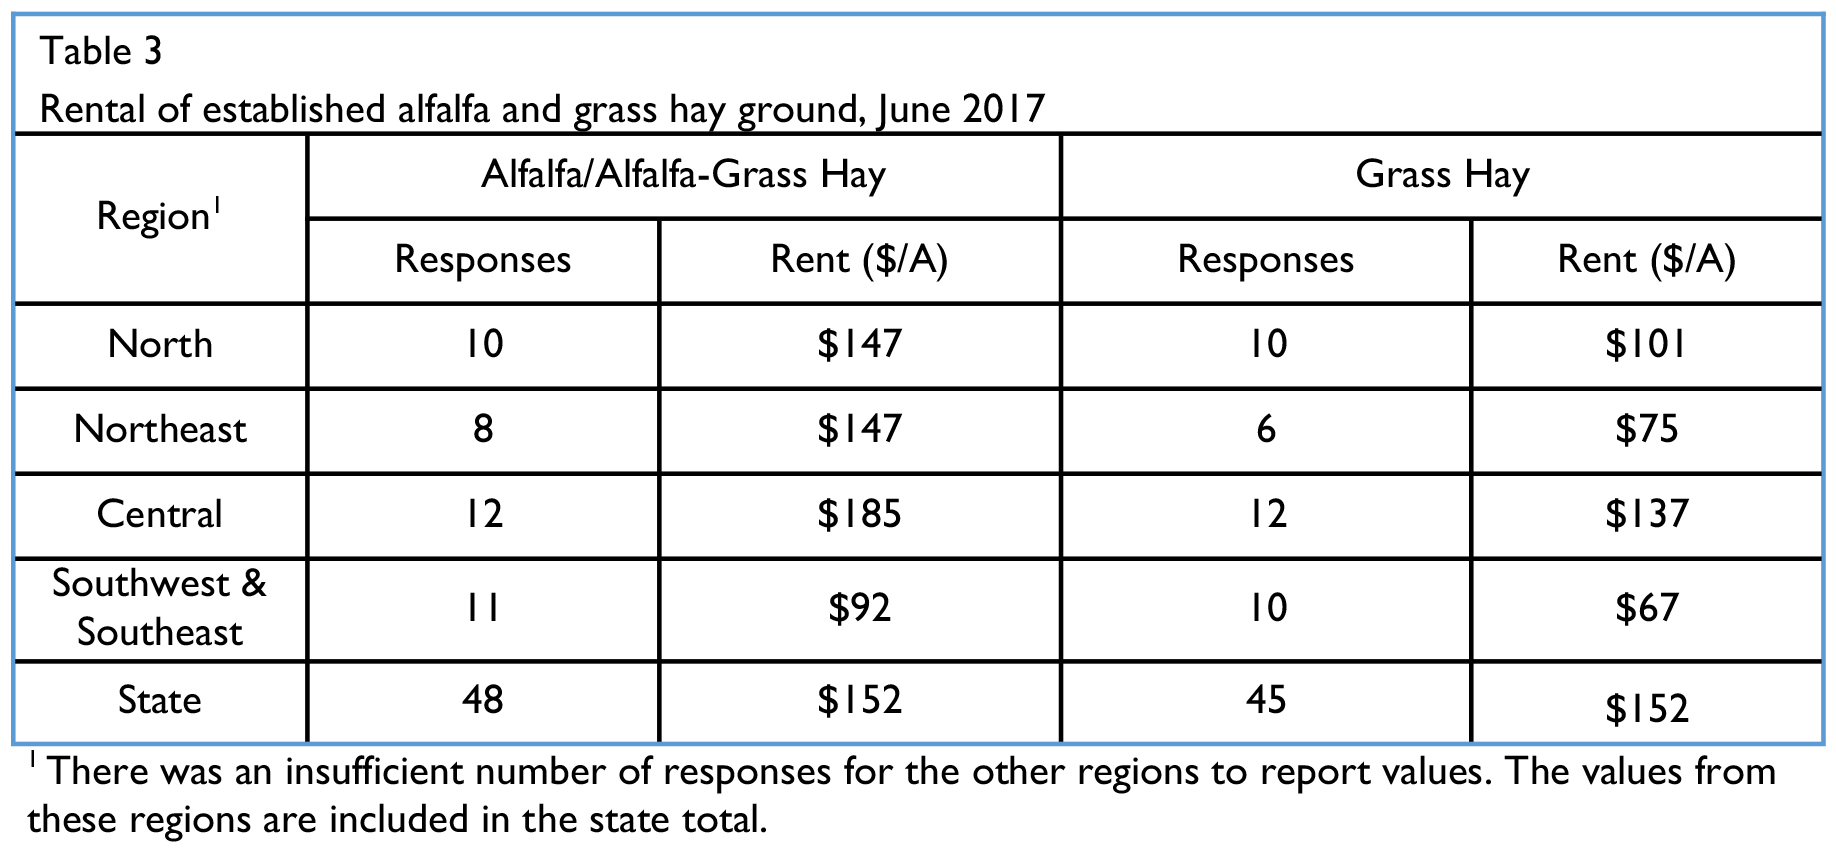
Table 2 Irrigated farmland: Number of responses, estimated market value, annual cash rent and rent as a per-cent of farmland value, June 2017

Table 3 Rental of established alfalfa and grass hay ground, June 2017
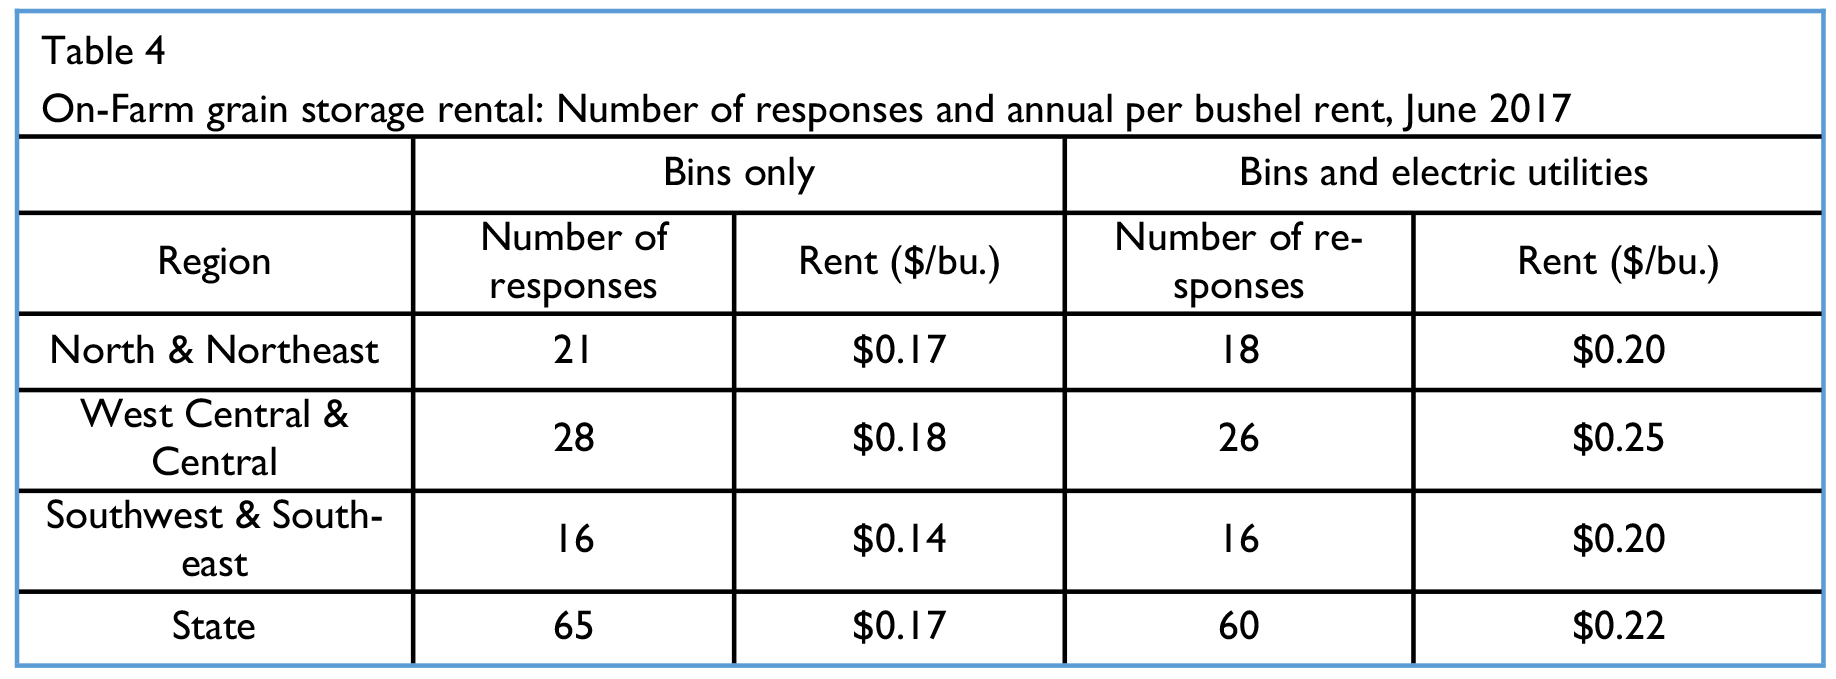
Table 3 Rental of established alfalfa and grass hay ground, June 2017

Table 4 On-Farm grain storage rental: Number of responses and annual per bushel rent, June 2017

Table 4 On-Farm grain storage rental: Number of responses and annual per bushel rent, June 2017


Similar rental rates for 2015 and earlier years is in the August issue of the Purdue Agricultural Economics Report archive. The first year for reporting this information was 2006. For 2016, these rental rates are in the February 2017 issue.
 

Publication Appeared Within:

Latest Articles:

The June 2026 CPI and PPI Reports: The Pipeline Cools Across Every Stage

June 12, 2026

June’s CPI and PPI both cooled, and the cooling reaches all the way back to Stage 1 — consistent with a genuine, if possibly temporary, easing of the energy shock rather than a one-month statistical blip. But most of the movement inside the food basket this month — dairy’s reversal, the citrus and lettuce climate stories, the tomato tariff baseline, Brazil’s coffee cycle, and the beef–pork divergence — traces to category-specific supply and policy dynamics that would be happening with or without the conflict.

READ MORE

El Niño 2026: Converging Pressures on Vegetable Oil Markets

June 12, 2026

A potential record El Niño is now forecast with high model consensus; the spring predictability barrier has been crossed; and we are within the critical agricultural windows for the most exposed crop systems.

READ MORE

The May 2026 CPI and PPI Reports: The Food Price Pipeline Is Loading at Record Rates

June 12, 2026

The May 2026 CPI and PPI data, read together, tell a coherent and analytically arresting story: quiet at the shelf, loading at record rates upstream.

READ MORE