What the 1992 Farm Records Show
August 16, 1993
PAER-1993-16
Don Pershing and Freddie Barnard, Extension Agricultural Economists
![]()
![]()
![]()
![]()
![]()
The 1992 Indiana farm records reveal a huge difference between the highest earning third and the lowest earning third of the 136 Indiana farm managers who participated in the Purdue Comparative Farm Business Summary for 1992. The income difference among similarly sized farms is an indication of the variability in production, marketing, and financial performance among farm managers.
Returns to labor, management, and equity averaged $102,756 for the high profit third, compared to $3,363 for the low profit third. Allowing for a 6 percent return on their equity, the high profit group had labor and management earnings of$83,332, compared to $-23,562 for the low profit group. The return to total farm investment (return over the value of labor and management plus interest paid) for the high profit group was 17 percent, compared to -1 percent for the low-profit group.
The high profit third had 27 cents from each dollar of value of farm pro-duction (VFP) to pay interest on borrowed money, reduce debt, and build investments; compared to -4 cents for the low profit third. The high profit group had a very high asset turnover ratio (62%), compared to the low profit group (32%), indicating high dollar sales in relationship to total assets. These farms tended to utilize more rented land as opposed to owned land, and thus with the favorable yields in 1992, had high dollar sales with relatively low investments. Lower labor productivity on the low profit farms ($85,300 VFP per person) appears to also be a significant factor in their poor returns compared to $156,300 VFP per person for high profit farms. Finally, expenses as a per-centage of revenue were much higher for the low profit group (89%) compared to the high profit group
(62%).
How does your farm compare? Is it closer to the high or low profit farms? For financial analysis of your farm, see your local Extension Agri-culture Educator. Farmers can learn how to use this analysis to improve their farm’s profitability. Further information on the 1992 farm records will soon be available in the publication 1992 Farm Business Summary, at your local Purdue Cooperative Extension office.
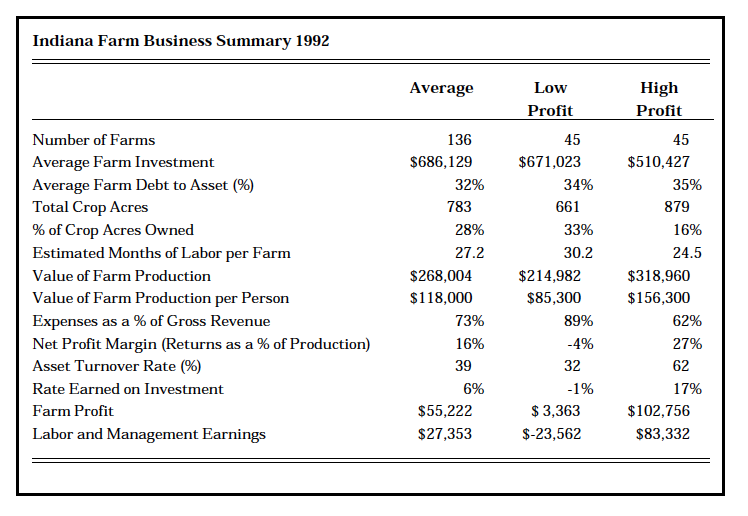
Table 1. Indiana Farm Business Summary 1992
![]()
![]()
![]()
![]()
![]()
