The Accuracy of USDA’s Retail Food Price Forecast
May 10, 2023
PAER-2023-21
Ethan Buck, Morgan Hinz, Yuxi “Jimmy” Jiang, Xiuyun “Lisa” Wen, all agricultural economics undergraduate students, and Todd H. Kuethe, professor and Schrader Endowed Chair in Farmland Economics
![]()
![]()
![]()
![]()
![]()
In 2021, U.S. consumers spent roughly $2.1 trillion on food, which accounted for approximately 10.3% of disposable personal income (USDA Economic Research Service, 2022). Since the onset of the COVID19 pandemic, food prices have increased substantially. Between August 2021 and August 2022, consumer prices for all food increased by 9.1%, with grocery prices rising by 13.5% and menu prices jumping 8.0% (U.S. Bureau of Labor Statistics). One of the primary sources of information on current and future retail food prices is USDA ERS’s Food Price Outlook.
This study examines the accuracy of the consumer retail food price forecasts of USDA ERS’s Food Price Outlook between 2004 through 2022. The forecast predicts annual food price changes as reported by Bureau of Labor Statistics’ Consumer Price Index. The timeline of USDA ERS’s food price forecast is shown in Figure 1. The forecast is conducted monthly, with each vertical tick mark represents one forecast. The initial forecast is released in July of the preceding year. For example, the first forecast for 2023 food price changes was released in July, 2022. For each year, USDA produces a total of 18 monthly predictions for each price series.
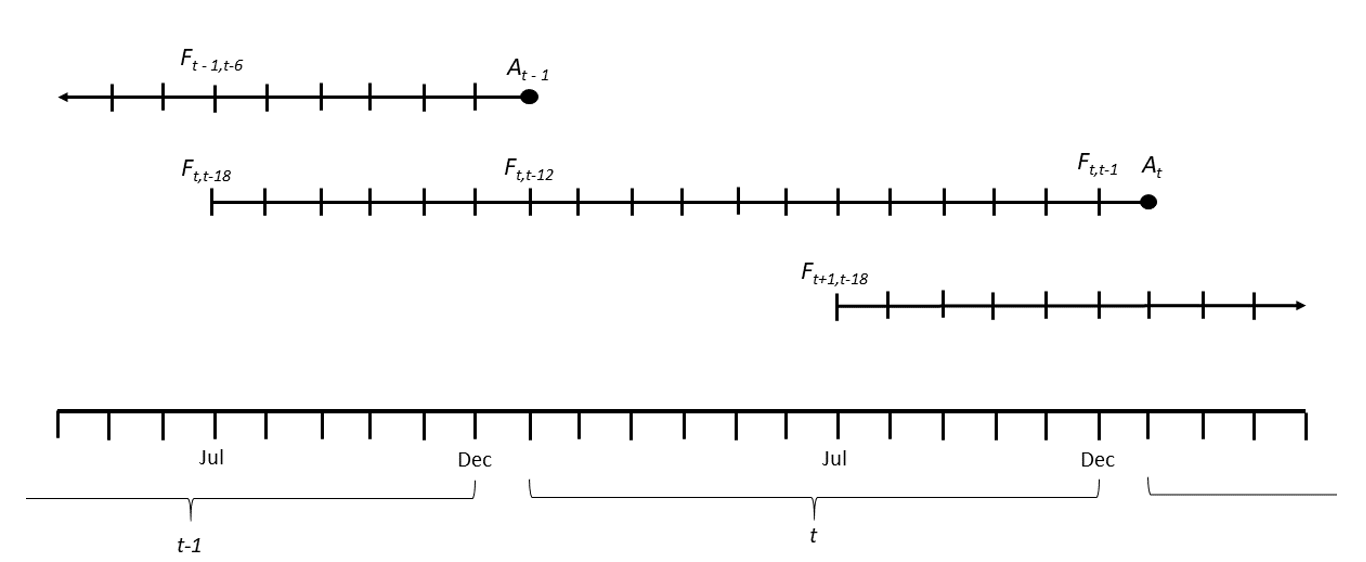
Figure 1: ERS Food Price Forecast Timeline
Forecasts are generated for a series of 22 nested price series. While our comprehensive study examines each of the series, this brief highlights the findings for three headline price forecasts: (i) all food, (ii) food at home (i.e., grocery prices), and (iii) food away from home (i.e., menu prices).
The forecasts are reported as a fixed one percent interval (e.g., 1 – 2% or 4.5 – 5.5%). The forecasts maximize the probability that this one percent interval contains the realized price change. Figure 2 plots the forecasts from 2004 through 2022 at four horizons: the initial forecast released in July the year before (18-month horizon), the first forecast of the calendar year in January (12-month horizon), the forecast released in July of the reference year (6-month horizon), and the final forecast released in December of the reference year (1-month horizon). The one percent interval forecasts are represented by the vertical black bars, and the realized outcomes are represented by the dashed red line.
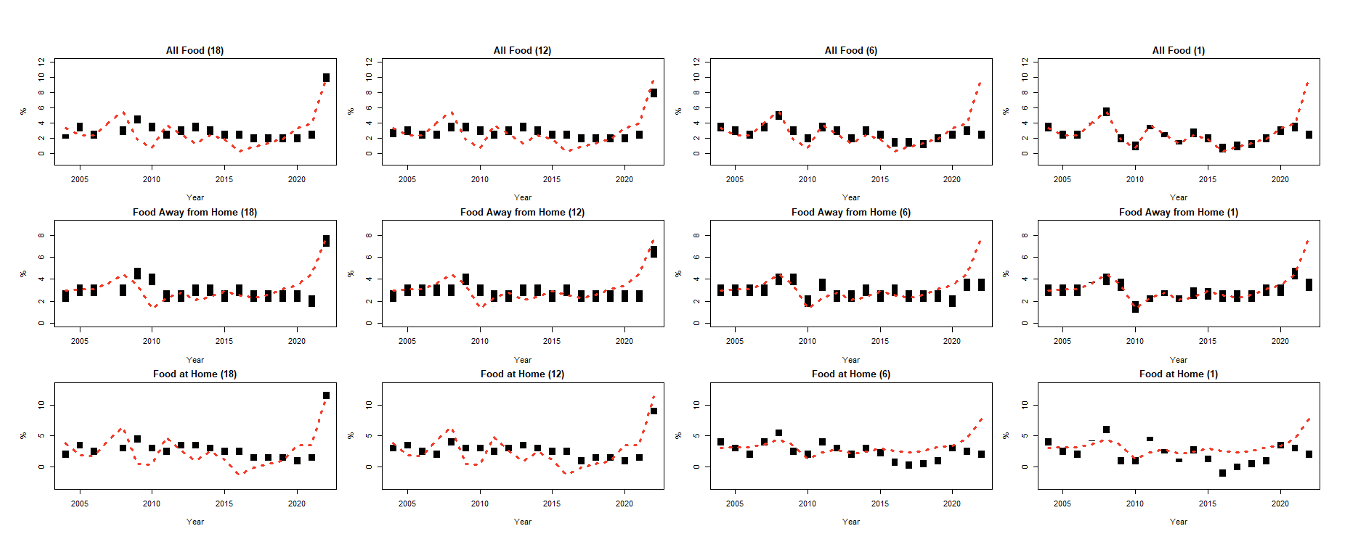
Figure 2: Food price forecast and observed outcomes, 2004 – 2022
The accuracy of interval forecasts is measured by the “hit rate” or the average number of times that the observed outcome falls within the reported interval throughout the history of the forecast. We calculate the hit rate for each price forecast at each horizon. The forecasts are expected to improve throughout the forecast cycle, and as a result, the hit rate is expected to increase as the realized outcome approaches.
As shown in Figure 3, the forecasts generally improve as the horizon shortens. For example, the hit rate suggests that realized price changes for all foods fall within the predicted interval 22% of the time for the initial forecast (18-month horizon), but the hit rate for the final forecast in December (1-month horizon) improves to 95%. The hit rate for food away from home is markedly lower, beginning at 6% and improving to 79%. The food at home category has the best initial hit rate, at 56% but a lower ending hit rate, at 89%.
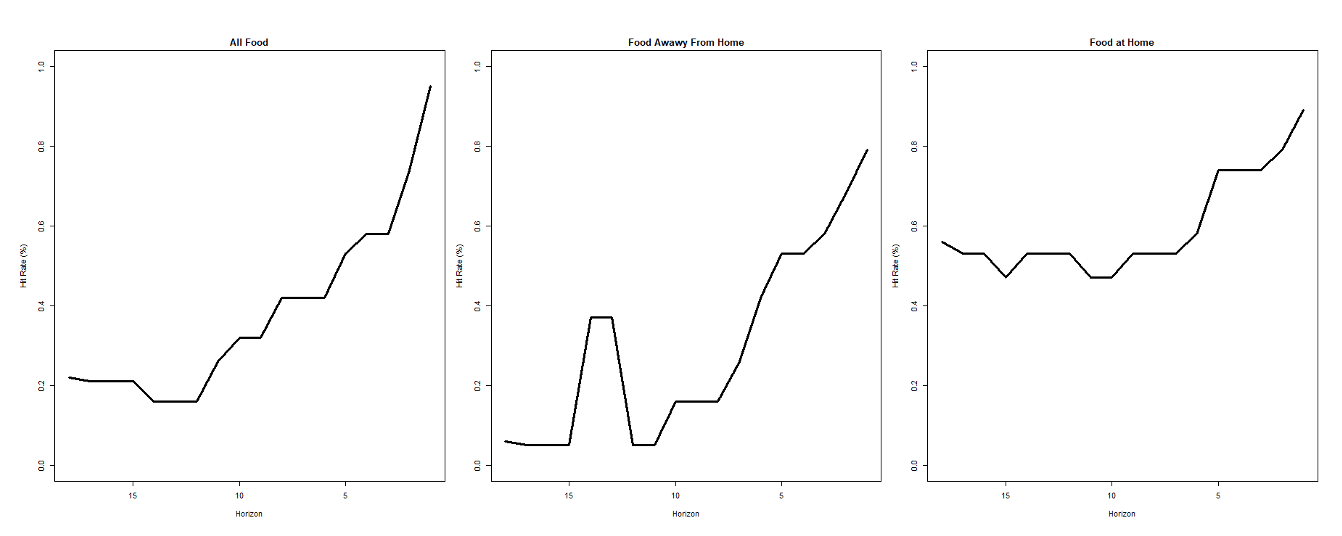
Figure 3: Average hit rate by forecast horizon, 2004 – 2022
Overall, the accuracy measures suggest that USDA retail food price forecasts are better at predicting changes in grocery prices than changes in menu prices. However, the forecasts provide good predictions of food price changes in later periods of the forecast cycle.
![]()
![]()
![]()
![]()
![]()