A Closer Look at Recent Variability in On-Farm Corn Storage Returns
June 5, 2019
PAER-2019-06
Author: Chris Hurt, Professor of Agricultural Economics
![]()
![]()
![]()
![]()
![]()
The corn and soybeans storage returns articles examine long run averages. These can be somewhat misleading when there is a lot of variation from year to year. For this reason we are providing a peek at the weekly speculative on-farm corn returns data for the last ten years.
One reason returns to speculative on-farm corn storage are often highly variable is because one is mixing the returns to storage with returns to speculation on cash corn prices. Yet, it is the most common strategy among farmers and that is to put corn in the bin at harvest and hope prices rise through the storage season.
There are ways to separate out the returns to storage from returns to speculation. For example if a farmer puts corn in the bin at a cash harvest value of $3.50 a bushel and stores that until May when a huge South American drought causes overall prices to rise to $5.50 they might say, “storage really paid this year.” In reality it was their speculation for higher prices that really paid. We know this because they could have earned much of the $2 increase by selling the grain at harvest and replacing with futures.
Table 1 shows the weekly returns to speculative on-farm corn storage above interest costs as outlined in the previous article. The marketing years are shown on the top row of the table. Numbers in red are negative returns for that week. It may be a surprise to see how many of the weeks had a negative return. At the bottom of the table is the average of the weekly returns for the year. The three bad years to store corn in this period for speculative storage were the crops harvested in 2009, the 2012 drought and the crop harvested in 2015. The average return for storing the 2012 drought crop was a negative $.81 per bushel as an example.
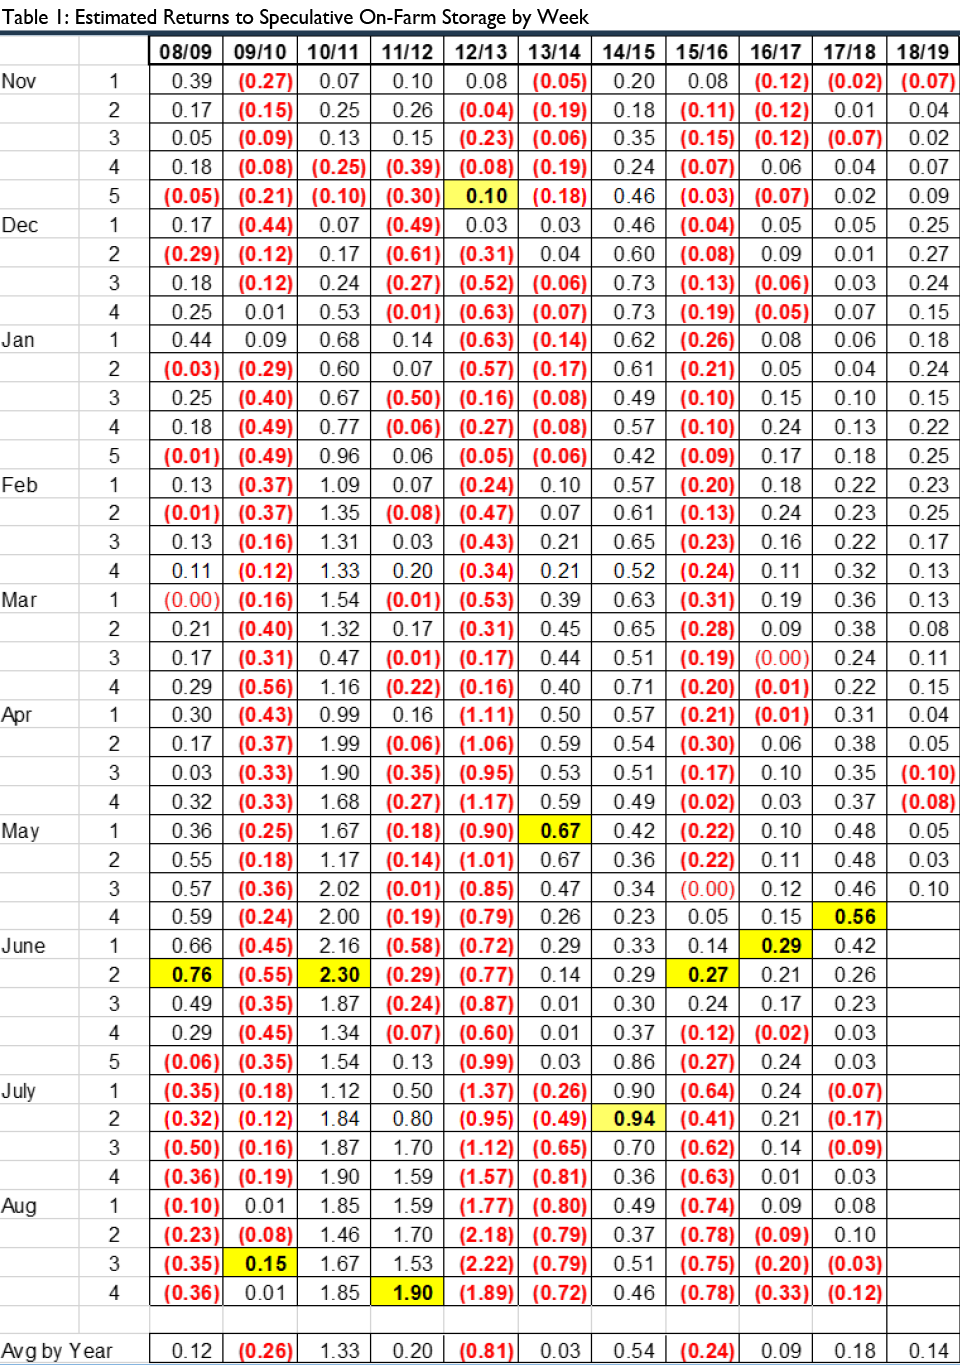
Table 1: Estimated Returns to Speculative On-Farm Storage by Week
In addition, the week of each year that was optimal for pricing is shown as a yellow shaded cell along with the returns per bushel above the harvest price and interest costs for that week. For these years there was a dominance for the optimum pricing week to be in May through the first two weeks of June with six of the ten years having peak returns in that period, but which specific week varied.
What do these speculative storage returns look like for the 2018 corn crop? Those results have been added on the right hand side for results available at publication time. So far the best storage returns for the 2018 corn crop were back in the second week of December (+$.27). Cash corn prices eroded in the early spring with continued trade conflicts, higher corn stocks, and weak demand. Wet weather and delayed planting in May 2019 began recovery in cash corn prices and thus began to elevate speculative storage returns.
One unique year can have a big influence on the longer run averages. As an example look at the 2010/2011 marketing year. This was the year nearing the final corn demand surge of the biofuels boom and the world economy recovered from the 2009 global recession. As a result corn prices surged upward. Much higher corn prices into the summer of 2011 drove the storage returns to reach $2.30 per bushel by June. This one unique year can have a large influence on a ten year average. Will a similar unique year occur in the next ten???
![]()
![]()
![]()
![]()
![]()