Soybean Storage Returns: Implications for Storage and Pricing Decisions
June 5, 2019
PAER-2019-07
Author: Chris Hurt, Professor of Agricultural Economics
![]()
![]()
![]()
![]()
![]()
Soybean storage returns are examined in this article. The method of measuring those returns is similar to corn. Please read the corn storage return article in this publication for that information. One difference is that the harvest price for soybeans was assumed to be the cash prices in the first two weeks of October, while the corn harvest price was assumed to be the last two weeks of October.
The weekly cash prices used were from a central Indiana elevator that loaded unit-trains. While both corn and soybean data is from central Indiana, it is likely that the overall conclusions would hold for a broader geographic area including central and northern Illinois, Indiana, Ohio and southern Michigan in the Eastern Corn Belt. Ohio and Illinois River markets may have some differences in patterns due to their unique shipping seasons.
As a brief summary, it is assumed the grain is placed in storage at harvest time. The question then is, “do cash price bids move above the harvest price during the storage season by enough to cover interest costs for on-farm storage?” For commercial storage the question is, “do cash price bids move above the harvest price by enough to cover interest costs and commercial storage charges?”
For on-farm storage, these results can be viewed as an estimate of the returns per bushel to cover the ownership and operating costs of on-farm storage.
While putting soybeans in the bin at harvest and then pricing later is the most common farmer marketing strategy we call these speculative returns to storage. This is because returns measured this way are mixing the returns to storage and returns to speculating on the price. As an example, if one stores soybeans at harvest with a value of $9.00 per bushel, and by the following May a South American drought causes prices to rise to $12.00 most would declare this to be a high return to storage. In reality most of this high return was due to prices being driven up by the drought. As a price speculator, the farmer would receive this higher value, but the biggest part of the gain was due to price speculation.
Strong Speculative Soybean Storage Returns
Our historical record suggest that those who stored soybeans at harvest and then priced them later at the cash bid have had strong positive returns on average over the periods represented as the last 10 years, the last 20 years, and the last 30 years.
Returns above interest costs for on-farm storage for these three time periods are shown in Figure 1. Farmers and landlords who store soybeans are interested in knowing what weeks of the marketing year were best to be pricing in the past. That was late-April-May and early-June. All three time periods exhibited this spring pricing preference. We also observe in Figure 1 that the returns to speculative on-farm storage tended to rise consistently from harvest until the following spring on average.
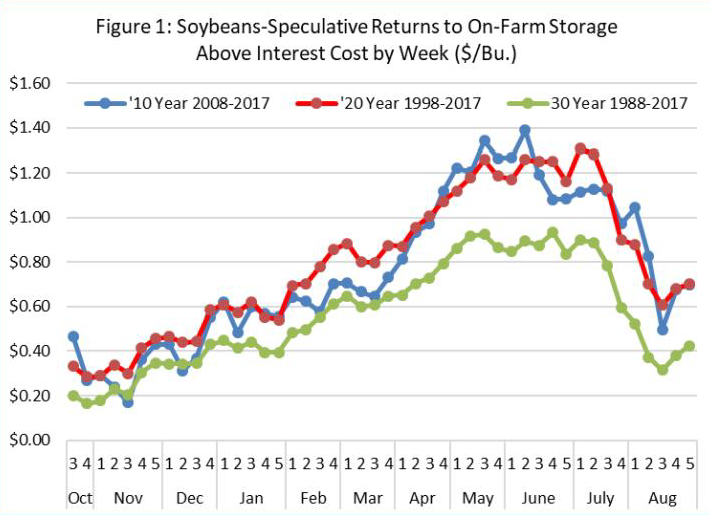
Figure 1: Soybeans-Speculative Returns to On-Farm Storage Above Interest Cost by Week ($/Bu.)
You may also note that the 30 year time period which covers the crop harvested in 1988 to 2017 had lower overall returns to on-farm storage than the nearest 10 and nearest 20 year periods. This is due to some of the unique events for the crops harvested in 1988 to 1997. That starts with the 1988 drought, and drought years generally have high prices at harvest with cash bids dropping throughout the storage season. In addition after 1995 the Asian financial crisis resulted in generally falling soybeans prices. Again it is hard to get a positive speculative return to storage when overall prices are generally going down.
How much return per bushel was there for on-farm storage? The returns calculated in this manner can be viewed as an estimate of the returns above interest costs to cover the ownership and operating costs of on-farm storage. That estimate suggest the returns have been $.80 to $1.30 per bushel per year on average over the three time periods for beans priced during the optimum historic time periods in the spring.
Finally, as with corn the potential penalty for waiting to price soybeans into the following summer has been large on average in the past.
Figure 2 shows the historic odds of a positive storage return above interest costs for on-farm storage. That reached 70% to 90% of the years by the spring for each of the periods.
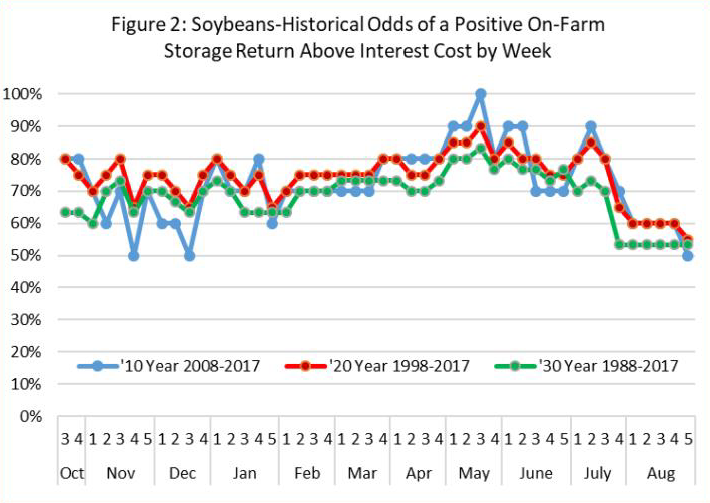
Figure 2: Soybeans-Historical Odds of a Positive On-Farm Storage Return Above Interest Cost by Week
Results for speculative returns to commercial soybean storage are shown in Figure 3. Here, both interest costs and the commercial storage charges are subtracted from returns. This historical record shows that spring pricing was the most favorable on average over these periods and that speculative storage returns above interest and commercial storage charges averaged $.60 to $1.00 a bushel per year for the optimum spring pricing.
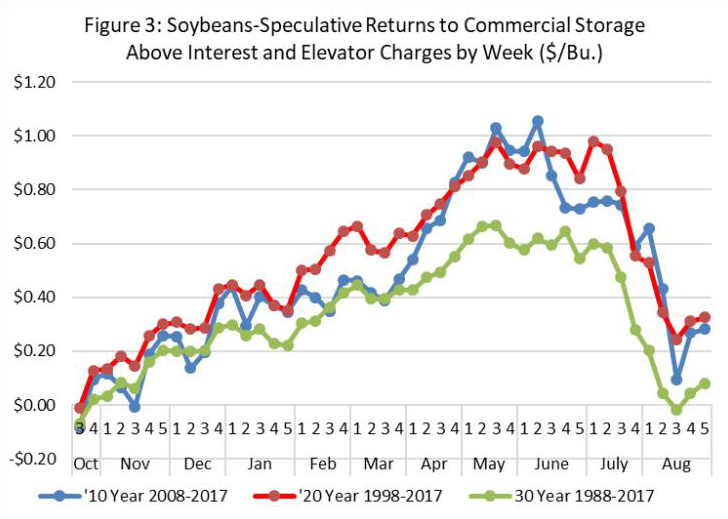
Figure 3: Soybeans-Speculative Returns to Commercial Storage Above Interest and Elevator Charges by Week ($/Bu.
The historical odds of a positive storage return to commercial storage were about 60% to 80% of the years in each period for pricing in the spring as seen in Figure 4.
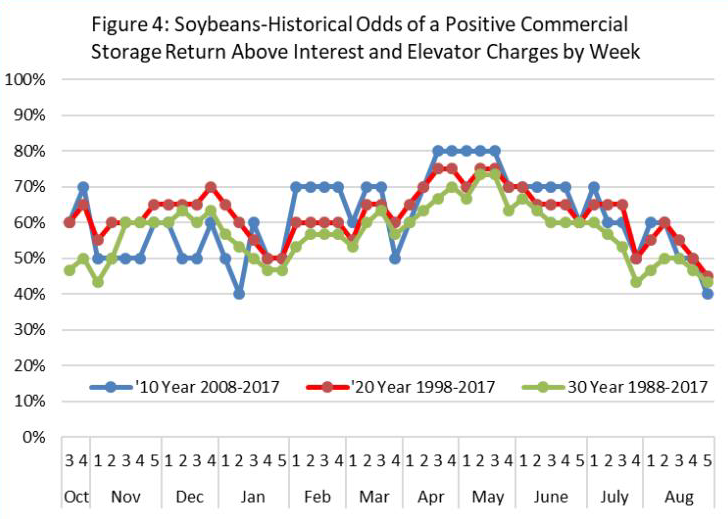
Figure 4. Soybeans-Historical Odds of a Positive Commercial Storage Return Above Interest and Elevator Charges by Week
Summary Thoughts for Storage Decision Makers
Returns to speculative soybean storage have been strong in Indiana over the past decades on average as measured by this methodology. Those were $.80 to $1.30 per bushel for on-farm storage as an estimated return to cover the ownership and costs of operating on-farm storage. Commercial storage returns averaged $.60 to $1.00 a bushel above all estimated costs.
We call this speculative storage returns because it mixes the returns to storage and returns to speculating on higher prices. The strong returns are likely related to the huge growth of Chinese usage in the past 25 years. In addition, as the South American crop has now become larger than the U.S. crop, growing seasons with reduced yields there have enabled U.S. spring bean prices to rally by several dollars per bushel. These years have been very influential in the results in this study.
While this study helps identify timing of pricing down to the week on average, there is a considerable amount of variation from year to year. This means there is value in learning about storage returns and in considering the price outlook when making storage and pricing decisions. Farmers and landlords who store soybeans can start their storage and pricing strategies based upon these historic guidelines, but since each year can be different from the long term norm it is a good idea to make some potential adjustments based on three factors: the storage situation for each year; the current price outlook; and for the particular economic situation of your business like cash flow needs and income tax management.
One filter that has meaningful impacts on these results is to consider not storing in years when production is very low. Low production years, like the 2012 drought, have a strong tendency toward high prices at harvest with declining prices through the storage season. Markets generally send price signals in these years not to store. These signals are likely to be in both the futures market and in the grain buyer’s cash bids. In the futures markets the harvest futures (November for soybeans) will be higher priced than the futures during the storage season like the following March-May-July futures (an inverted futures market). Secondly in the cash market, the grain bids may be higher for harvest delivery than they are for delivery through the winter and spring.
Finally, the results in this study are historical, and we all know that history is not an assurance that the same results will apply to the future. This means you need to stay aware of economic forces that are different from year to year in making storage and pricing decisions. One current example is the unusual use of tariffs by the U.S. in 2018 and 2019.
![]()
![]()
![]()
![]()
![]()