Land Values Continue Rise
September 1, 1998
PAER-1998-10
H. Atkinson, Professor Emeritus; Craig L. Dobbins, Professor; and Kim Cook, Research Associate*
![]()
![]()
![]()
![]()
![]()
The 1998 Purdue Land Values survey indicates that the value of an acre of average bare Indiana cropland was$2,155 per acre in June 1998, $55 more than the all-time peak reached in 1981. This is an increase of $158 per acre, or approximately 8 percent, over the value reported in 1997. In each of the past five years, annual increases in the value of this land have ranged from about $100 to over$200 per acre, resulting in an increase of 65 percent for the five-year period. Cash rents rose from 1997 to 1998 on average land by a little less than 2 percent to $112 per acre. While rents continued to move upward setting new highs, the rate of increase was significantly less than the 6-percent increase reported in 1997. The increase in cash rents for the past five years has been only 26 percent, in contrast to the 65-percent increase in average land values.
Statewide Land Values
For the six months ending in June 1998, the value of bare tillable land was reported to have increased 1.9 percent on top land, 2.2 percent on average land, and 2.3 percent on poor land (Table 1). While land values for all three types of land moved higher, the rates of increase were much less than the rate of increase reported for this same period in 1997. Slightly more than half of the respondents, 52 percent, reported that some or all classes of land went up from December 1997 to June 1998, whereas 68 percent of respondents reported an increase last year. Thirteen percent of the respondents indicated that some or all classes of land fell in value during that same six-month period, compared to 3.9 percent of the respondents the previous year.
The statewide 12 month increase on the value of average land from June 1997 to Jun 1998 was 7.9 percent (Table 1). Top quality land (151 bushel corn yield rating) was estimated to have increased by $166 per acre, to $2,715 (Table 1). Average land (123 bushel corn yield rating) was valued at $2,155 (up $158), while poor land (95 bushel corn yield rating) was estimated to be worth $1,632 per acre, up 9.3 percent for the year. All three classes of land values were above their 1981 peak.
The land value per bushel of corn yield rating also increased this year, but at much lower rates than reported last year. For top quality land, value per bushel of yield was$18.02, up by 5.7 percent. Average quality land value was $17.59 per bushel, while the poor quality value was $17.12 per bushel. (Table 1). The percentage increases were 7.5 per-cent on average land and 8.1 percent on poor land. These per-bushel figures were $0.97 higher than last year on top land, $1.23 higher on average land, and $1.29 higher on poor land.
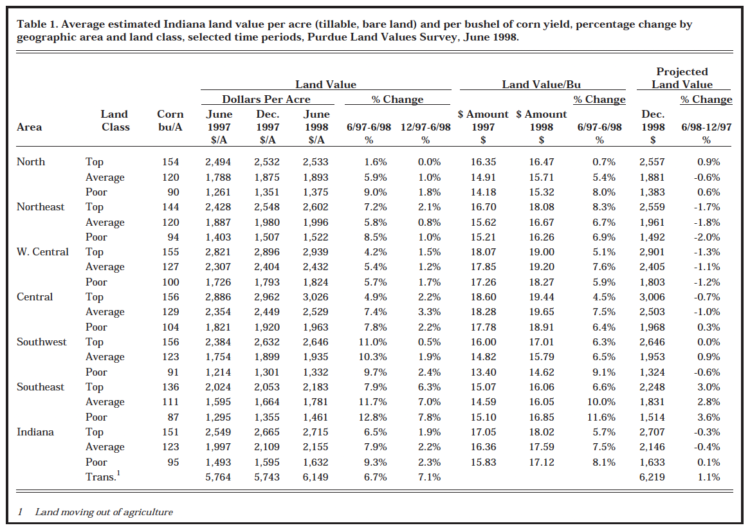
Table 1. Average estimated Indiana land value per acre (tillable, bare land) and per bushel of corn yield, percentage change by geographic area and land class, selected time periods, Purdue Land Values Survey, June 1998
The value of transition land moving into non-farm uses increased 7.1 percent in the 6-month period ending in June, to $6,149 per acre. On a year-to-year basis, the averages show a 6.7-percent increase (Table 1); however, due to the wide variation in estimates (from $1,625 to $25,000 in June, 1998), the median value may give a more meaningful picture than the arithmetic average. The median value of transition land in June, 1998 was $5,000 per acre, the same value as reported in June of 1997.The median value of individual home sites up to five acres was $5,000 per acre, the same as last year, and sites of 10 acres or more suitable for residential sub-divisions were valued at $4,500 per acre, up from $ 4,000 last year.
Statewide Rents
Cash rents increased statewide from 1997 to 1998 by $5 per acre on top land. Average and poor land increased by $2 per acre (Table 2). The estimated cash rent on average land was $112 per acre, $140 on top land, and $86 on poor land. Rent per bushel of estimated corn yield was$0.93 on top land and $0.91 on average and poor land, up five to six cents from last year. Cash rent on top land in 1998 exceeded by $3 the record 1981 level of $137 per acre. Average land exceeded the 1981 value of $106 per acre by $6, while rents on poor land exceeded by $8 the 1981 level of $78 per acre.
Statewide, cash rent as a percentage of estimated land value declined for the seventh consecutive year, to around 5.2 percent (Table 2). Greater increases in land values than in cash rents continue to cause these declines, but the percentages state-wide were still slightly higher than the 5 percent levels of 1978-81.
Area Land Values
Increases in the value of farmland in the six different geographic areas of Indiana (Figure 1) from December 1997 to June 1998, ranged from 0.0 percent to 7.8 percent (Table 1). Nearly all areas reported a greater percentage increase for poor land than for top and average land. Only the Northeast reported a larger increase in top land. The Central region reported the same increase for top and poor land, but a larger increase for average land.
For the year ending in June 1998, the greatest increase in top farmland was the Southwest (11.0 percent). The Southeast had the greatest increase in average and poor farmland, 11.7 percent on average land, and 12.8 percent on poor land. The Southwest also exhibited a fairly strong market, with double-digit increases for top and average land types. However, the Central, West Central, Northeast, and North regions, which saw double-digit increases for nearly all land qualities in 1997, had smaller increases this year.
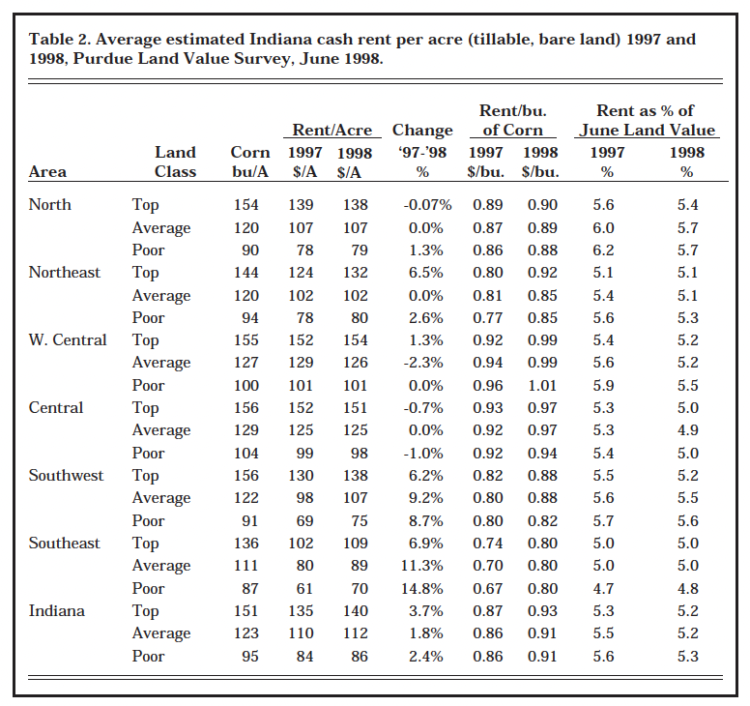
Table 2. Average estimated Indiana cash rent per acre (tillable, bare land) 1997 and 1998, Purdue Land Value Survey, June 1998
The highest valued top quality land was again in the Central and West Central areas, around $3,000 per acre. The next highest values were in the Southwest ($2,646), Northeast ($2,602), and the North ($2,533). Reported values for average quality land were $2,529 in the Central and $2,432 in the West Central areas, but only around $1,700 to $2,000 in the other areas. Some of these area differences in values between land in the same productivity class are associated with differences in respondents’ estimates of corn yield ratings. For example, average land in the Southeast had a corn yield rating of 111 bushels per acre and in the North, 120 bushels; however, the land values per bushel of corn yield estimates were about the same in both areas.
Land values per bushel of estimated average corn yield (land value divided by bushels) on top land were in the range of $18.00 to $19.50 for the Northeast, Central, and West Central regions (Table 1) and $16.00 to $17.00 for the Southeast, North, and Southwest. Land values per bushel declined as land quality (corn yield estimates) declined in all areas except the West Central, Central, and Southeast.
Respondents were asked to estimate rural home sites that had no accessible gas line or city utilities and were located on a black top or well maintained gravel road. The median value for five-acre home sites was $5,000 in all areas. For the Northeast, Southwest, and South-east areas, there was an increase in the median value. For the other regions, there was no change from values reported last year. Estimated per-acre median values of the larger tracts (10 acres) ranged from $4,000 to $5,000, except for the $3,000 estimate in the Southeast.
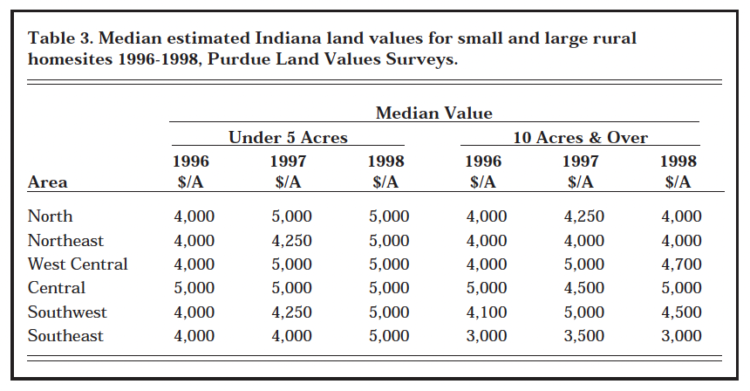
Table 3. Median estimated Indiana land values for small and large rural homesites 1996-1998, Purdue Land Values Surveys.
Shown in Table 3 are median values for home sites under five acres and 10 acres or more, in 1996, 1997, and 1998.
Area Cash Rents
Cash rents for top land increased by$7 – $8 per acre in the Southeast, Southwest, and Northeast areas, $2 in West Central Indiana, with a slight decline ($1) reported for the Central and North areas (Table 2). Last year cash rents increased in all areas and for all three productivity classes except for poor land in the Southwest. This year the North, Northeastern, West Central, and Central regions reported a mixture of small increases, and in some cases, small declines or no change in rental values across productivity classes. The one exception was the$8 increase for top land noted in the Northeast region. The Southeast and Southwest regions reported increases of $6 to $9 per acre (Table 2). The highest percentage increase was for poor land in the Southeast (14.8 percent).
Cash rents were again highest in the West Central and Central areas, at $154 and $151 per acre, respectively, for top land, and $126 and $125 per acre, respectively, for aver-age land. Cash rents of around $1.00 per bushel were also highest in these areas. The per-bushel rent for top land was 92¢ in the Northeast, 90¢in the North, 88¢ in the Southwest, and 80¢ in the Southeast. In all areas except the Northeast and Southwest, rates per bushel within areas varied by 2¢ or less by land quality.
Except for poor quality land in the Southeast, cash rent as a percentage of land value declined or remained the same for all land classes. This rate on top and average land was in the range of 4.8 percent to 5.7 per-cent in all areas.
Respondentsʼ Outlook
Respondents continued to be less optimistic about further price increases for the year ahead. Last year, 54 percent of the survey respondents expected some or all classes of land to increase over the next 12 months, but that figure dropped to 28 percent this year. Last year 6 percent of the respondents expected a decline in values. This year, this increased to 26 percent. About 39 percent expect no change in the year ahead, compared to 38 percent last year.
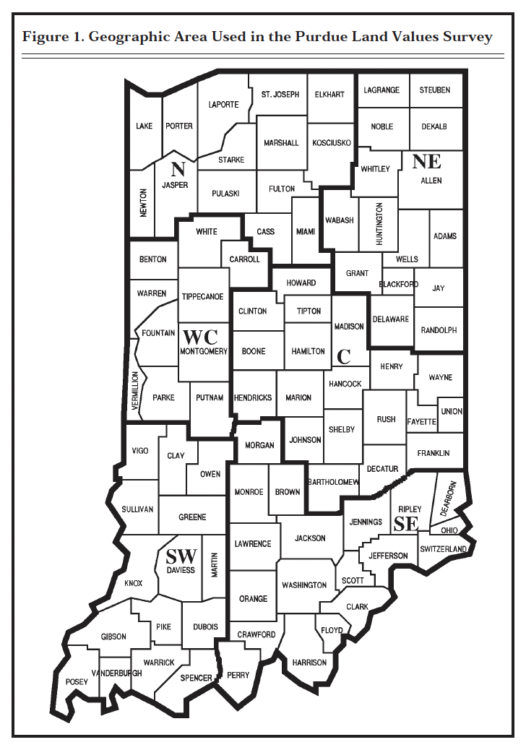
Figure 1. Geographic Area Used in The Purdue Land Values Survey
Respondents were also asked about their expectation of land value changes over the next six months. Decreases were expected in the Northeast, West Central, and Cen-tral areas. Expected land value increases in other areas, except for the Southeast, were under 1 percent (Table 1). The expected change in land values over the next six months for the Southeast ranged from 2.8 to 3.6 percent. These projections in the past have been in the right direction, but have not been a good indicator of the actual magnitude of change. This year there is not a strong indication regarding the future direction of land values. It would appear that the short-term future may be one in which the steady upward march in land values is curbed.
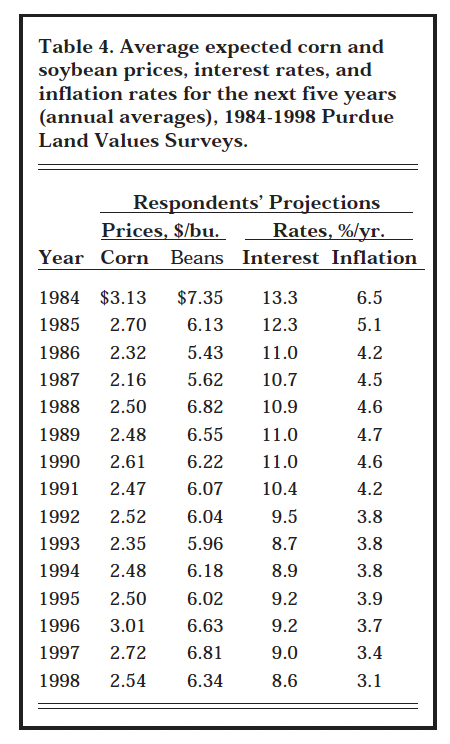
Table 4. Average expected corn and soybean prices, interest rates, and inflation rtes for the next five yers (annual averages), 1984-1998, Purdue Land Values Surveys.
When asked about their longer-run expectations over the next five years, about 65 percent of the respondents predicted that land values would increase. The remaining 35 percent were divided between expecting a decline (21 percent) or no change (14 percent). On average they expected a small increase of 4.4 per-cent for the five years, which is less than half of last year’s projection of 10 percent for the five-year period.
Respondents were asked to estimate annual average prices over the next five years for corn and soy-beans, the farm mortgage interest rate, and the rate of inflation. The projections they have made since 1984 are shown in Table 4.
This is the seventh consecutive year that expected farm mortgage interest rates have remained under 10 percent and inflation under 4 per-cent. An 18¢ decrease occurred in the expected price of corn. The $2.54 per bushel estimate is 3¢ less than the average for the 15-year series. This year the soybean price declined 47¢, ending two years of increases. Gross revenue expectations for 125 bushel corn yields and 45 bushel beans in a 50-50 rotation declined $22 per acre from last year. To the extent that land market participants have simi-lar reduced expectations, this reduction in revenue expectations could exert downward pressure on land values. Combined with other factors like an increase in land on the market in response to lower capital gains tax and reduced transition payments, a leveling off of land values seems likely. If this year’s crop results in increased supplies or export demand remains soft, putting additional downward pressure on prices, a decline in land values might occur.
Land Market Activity
The number of farmland transfers in the six months ending in June com-pared to a year earlier is estimated to be up by 34 percent of the respondents versus 30 percent last year. No change in the number of transfers was reported by 47 percent of the respondents, while 20 percent indicated a reduction in the number of transfers. More land was thought to be on the market now by 19 percent of the respondents, versus 12 percent a year ago and 16 percent two years ago.
Respondents were asked their perception of items that might be influencing the supply of land on the market. The changes in capital gains taxes were thought to have increased the supply of land on the market by 48 percent of the respondents. A group of 51 percent reported that this tax change had no impact. The number of retiring or retired farmers selling land was identified by 42 per-cent of the respondents as a supply-increasing reason.
Expectations about the future play a major role in both the decision to sell and purchase land. The expectation that land values had peaked was listed by 37 percent of the responds as the reason for an increased supply of land. This was followed by 26 percent listing a reduced profit expectation and 25 percent indicating a reduced profit expectation relative to other investments.
Respondents were also asked about their perceptions of how the purchasers of farmland had changed from a year earlier. Demand from farmers was said to have increased by 39 percent of the respondents, while 16 percent of the respondents indicated that farmer demand had declined. Nearly everyone (84 per-cent) indicated an increase in demand for rural homesites. Only 1 percent of the respondents indicated a decrease in this demand, while 15 percent indicated no change. Thirty-two percent of the respondents indicated that individual nonfarm investors in farmland had increased, while 13 percent indicated that this source of demand had decreased. The purchase of farmland by pension funds and other large investors is always a topic of discussion. Twenty-three percent of the respondents indicated that, compared to a year ago, demand from this source had declined, 5 percent indicated an increase, and 72 percent indicated no change.
Land Value/Cash Rent Multiples The fact that average Indiana farm-land values increased again for the year ending in June 1998 (up about 50 percent over the past 5 years) and the earnings expectations among respondents drifted lower gives rise to the question, “Will land values decline?” But viewed alone, the fact that land values have risen rapidly is not sufficient justification to suggest that they are too high—returns to land investment must also be considered. Over the past five years, cash rents (a measure of returns) have increased 19 percent, only about one-third as much as the per-centage increase in land values. Stock market analysts often refer to the “price/earnings ratio.” In a simi-lar way, a land value/cash rent multiple can be calculated. For example, data from the Purdue survey indicates a value/rent multiple of $19.29 ($2,155/112 = $19.2) of land value per $1 of cash rent, for 1998. Is this figure abnormally high, thus suggesting that land values are too high? To answer this question we need to have an estimate of what is “normal.”
For the period 1975 to 1998, the value to rent multiple has ranged from a low of 12.4 in 1986 to a high of 20.6 in 1979 (Figure 2). At the peak, there were four years, 1978 to 1981, when the value to rent multiple varied by only 1.2 before rapidly declining. At the bottom, 1986, there were five years from 1985 to 1989 in which the value to rent multiple varied only 1.1 before beginning the recent rise. These two turning points suggest that there are periods of stability in the value to rent multiple before a new direction is established.
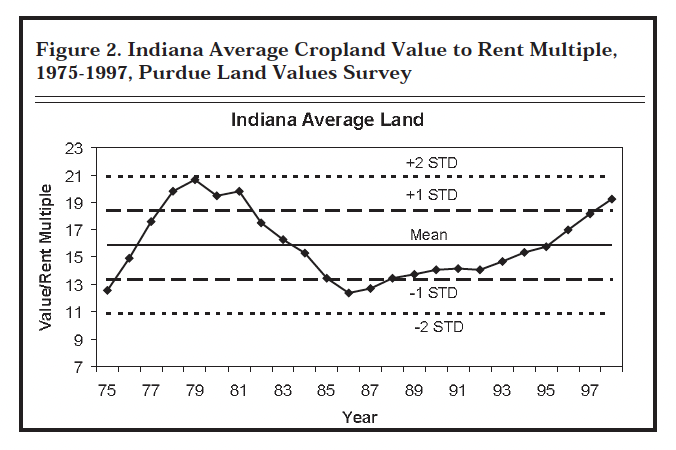
Figure 2. Indiana average Cropland Value to Rent Multiple, 1975-1997, Purdue Land Values Survey
Over this period the value to rent multiple averaged 15.9, with a standard deviation of 2.5. At a multiple of 19.2, the value to rent multiple is about in the same range as in the 1978 to 1981 period. If one assumes that the value to rent multiple is normally distributed, this means there is only a 10-percent chance that a higher value will be achieved. Or looking at it from the other side, there is a 90-percent chance of a lower value to rent multiple. Since 1975, the land value/rent multiple has exceeded 19.2 in only four years (1978-1981).
High hopes of continued large grain exports to Asia in the near-term have disappeared, calling into question once again just what size this export market might be over the longer term. Government transition payments will decline in 1999 and the following years and then may be discontinued. The idea of a new higher plateau price level for corn and soybeans is being tested by the current low prices. A decline in farm profits is expected for 1998. Could these events trigger a down-trend in land values which might continue for several years? If so, and if land values declined faster percentage-wise than cash rents, the value/rent multiple would decline toward more “normal” levels. While making a firm prediction of a decline in land values and the multiple based on this analysis may not be justified, it does suggest more caution than in the past be used in land purchases. [Editor’s Note: Farmland values may be positively influenced by provisions in the federal estate tax law. Special valuation (Section 2032A) of farmland permits the reduction of landowner estates by up to $750,000. The new, family-owned business interest deduction (Section 2057) excludes business interest in amounts up to $675,000. These two provisions (and others in income and estate tax law) encourage family-operated land and other business assets to remain in estates, and in existing families. While difficult to measure, these provisions would decrease the supply of land on the market.]
**********
The land values survey was made possible by the cooperation of professional farm managers, appraisers, brokers, bankers, county extension educators, and persons representing the Farm Credit System, the Farm Service Agency (FSA) county offices, and insurance companies. Their daily work requires that they stay well informed about land values and cash rents in Indiana. The authors express sin-cere thanks to these friends of Purdue and Indiana agriculture. They provided 356 responses representing most of Indiana’s 92 counties. We also express appreciation to Sandy Dottle and Carolyn Hunst of the Department of Agricultural Economics for their help in conducting the survey.
* J.H. (“Jake”) Atkinson has formally retired from the Department of Agricultural Economics. Jake expresses his personal appreciation to the respondents who make this report possible, especially to those who respond year after year. Refer your questions arising from this article, and those concerning future surveys to Craig Dobbins.
Ag Outlook ’99
![]()
![]()
![]()
![]()
![]()
