Indiana Land Values and Cash Rents
August 1, 1984
PAER-1984-1
Author: J.H. Atkinson, Professor of Agricultural Economics
![]()
![]()
![]()
![]()
![]()
Note: The charts in this article were taken from physical copy scans – as the original documents no longer exist. These versions are very blurry – we apologize in advance for the quality.
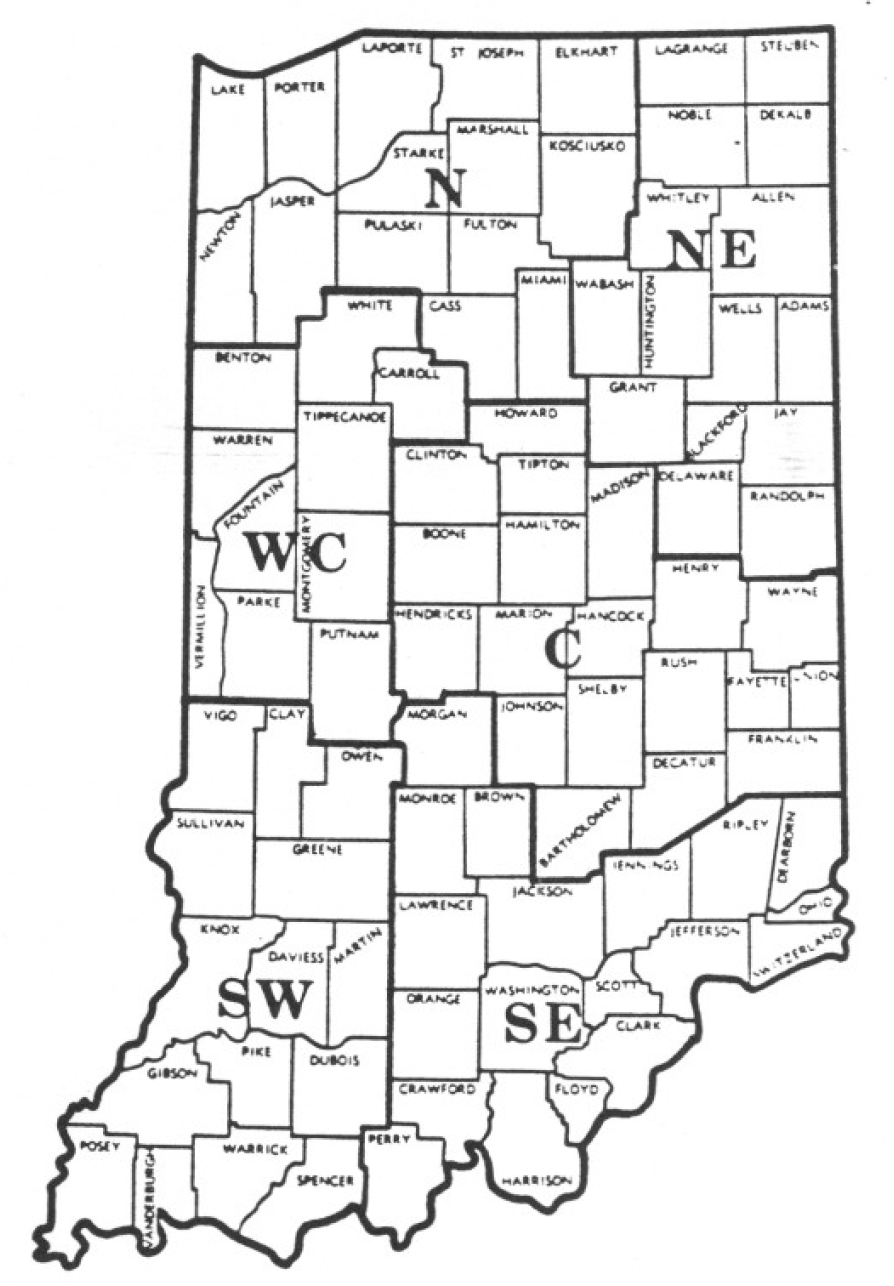
Figure I. Geographic areas used in the 1984 land value survey, Purdue University, July 1984.
Stock and commodity traders sometimes use the term “up-tick” to describe a small price increase. Rather than a turnaround in land values the first half of last year there was what might be termed a “P1K-tick” which withered along with the corn as the hot, dry summer progressed.
The annual Purdue land values survey shows that land values in Indiana declined slightly during the first half of 1984 and were lower in June than a year earlier.
Statewide Averages
The survey indicated that the value of average land in Indiana declined 1.8% in the 6 months ending in June (Table 1). The decline for top land was 1.2% and for poor land, 3.8%. The estimated value of top land was $1,876 per acre, and average land was $1,451. Estimated long run corn yields were 134 and 109 bushels per acre for top and average land, respectively.
Of the nearly 300 persons who responded to the survey 42% indicated that land values had declined during the 6-month period ending in June; about one-third felt values bad been stable, and 21% thought they had increased (Table 2).
For the year ending in June 1984, the Purdue Survey indicated that average land declined by 8% while top quality land was off less (5.7%) and poor land dropped more (9.8%) (Table 3). The USDA reported that Indiana farm land was off only 1% in the year ending in April. Part of the greater decline reported in the Purdue survey likely is because of the difference in reporting periods. Land values were rising slightly the first half of 1983 and were declining this year. Another probable reason for the differing results is the thin market and variability in prices for similar land. As one respondent wrote, “The market is all over the place. Good land will bring $2,000 to $2,500 when there are few parcels for sale. In other cases, there seems to be no buyer at all.” In such a market, it is not surprising that results of two different surveys differ somewhat. Note, however, that both surveys indicate declines in land values over the past year.
Year-to-year changes in Indiana land values as reported in the Purdue survey and by the USDA also have differed somewhat in previous years. In 1976 and 1977, the Purdue survey showed substantially larger increases than reported by the USDA. On the other hand, greater increases were reported by the USDA in 1979 and 1980. The Purdue survey showed larger decreases than the USDA in 1982, 1983, and 1984. In general, from 1974 to 1981. the Purdue survey showed land moving up faster and to a higher level than indicated by the USDA. From the peak in 1981, Purdue figures have shown larger decreases than the USDA. In spite of these year-to-year differences, the change from 1974 to 1984 recorded by the two surveys were identical. Thus, the USDA index in 1984 and the 1984 Purdue estimate of the value of average quality bare tillable land were both 2.4 times the 1974 levels.
The decline in land values from the peak in mid- 1981 has been 31% for average land, 30% for top land, and 33% for poor land. The purchasing power or real value of land has dropped even more because of inflation since 1981. Some landowners who borrowed heavily to buy land in 1979 through 1981 have lost most, or in some cases, all of their equity.
The value of top land per bushel of estimated long run corn yield was $14 in 1984. For average land the figure was $13.31 and for poor land, $12.12 (Table 4). In previous years we have suggested that the differences between land classes in per bushel land values were so small as to indicate that higher quality land is the better buy. These differences widened this year, reflecting the greater declines in the value of lower quality land.
Cash rents were down slightly in 1984-about 2% on average land. a little more on poor land. and slightly less on top land (Table 5). Rent for top land averaged $120 per acre. This land was estimated to yield 134 bushels of com per acre, thus the rent per bushel was 90 cents. Rent per bushel on poor land (85-bushel yield estimate) was only 8 cents less, indicating better rental values on higher quality land. Because land values dropped more than cash rents, the gross rent percentage return to average land rose from 6.2% in 1983 to 6.5% this year.
The question is often asked. “Why haven’t cash rents dropped as much as land values?” The answer is that land prices have been pushed down by factors other than the somewhat lower operating returns to land-high interest rates, less demand for land as an inflation hedge, and a change from land boom expectations to fears of stable or lower prices.
The value of land moving into nonfarm uses was estimated to be $2,749 per acre in June, up slightly from last December (Table 1) and up about 2% from a year earlier.
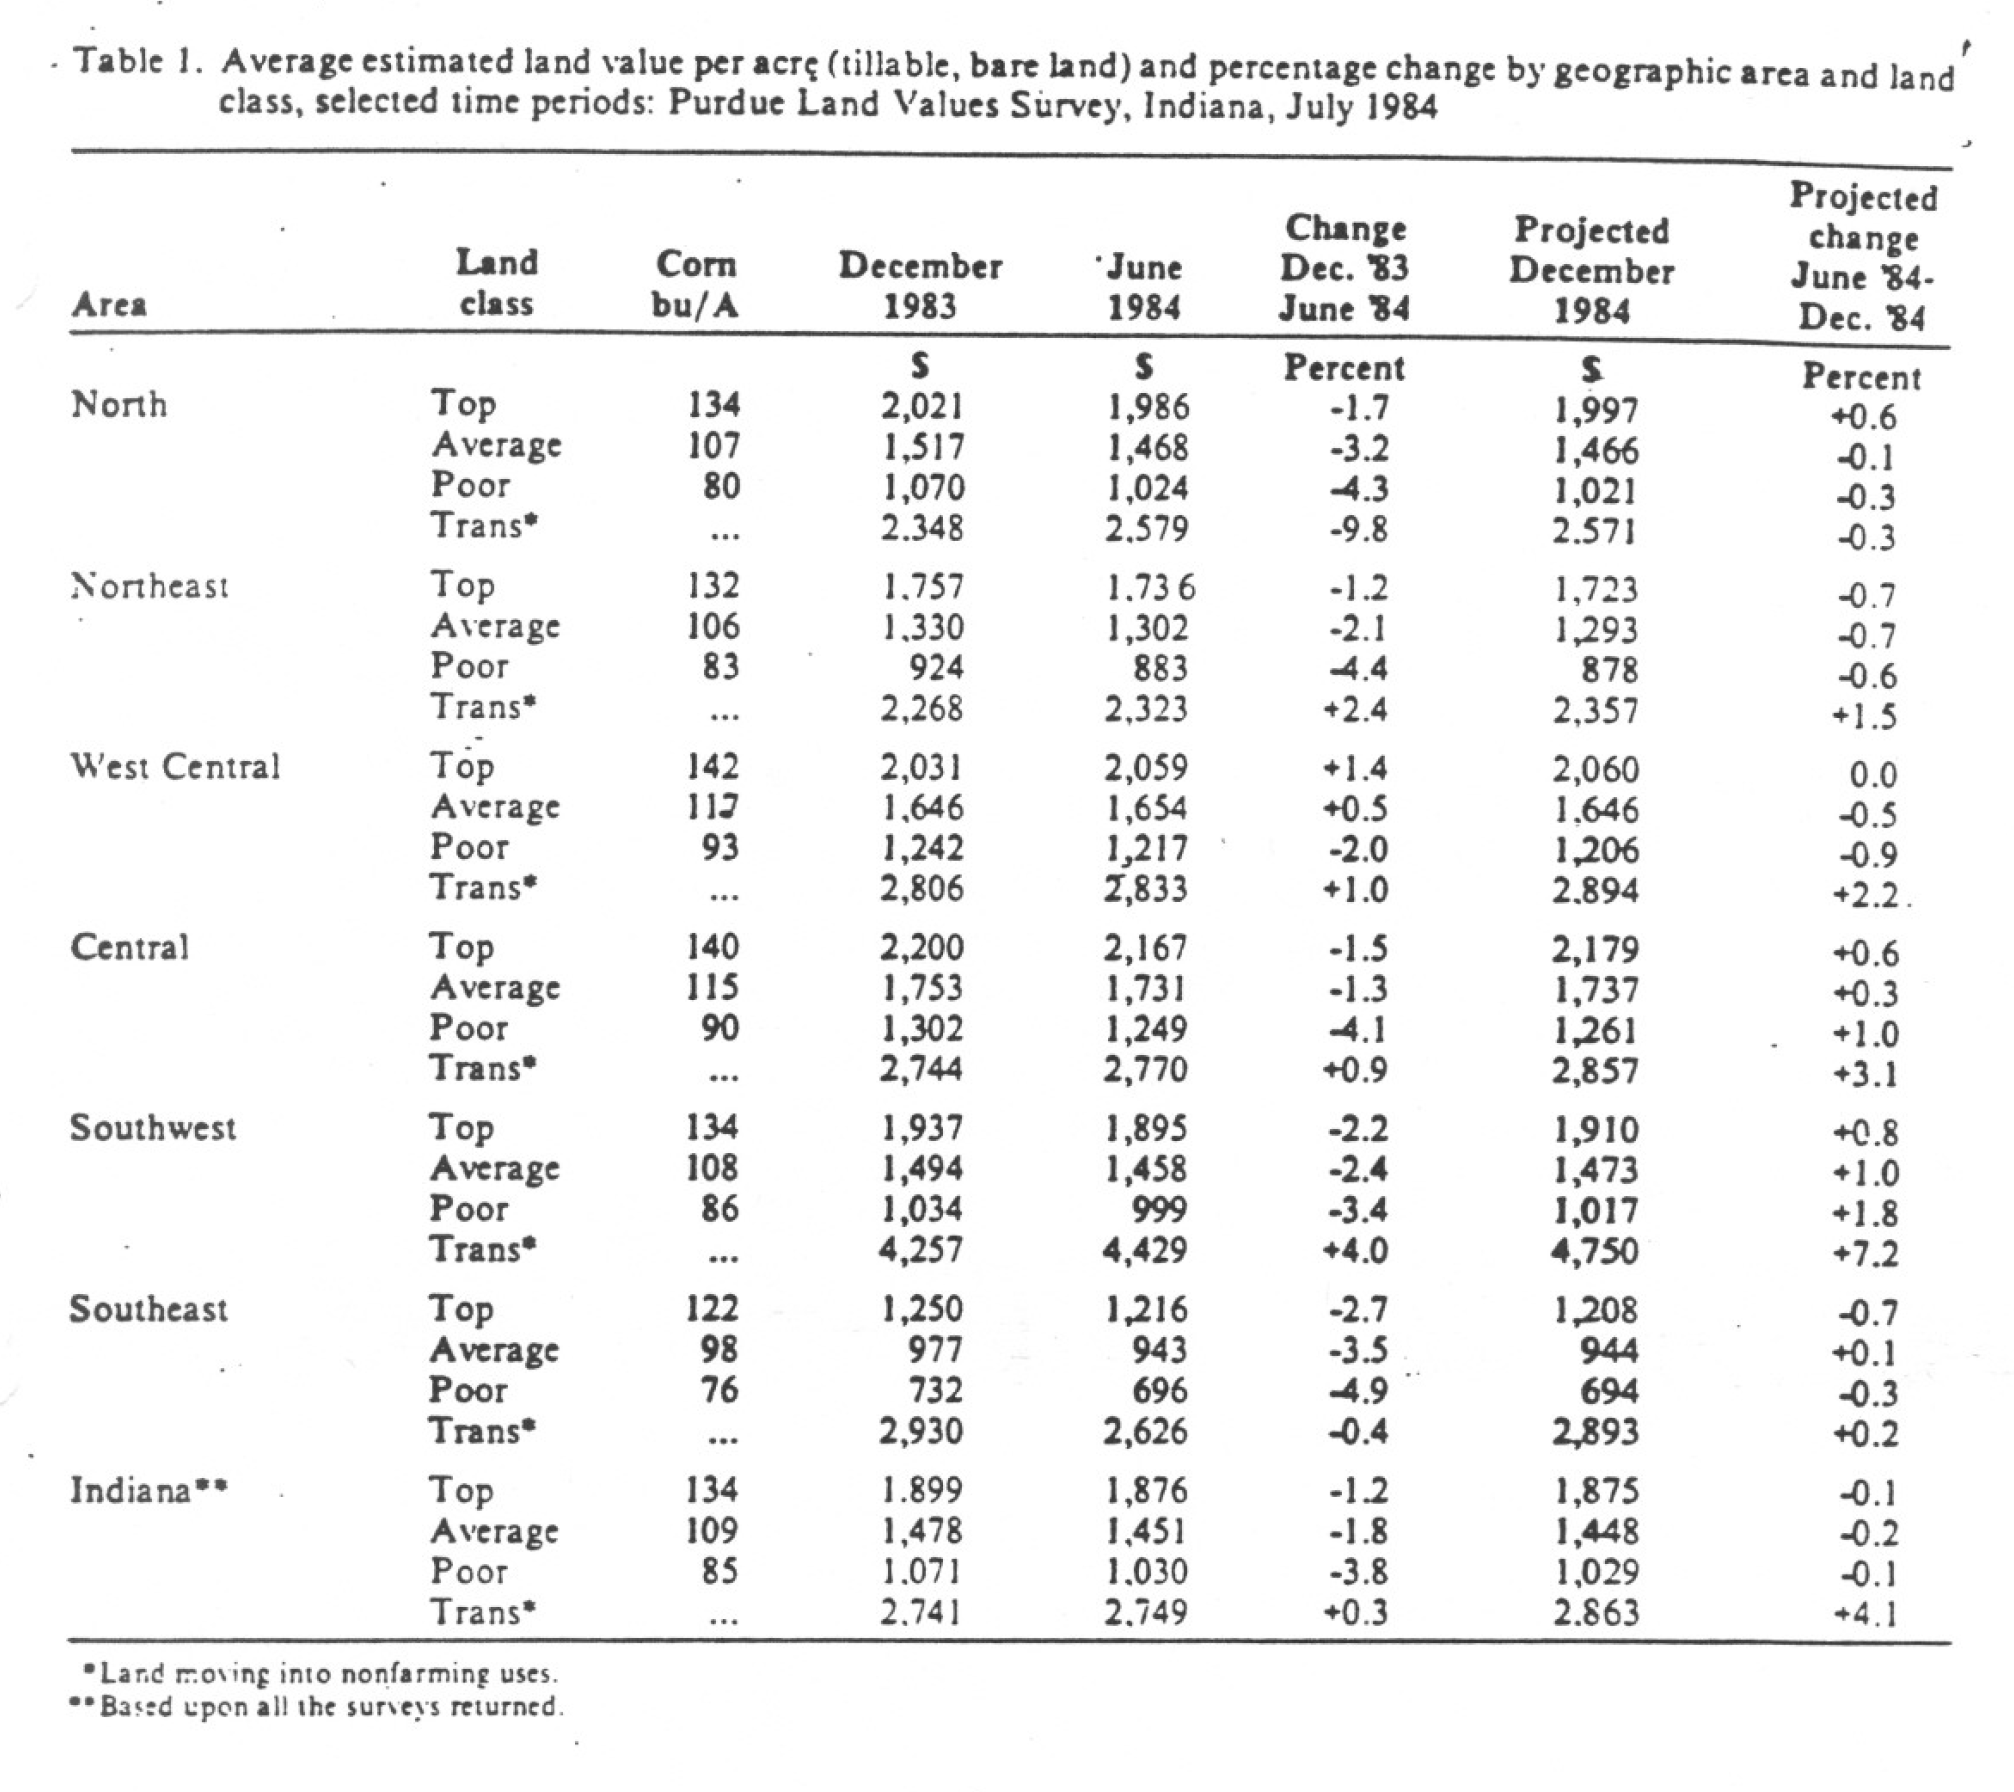
Table 1. Average estimated land value per acre (tillable, bare land) and percentage change by geographic area and land class, selected time periods; Purdue Land Survey, Indiana, July 1984
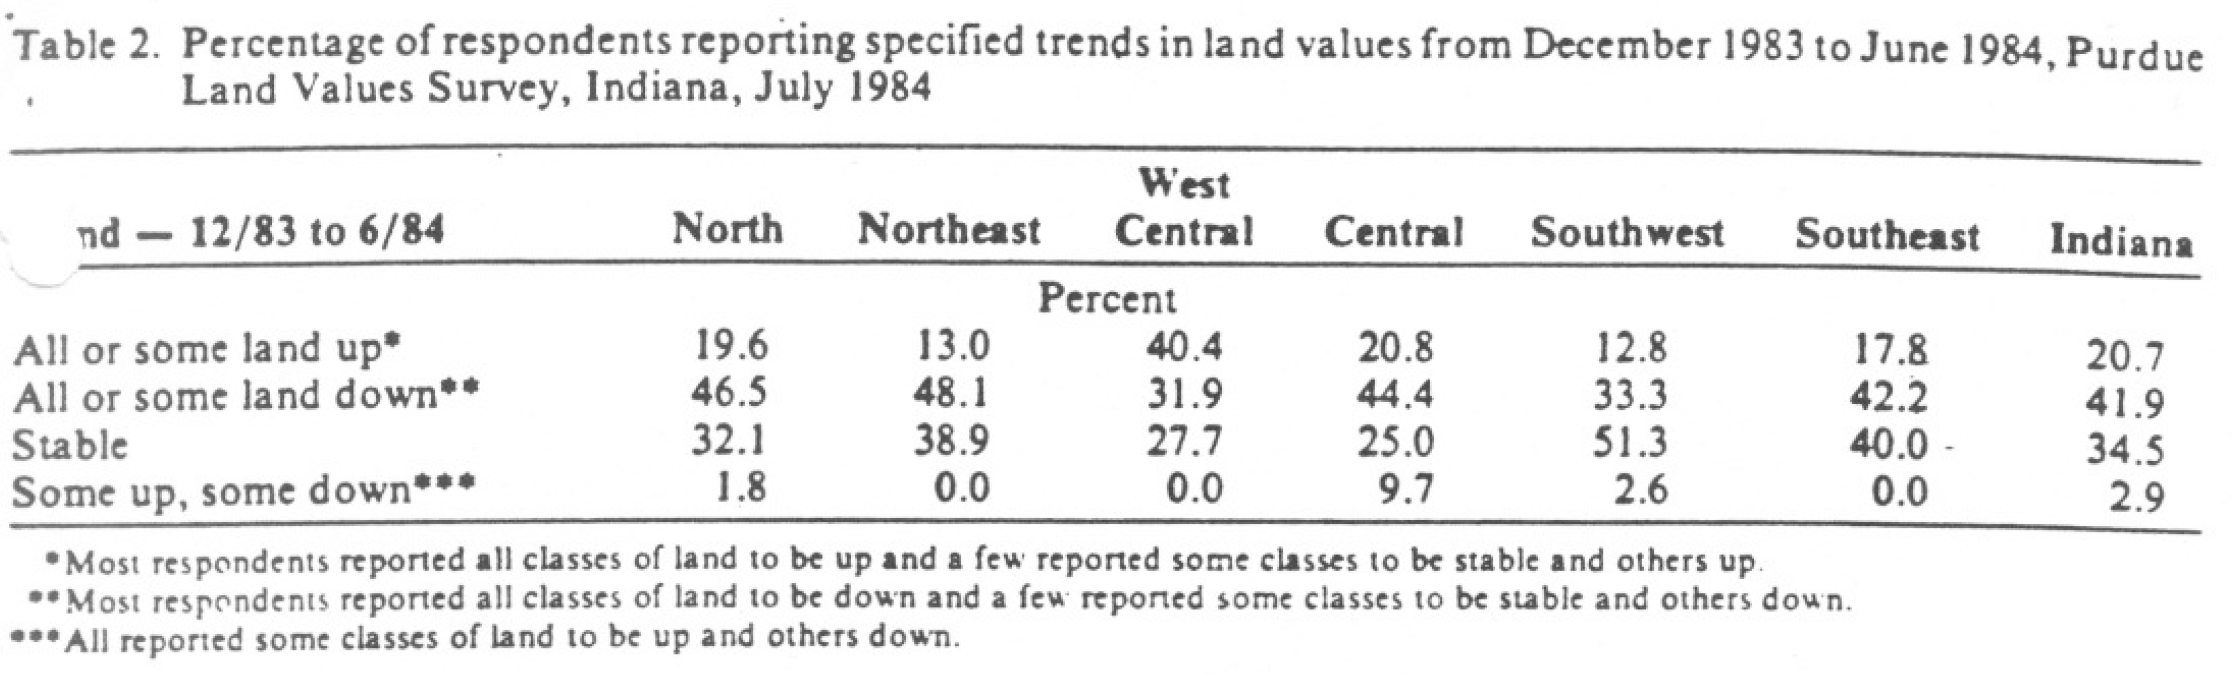
Table 2. Percentage of respondents reporting specified trends in land values from December 1983 to June 1984, Purdue Land Values Survey, Indiana, July 1984
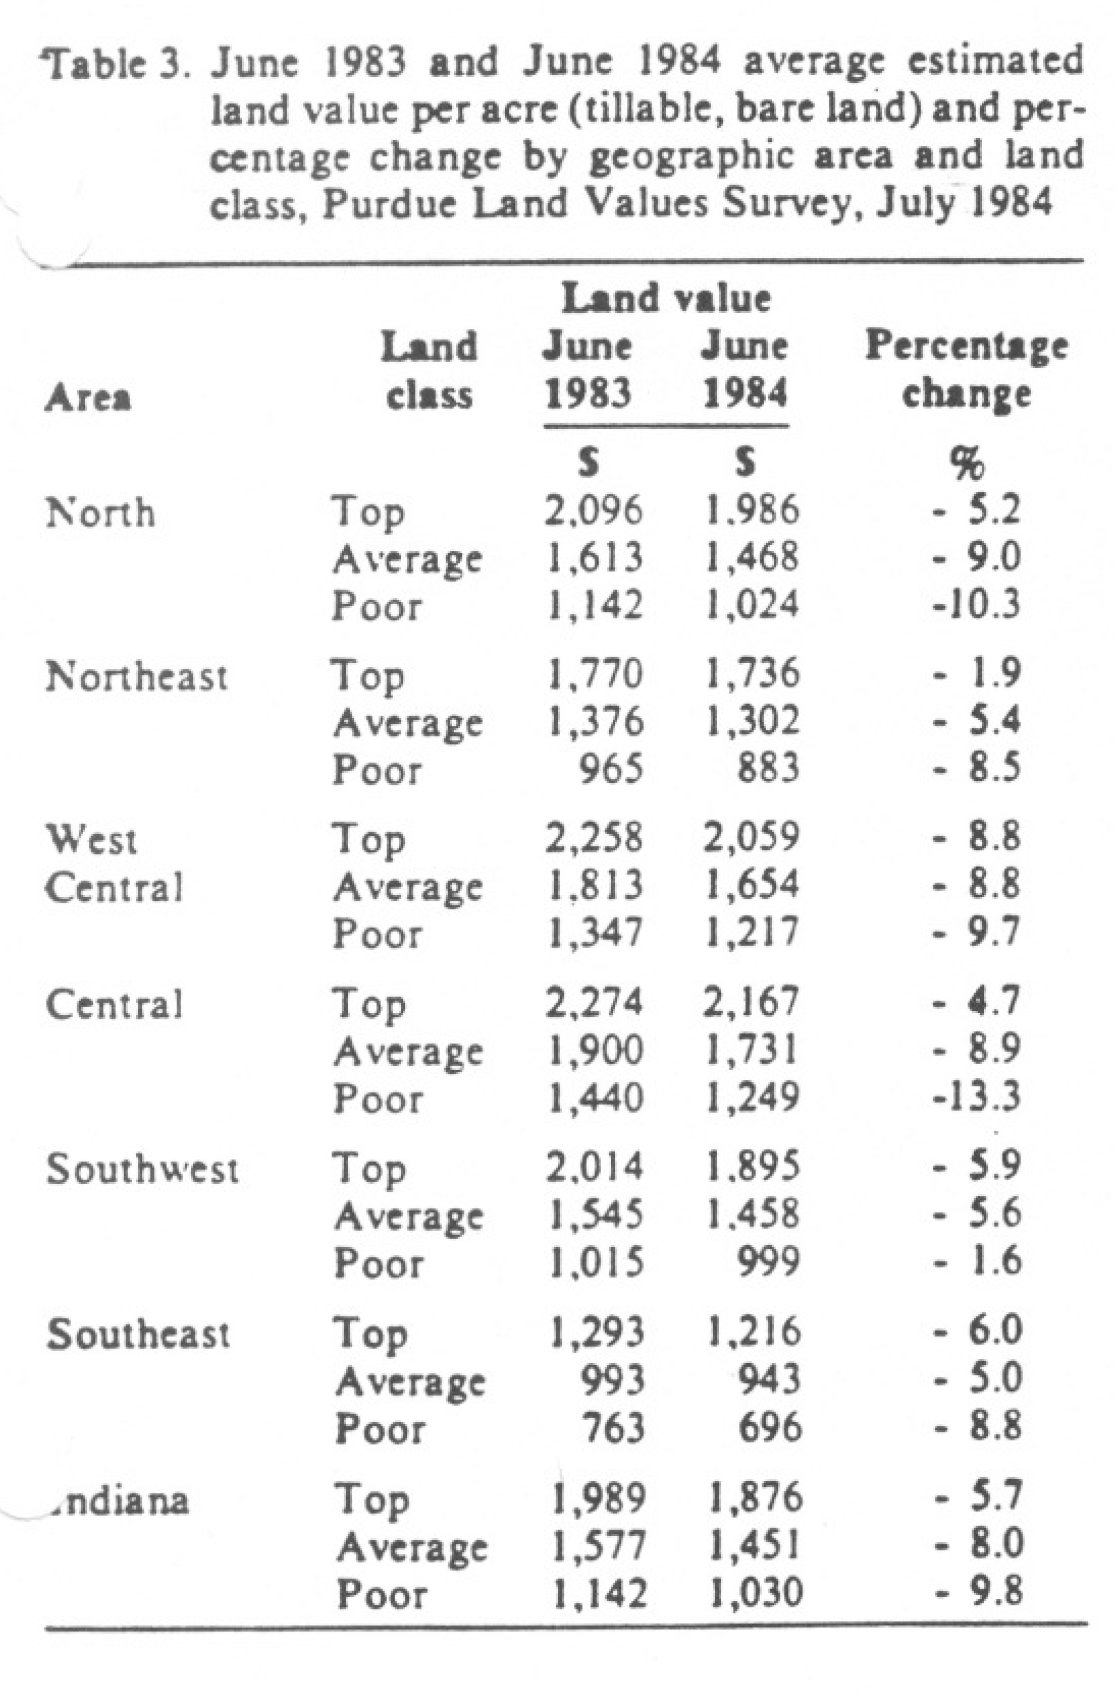
Table 3. June 1983 and June 1984 average estimated land value per acre (tillable, bare land) and percentage change by geographic area and land class, Purdue Land Values Survey, July 1984
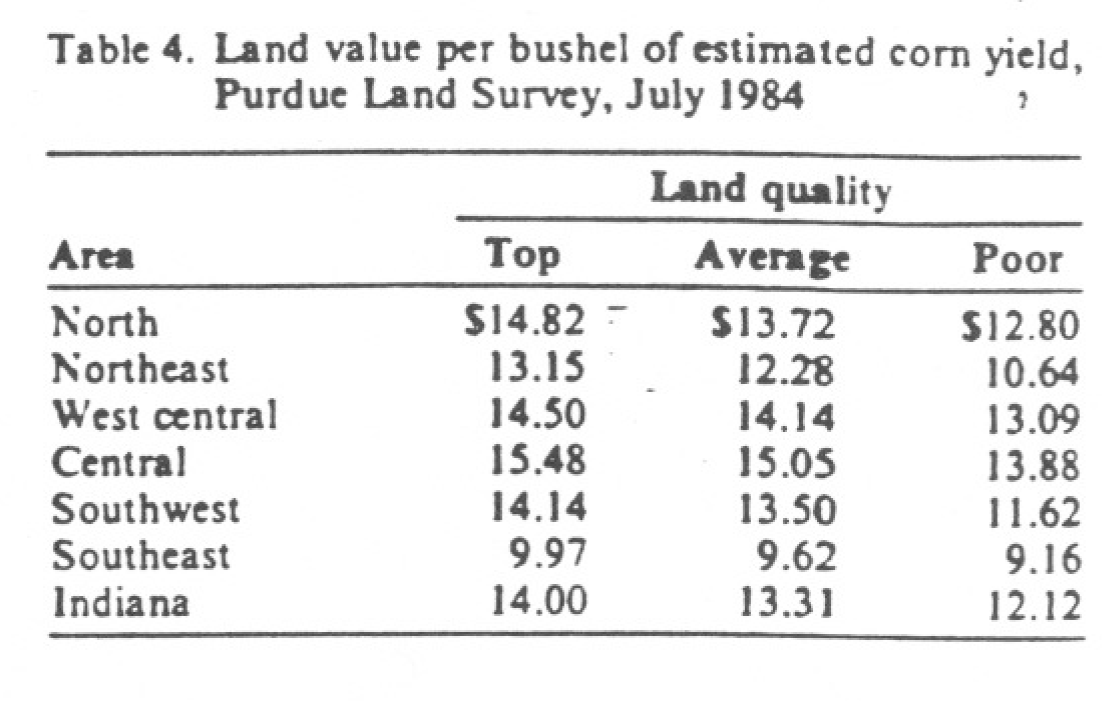
Table4. Land value per bushel of estimated com yield,Purdue Land Values Survey, July 1984
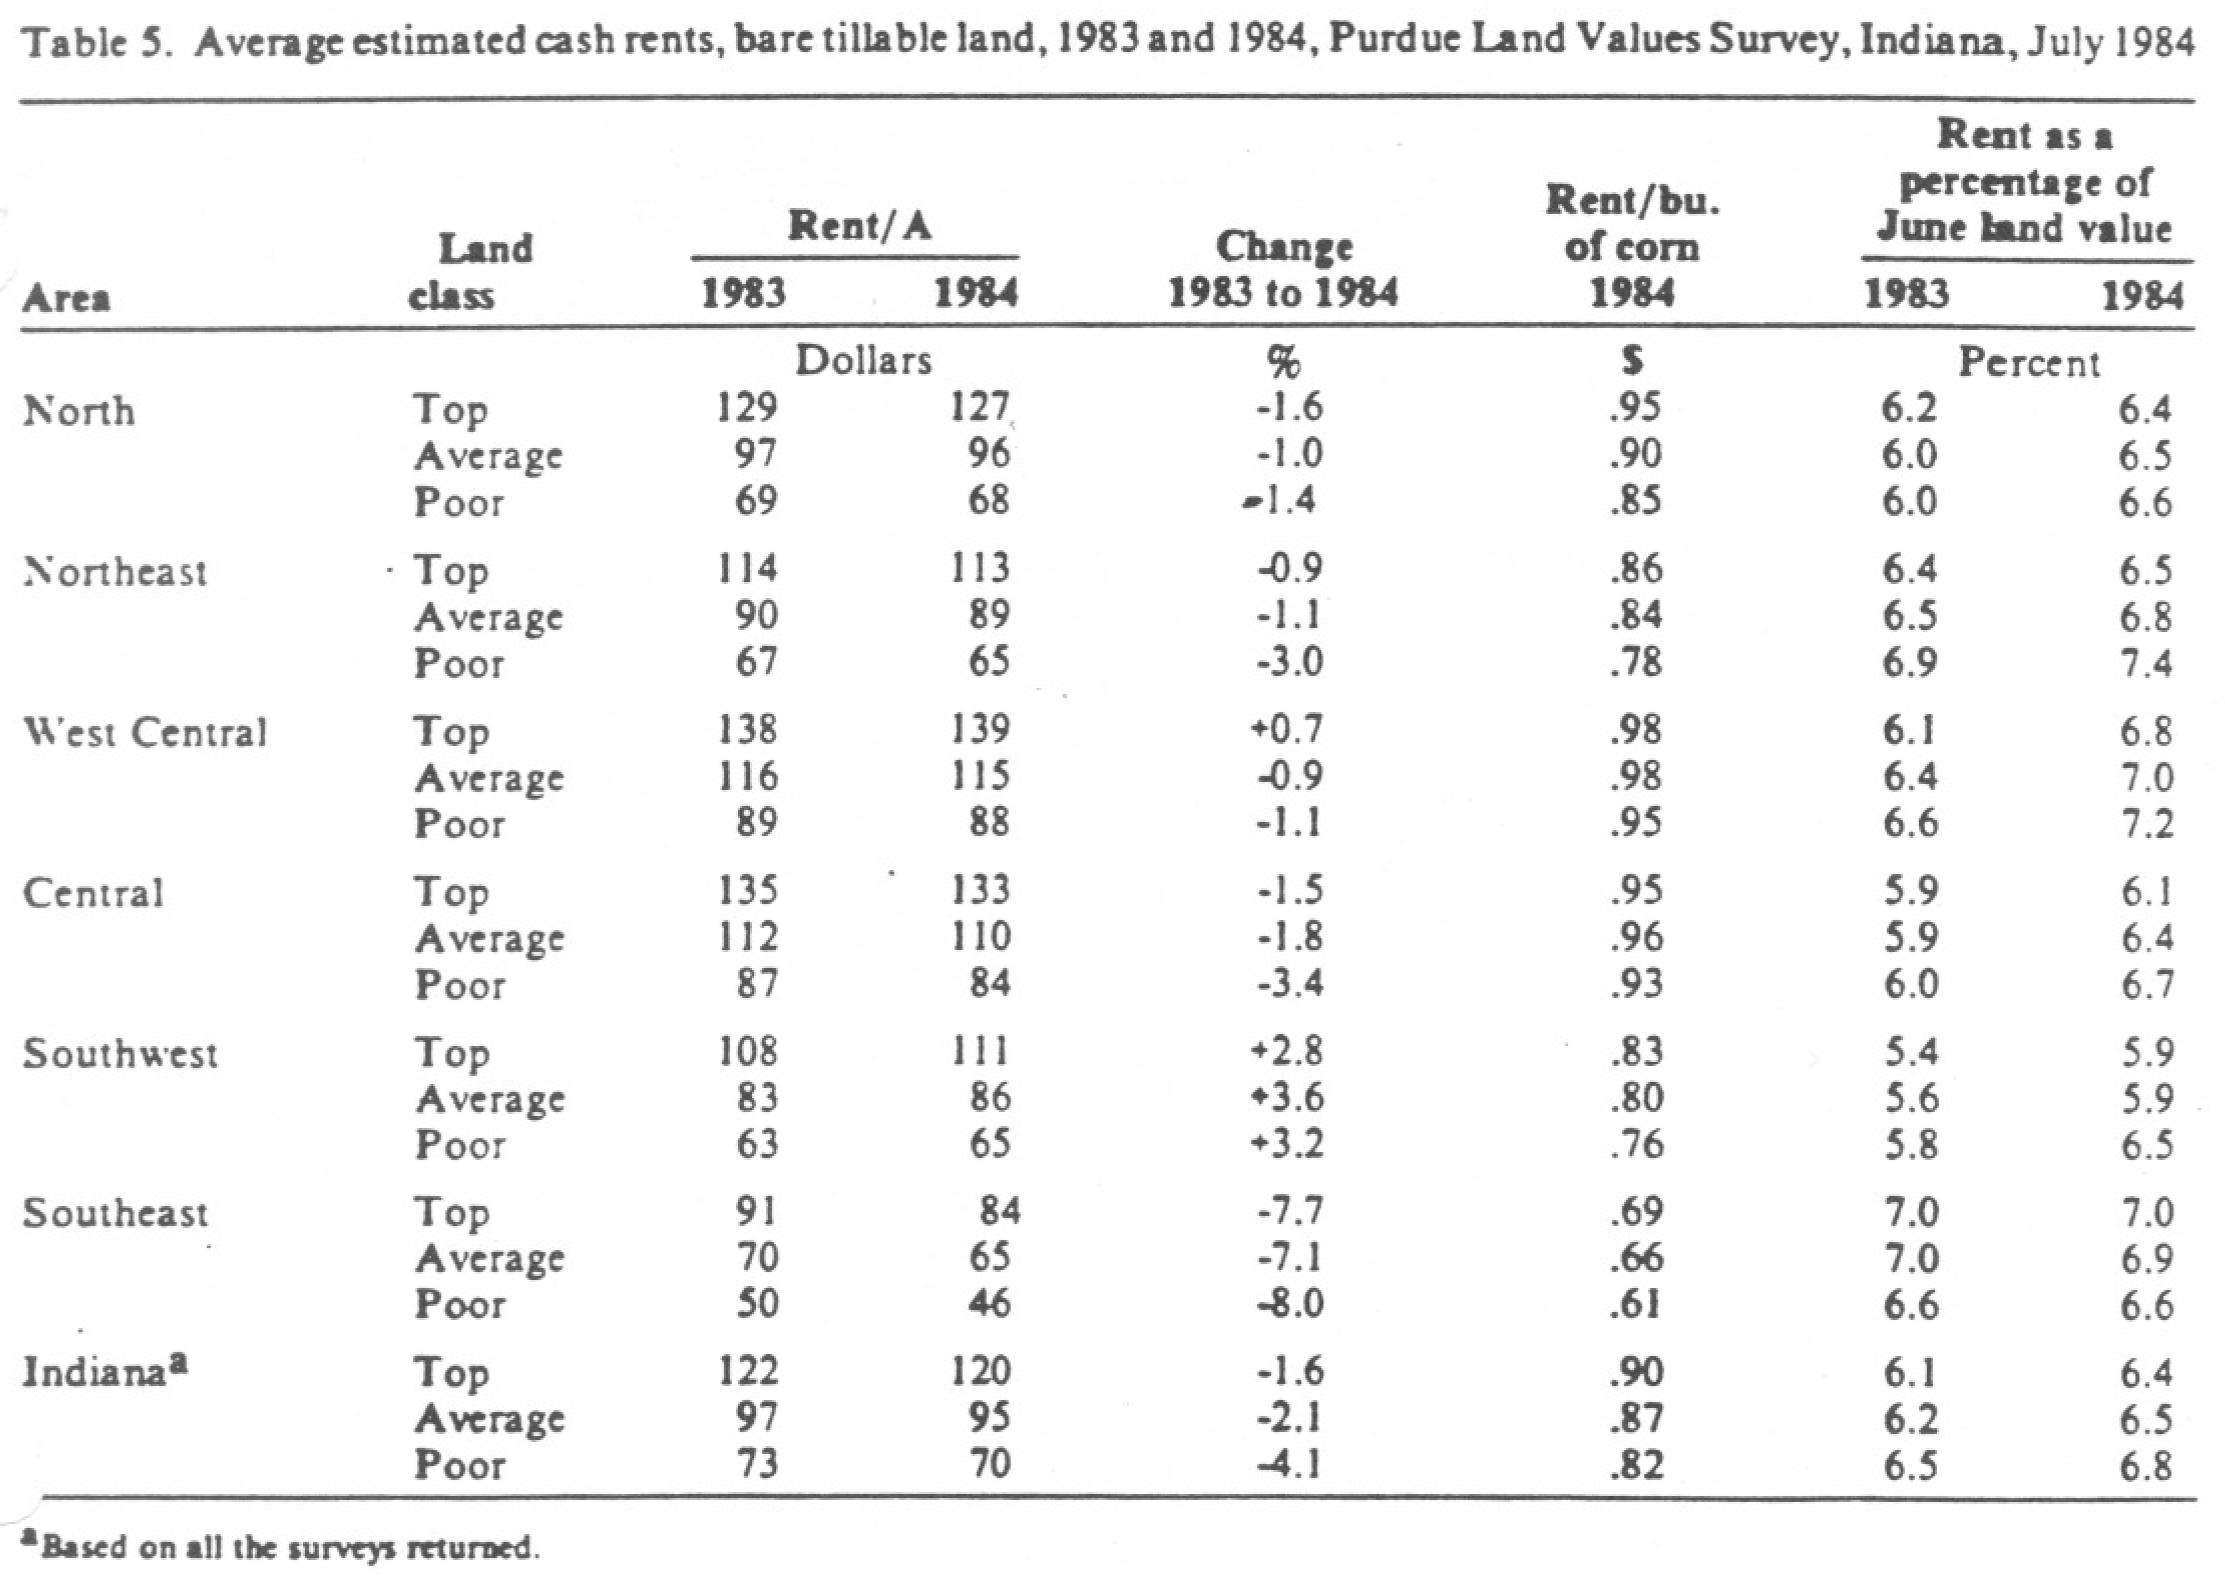
Table 5. Average estimated cash rents, bare tillable land, 1983 and 1984, Purdue Land Values Survey, Indiana, July 1984
Averages by Regions
In the west central region (Figure 1) top and aver- age land values were reported to be up a few doUars per acre from last December to June 1984 (Table 1). All other classes of farm land in all other regions showed declines in estimated values. Top and average land declines generally were 1% to 3% and declines in poor land fell mostly in a range of 2% to 4%. As land quality decreased, price declines increased.
The relative strength of land values in the west central region is also reflected in Table 2. Forty percent of the survey respondents from that area indicated that December to June land values had increased. In other areas, this percentage ranged from 13% to 21%. Only in the southwest was there a majority opinion on the direction of land values – 51% indicated that values had remained stable. In areas other than the west central and southwest. The largest percentage of respondents. though not a majority, indicated that land values had declined in the 6 months ending in June.
The highest average value, $2.167 per acre, was for top land (140 bu. corn yield estimate) in the central region with similar quality land in the west central area having an estimate of 52.059 per acre. Top land in the north, northeast, and southwest was estimated to have long run yields of 132 to 134 bushels of corn per acre and had an average value of $1.986 in the north. $1.895 in the southwest, and $1.736 in the northeast.
June 1984 land values per bushel of corn yield potential declined as land quality declined. but in several cases. the difference between top and average land was less than SO cents. On top land these per bushel figures range from about 510 to more than 515. Part of the difference between regions probably is because of field size and shape. workability of soils, weed problems. proportion of nontillale to tillable land, markets, roads, etc. Thus, it is difficult to generalize that land in one area with a cost of S10 per bushel is a better buy than in another area with a cost of $13 per bushel.
Declines in land values from June ’83 to June ’84 varied by regions and by land quality within regions (Table 3). Except in the southwest. There was a tendency for lower quality land to show greater declines. Poor land in the other areas declined from 9% to 13%. But top quality land showed declines ranging from only 2% in the northeast to 9% in the west central area.
Cash rents decreased slightly from 1983 to 1984 in all regions except the southwest and for top land in the west central area (Table 5). The declines were 7% to 8% in the southeast but only 1% to 3% in most other regions. Rent per bushel of estimated corn yield on top and average land ranged from 90 cents to 98 cents in the north, west central, and central regions; 80 cents to 86 cents in the northeast and southwest; and 66 cents to 69 cents in the southeast. There was
virtually no difference in rent per bushel between top and average land in the west central and central areas. Again suggesting that the better value may be in renting top land.
Rent as a percentage of land value increased slightly from last ~’ear in all areas except the southwest. These estimates generally fell in the narrow range of 6% to 7%. There was a tendency for rent as a percentage of land values to increase as land quality decreased, except in the southeast.
What of the Future?
About 52% of the survey respndents expect land prices to be stable the later half of this year. The remainder is almost equally divided between those who expect declines and those who expect increases.
In terms of their predictions of dollar values, declines (statewide) of only $1 to $3 are expected (Table 1). Only in the central and southwest areas are slight increases expected in all classes of land. In the other areas slight declines are generally expected.
Looking at the longer run. 78% of the respondents expect land prices to be higher 5 years from now, but by only 11% – a compound annual rate of under 2% per year. Over this same 5-year period, they expect inflation to average 6.5%. Should this occur, the real value or purchasing power of land would decline.
Respondents were also asked what they thought would be the annual average price over the next 5 years for corn and soybeans and their estimate of firm mortgage interest rates. The averages of their responses were:
corn price $3.13
bean price $7.35
interest rate 13.3%
The estimate for com is about the same as last year but the bean price is 49 cents per bushel higher, putting it more in line with the long term relationship between corn and bean prices. Their interest rate estimate is nearly a percentage point higher than last year.
None of these estimates should be viewed as predictions. But they do reflect the mood of the land market – one of very cautious optimism. In this market setting, the volume of sales is low, wide variations may be noted for land of similar quality, sales are poorly attended, and there is often bargaining over terms.
It is also important to recognize that averages do not tell the whole story. In answering the question of where land values would be in 5 years, about 26% of the responses were in the range of 20% to 50% increase. About an equal number fell in the range of plus 4% to minus 20%.
The current farming situation calls for caution in making major investments like the purchase of land. Interest rates are high. We have a huge surplus of wheat. Burdensome supplies of soybeans and corn could build up within a year or so. Grain exports have been disappointing. Financial stress is being fell by a greater than average number of farmers. Changes could occur in some of these factors and give a boost to farm earnings and land prices. But in such uncertain times, good management dictates that financing be arranged to withstand periods of temporarily depressed farm earnings.
This survey was made possible by the cooperation of professional managers, appraisers, brokers. bankers, and persons representing Production Credit Associations, the Federal Land Bank, the Farmers-Home Administration, and insurance companies. Their daily work makes them the experts on land values and cash rents in Indiana. To these friends of
Purdue and Indiana agriculture, sincere thanks are expressed. They provided more than 300 responses representing all but one of Indiana’s counties. Appreciation is also expressed to Kim Cook of the Agricultural Economics Department for his help in compiling the data.
![]()
![]()
![]()
![]()
![]()
