1990 Indiana Farm Finance Survey
September 16, 1990
PAER-1990-9
Authors: Freddie L. Barnard, Associate Professor; W.D. Dobson, Professor; and Jeurene Falck, Computer Systems Manager
![]()
![]()
![]()
![]()
![]()
The Indiana Farm Finance Survey for 1990 indicates the financial condition of many Hoosier farmers improved from 1989 to 1990, causing many farm financial indicators to return to levels recorded just prior to the 1988 drought. In particular, the delinquency rate for real estate loans, debtasset ratios, percentages of respondents with debt-asset ratios exceeding 40 and 70 percent, percentage of respondents unable to get loan funds, and the percentage of debt held by respondents who were technically insolvent all fell to levels equal to or slightly lower than those recorded for 1988. The delinquency rate for nonreal estate loans and the percentage of respondents turned down when applying for a loan were higher in 1990 than in 1988, but much lower than in 1986. Farmers have continued to reduce total debt and adopt management practices which increase their efficiency. Also, farmers’ purchases of machinery have recovered substantially from the depressed levels of the mid-1980s.
Indiana Farm Finance Surveys were conducted in March May 1985, March-June 1986, March-June 1988, and April June 1990, by the Departments of Agricultural Economics and Agricultural Statistics at Purdue University. An abbreviated survey of a smaller sample was conducted in February-March 1989. This article reports on the 1990 survey, compares the 1990 results to the findings for 1988 and to selected findings for 1986 and 1989, describes the financial strength of Indiana farmers following the 1988 drought period, and draws inferences regarding the capacity of farmers to adjust successfully to financial problems that may occur in the future.
*Financing for this study was provided in part by the Mid-Size Family Farms Project of the Purdue Agricultural Experiment Station. Thanks are extended to the farmers who completed the questionnaires and to Ralph W. Gann, head of the Department of Agricultural Statistics at Purdue University for helpful suggestions regarding design of the questionnaire and for supervising the collection of the survey information. Helpful comments on the manuscript by Professors Julian 11. Atkinson and David C. Petritz are acknowledged.
Procedure
In April 1990, a farm finance questionnaire was sent to about 5,000 Indiana farmers by the Department of Agricultural Statistics at Purdue University. Approximately 1,000 farmers who had responded to the 1988 farm finance questionnaire were included in the sample, together with a random sample of an additional 4,000 farmers. Approximately four weeks after the initial mailing, a reminder questionnaire was mailed to farmers who had not yet responded to the mail questionnaire. (See Authors’ note) The number of questionnaires containing completely usable or partially usable responses was 2,169 for a response rate of 43 percent. However, as noted in the summary tables, the number of usable responses varied substantially from question to question.
Results are reported as statewide averages for Indiana, and regionally for the northern, central, and southern regions of the state. The regions represent the Indiana statistical reporting districts and are noted on the map in Figure 1.
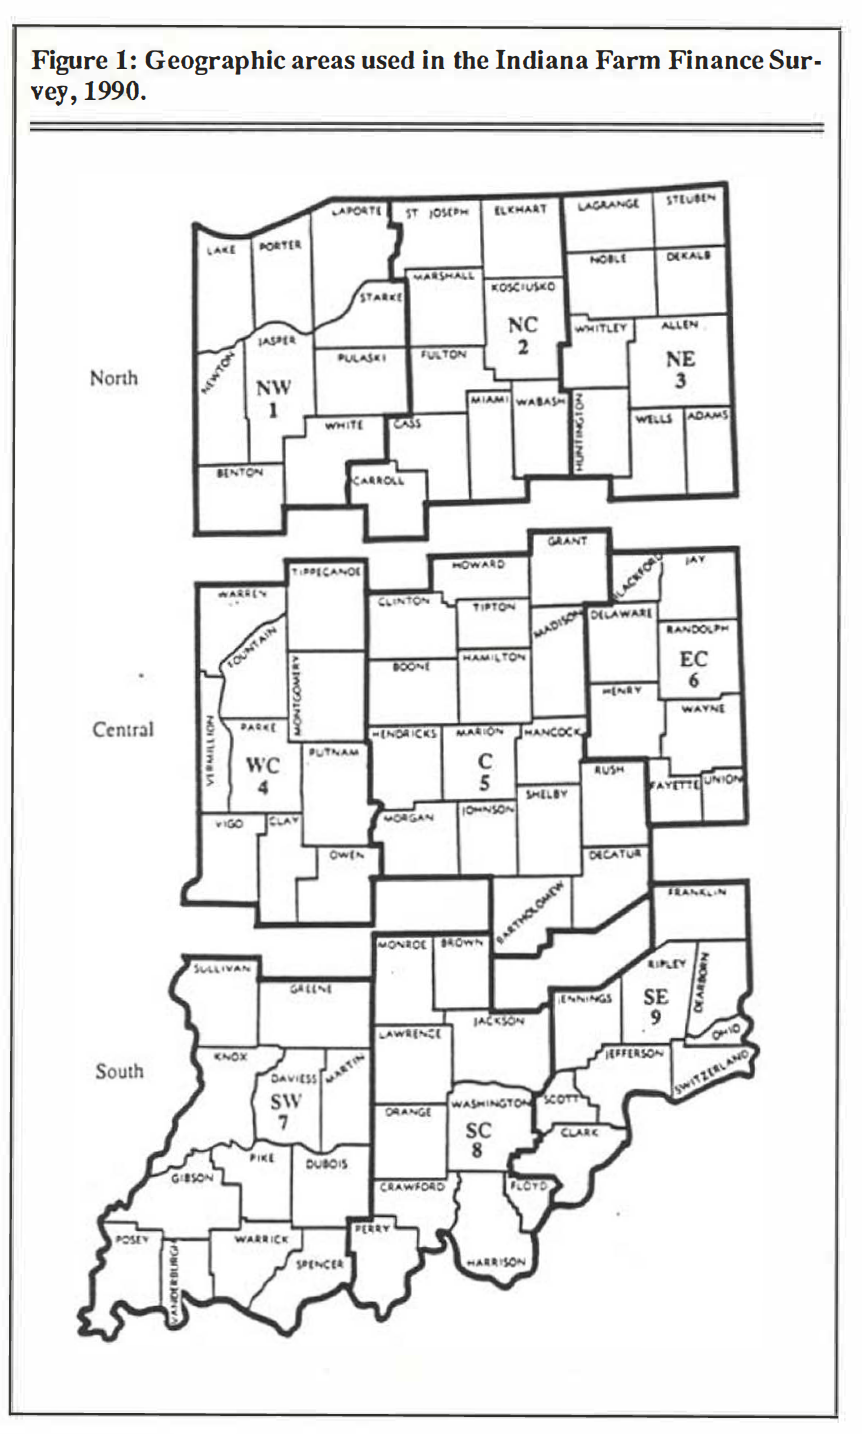
Figure 1: Geographic areas used in the Indiana Farm Finance Survey, 1990.
Characteristics of Respondents
Respondents averaged 52 years of age and had 26 years of experience as a farm operator. The number of acres operated by respondents in 1990 was greater than in 1988. The number of acres operated by respondents in the central region was about 122 acres greater than the number operated by those in the southern region (Table 1).
Livestock enterprises provided a smaller percentage of farm income to respondents than crops. Seventy-one percent obtained half or less of their gross farm income from livestock or livestock products, and twenty-nine percent of the farmers obtained more than half of their gross farm income from livestock enterprises. Thirty-eight percent of the respondents reported no livestock income.
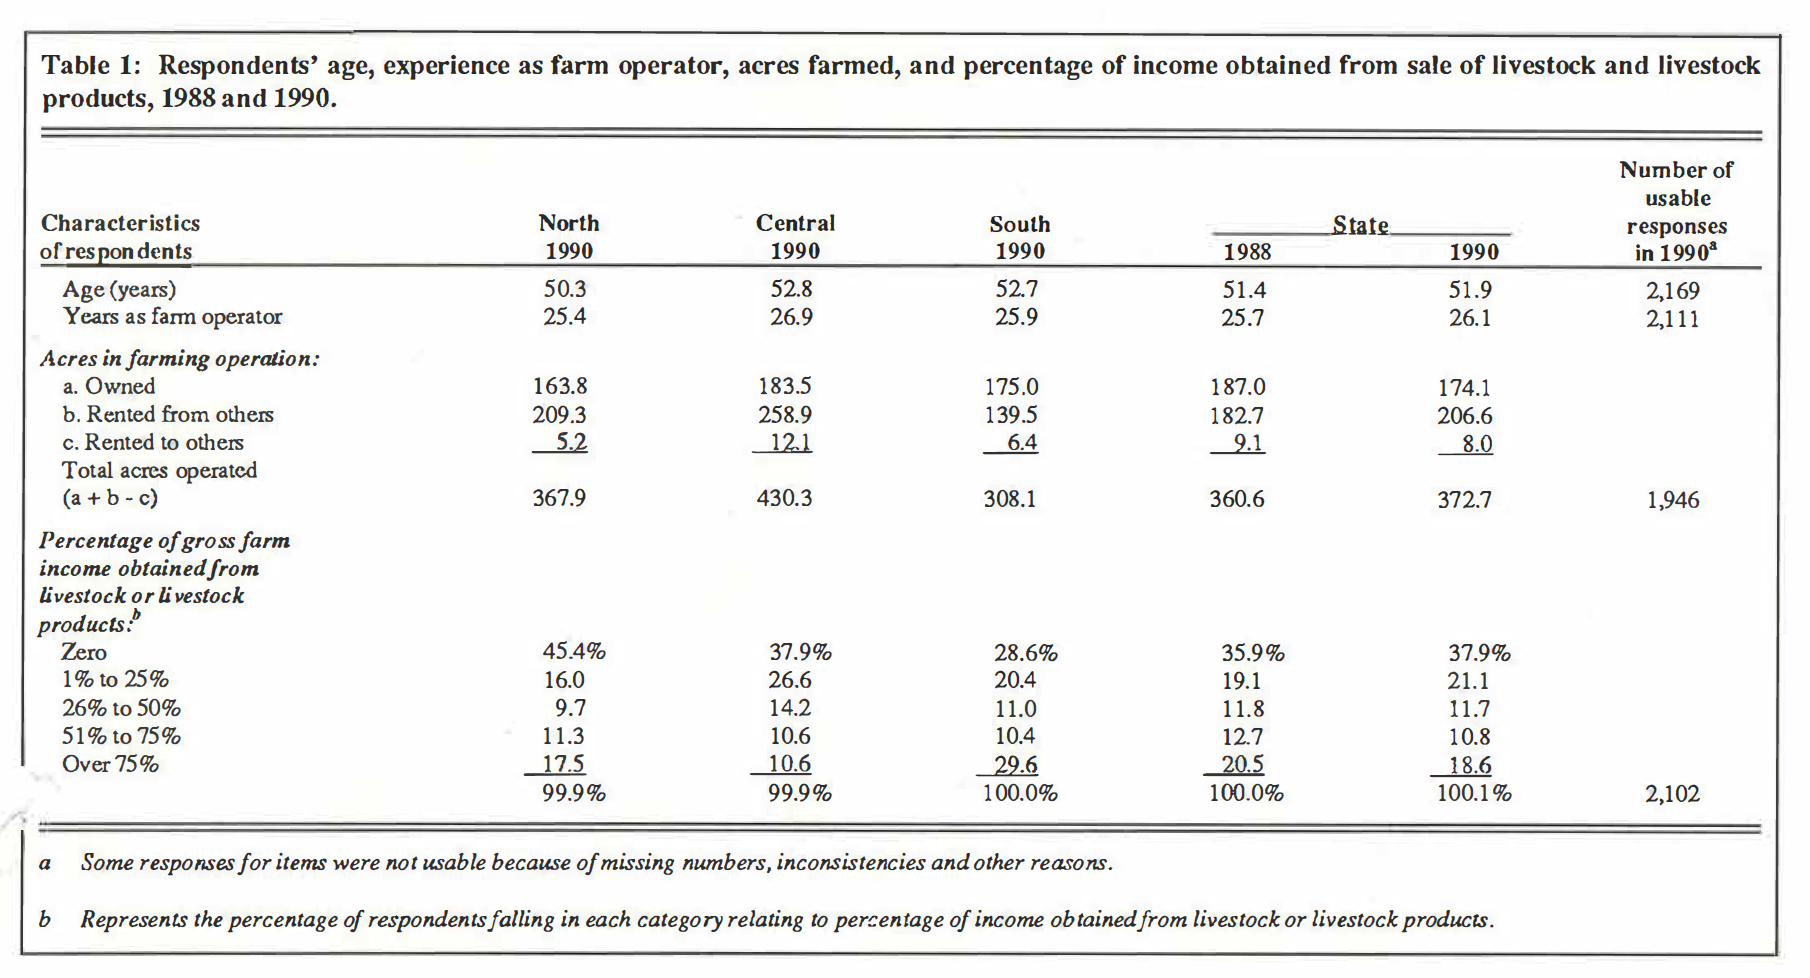
Table 1: Respondents’ age, experience as farm operator, acres farmed, and percentage of income obtained from sale of livestock and livestock products, 1988 and 1990.
Financial Condition of Indiana Farmers
Gross and Net Farm Income. Gross farm income is the income generated by a farm before expenses are subtracted. In the 1990 survey, income figures are for calendar year 1989. An arbitrary cutoff point sometimes used for differentiating between part-time and full-time farms is $100,000 of gross farm income. If the $100,000 cutoff point is used, about 28 percent of the respondents would have represented full-time farms and 72 percent part-time farms in 1989 (Table 2). The comparable figures for 1987 regarding full-time and part-time farmers were 30 percent and 70 percent, respectively. In southern Indiana only 19 percent of the respondents had 1989 gross farm incomes greater than $100,000, while 32 percent and 31 percent fell into that category in central and northern Indiana, respectively.
These figures indicate that there are many operators of smaller, part-time farms in Indiana of whom many obtain large percentages of their income from nonfarm sources. Because the financial problems on part-time farms may differ from those on full-time farms, certain statistics will be presented separately in the article for farmers with gross incomes of less than $100,000 per year and for farmers with gross incomes exceeding this total.
Net cash farm income was defined as total cash receipts minus total cash operating expenses. Net farm income was defined as net cash farm income minus depreciation.
Net farm income is commonly defined as the return to unpaid operator and family labor, management, and equity capital. Viewed another way, net farm income plus depreciation allowances represents the amount of money available to repay the principal on intermediate and long-term debt, purchase capital assets, pay family living expenses, pay income taxes, and retain as a financial reserve in the farming operation.
About 17 percent of the respondents reported net cash farm incomes for 1989 in the loss category; about 25 percent of the respondents reported net farm incomes falling in the loss category (Table 2). The 25 percent figure is about the same as reported for 1987, a very profitable year for many Hoosier farmers. The percentage of respondents reporting net losses in 1989 was largest in southern Indiana.
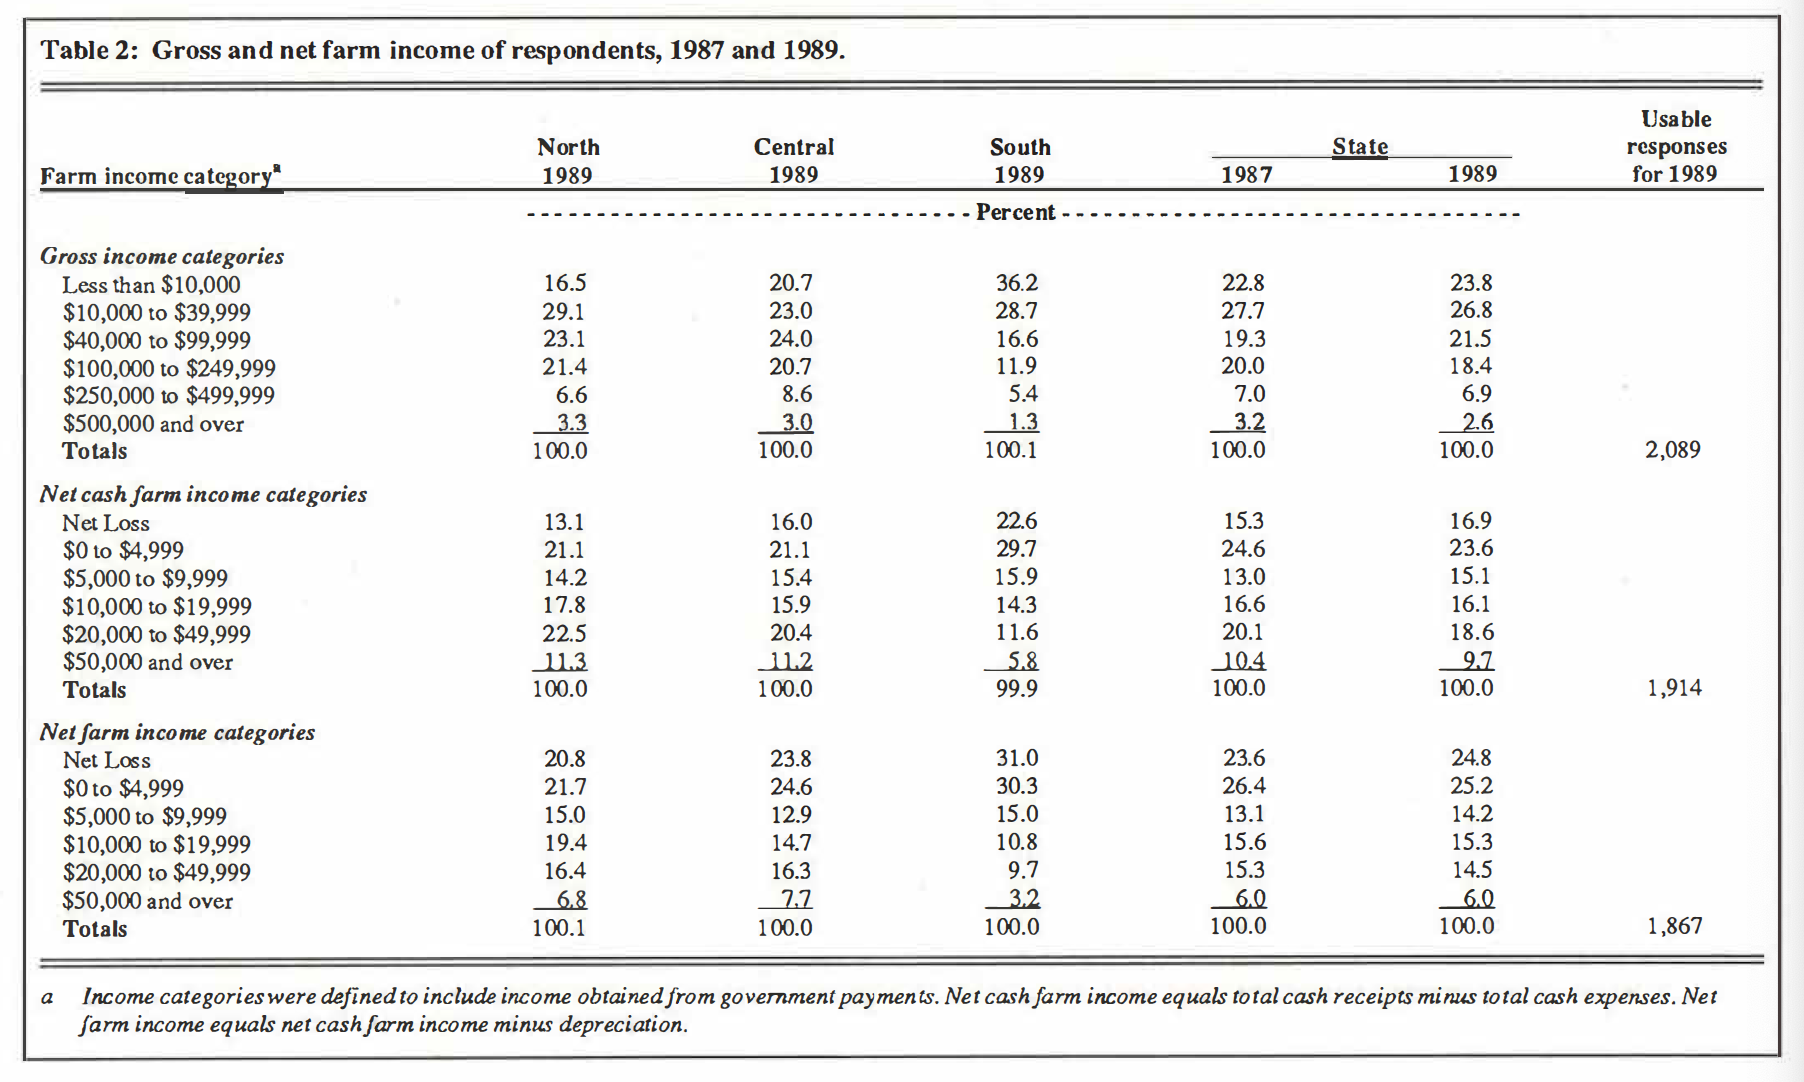
Table 2: Gross and net farm income of respondents, 1987 and 1989.
About 79 percent of the respondents had net farm incomes of less than $20,000 in 1989, equal to the comparable number for 1987. The percentage of respondents reporting net farm incomes of less than $20,000 has declined from 85 percent in 1985 to 79 percent in 1989.
Many Indiana farmers supplement farm income with income from nonfarm sources, which can reduce the problems created by low net farm incomes. Nonfarm income was defined to include the earnings of the farmer and spouse from off-farm jobs, earnings from sales of goods and services (e.g., seed com, welding services, baked goods, sewing, etc.) and earnings from nonfarm investments.
The average nonfarm income was about $26,000 but varied by reporting district. The lowest average nonfarm income figure ($17,820) among the Indiana statistical reporting districts was in the northwestern district (Table 3). The central and southern parts of this district consist of predominantly rural counties. Moreover, farmers tend not to commute long distances to off-farm work; respondents to a 1987 nonfarm income survey for Indiana commuted an average of only 14.5 miles (one-way) to off-farm jobs [1]. The northwestern district also includes many operators of large commercial farms who tend to obtain smaller incomes from off-farm sources.
Larger nonfarm incomes obtained by respondents in the central, south central and southeastern agricultural statistics districts probably reflect the close proximity of those districts to the job markets of Indianapolis; Louisville, Kentucky; and Cincinnati, Ohio, respectively.
Nonfarm income of the farmers with less than $100,000 of gross sales exceeded that for the larger farmers (Table 3). This pattern probably reflects the heavy demands placed on the operators of larger farmers for on-farm work, the smaller number of cases on larger farms where both the farmer and spouse work off the farm, incomes generated on the larger farms which lessen the need for off-farm work, and other factors.
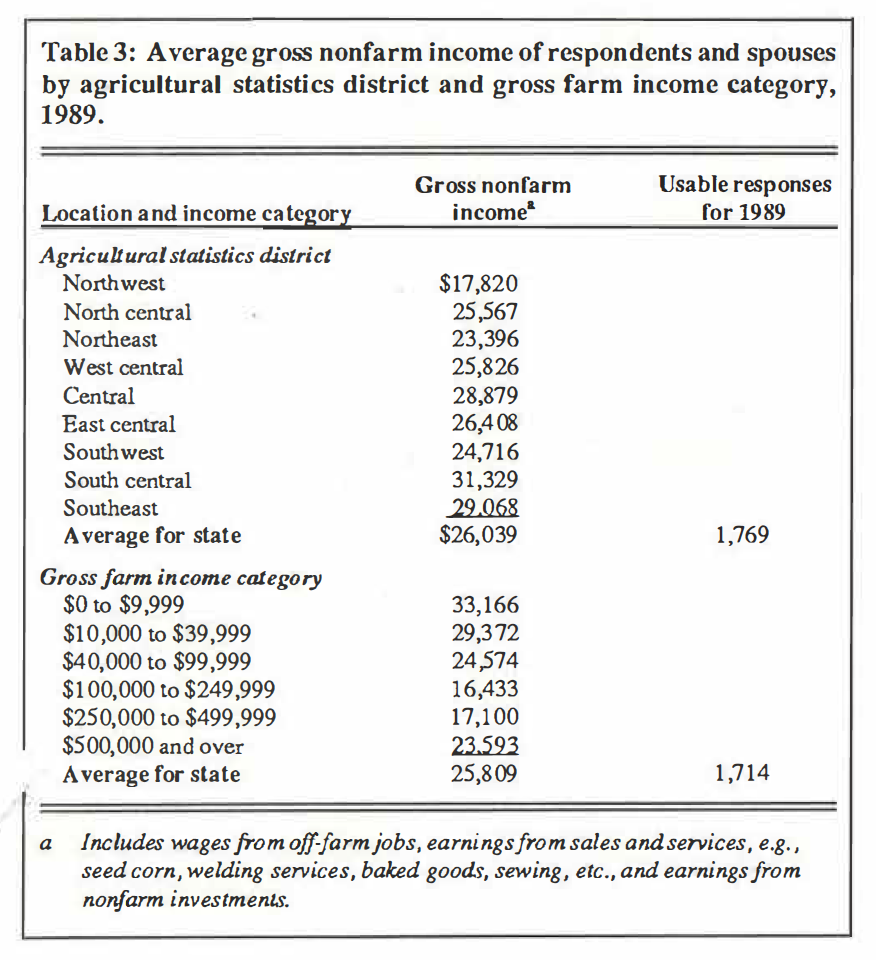
Table 3: Average gross nonfarm income of respondents and spouses by agricultural statistics district and gross farm income category, 1989.
Balance Sheet Information. A balance sheet shows assets (what is owned), liabilities (what is owed), and owner equity. Respondents provided an estimate of their nonreal estate and real estate assets and liabilities. A word of caution is that the real estate and farm machinery values which made up a large portion of each respondent’s balance sheet are subject to the possible biases of the individual respondents. No mechanism was employed to reduce these potential biases.
The average value of farm real estate assets reported by respondents as of January 1, 1990 was $256,597, ranging from $210,719 in southern Indiana to $279,165 in central Indiana (Table 4). Farm nonreal estate assets averaged $131,248 in value for the state, exhibiting their lowest value ($101,215) in southern Indiana and their highest value ($144,073) in northern Indiana.
For all respondents, the average amount of real estate debt was $60,470, ranging from $42,608 in southern Indiana to $73,128 in central Indiana. Their nonreal estate debt (state average) was $29,775, varying from $18,301 in southern Indiana to $37,813 in central Indiana. For Indiana, from 1988 to 1990 the average amount of real estate debt owed by the respondents declined by 8.6 percent, while the amount of nonreal estate debt increased by the same percentage.
Nonreal estate debt probably increased from 1988 to 1990 because of reduced advanced deficiency payments and Commodity Credit Corporation loans which increased farmers’ needs for short-term production credit during this period. Also, it probably reflects the financing of machinery purchases, which increased during the period.
Owner equity (total assets minus total liabilities) averaged $297,600 for the state. It was highest in northern Indiana ($321,489) and lowest in southern Indiana ($251,025) (Table 4). The average owner equity of respondents was 5.5 percent higher in 1990 than in 1988.
The statewide average debt-asset ratio of 24.3 percent as of January 1, 1990 (Table 4) improved modestly compared to 1988. The ratio was highest in central Indiana (26.8%) and lowest in southern Indiana (20.2%).
*A word of caution should be extended about the reliability of this ratio as an indicator of the financial condition of Indiana farmers. First, the total debt component of the ratio does not take into account how the debt is structured, which can influence the ability of a/armer lo service and repay debt. Secondly, the problems discussed earlier about how difficult it is to establish a value for farm assets should be remembered. Finally, the change in the amount of owner equity can be the result of a profit or loss in a previous year and/ or the result of an increase or decrease in the asset values. Without an income statement and the knowledge of asset values on the previous balance sheet, it is difficult to identify the reasons for the change in owner equity for an individual operation.
The percentage of all respondents carrying real estate and nonreal estate debt in 1990 and the average interest rates paid by the respondents on the debt are listed in Table 4. Note that about 39 percent of all respondents reported zero debt in 1990. About 48 percent of the respondents in southern Indiana reported they had no debt on January 1, 1990.**
** The percentage with $100,000 of gross farm income carrying zero debt in 1990 is considerably lower than the percentage of all respondents. Only about 17 percent of the full-time farmers reported zero debt in 1990.
Nearly 42 percent of the respondents made principal payments on real estate loans that were in addition to scheduled payments during the past year. The comparable figure was 55 percent for nonreal estate loans.
For Indiana, respondents reported they paid interest rates on real estate and nonreal estate debt in 1990 which averaged 10.2 percent and 11.7 percent, respectively.
Harrington [2] and other authors of USDA publications have employed debt-asset ratios to describe the amount of financial stress facing farmers, as follows:
Debt-asset ratio Status of farmer
Under 40% No apparent financial problems
40-70% Serious financial problems
70-100% Extreme financial problems
Over 100% Technically insolvent
About 25 percent of those responding to the Indiana survey had debt-asset ratios exceeding 40 percent in 1990, down from the 26 percent found in 1988. Eight percent had debt-asset ratios exceeding 70 percent in 1990, the same as in 1988. The guidelines in the USDA classification suggest that about one-quarter of all Indiana respondents face serious financial problems, extreme financial problems, or technical insolvency; however, this tends to overstate the problem. For example, some skilled managers who carry a relatively small proportion of their debt in the form of land debt may be in satisfactory financial condition despite having a debt-asset ratio exceeding 40 percent. In addition, farmers’ net incomes have increased substantially since 1985 and may increase again in 1990. This means more farmers now have sufficient income to service 40 percent or more debt. Additional analyses involving subsets of respondents and cross-tabulations are presented later in the article to assess more fully the meaning of the debt-asset ratio figures.
Thirty-three percent of respondents reporting gross farm incomes of $100,000 or more had debt-asset ratios exceeding 40 percent in 1990, which is essentially equal to the 34 percent in 1988. About 9.8 percent had debt-asset ratios exceeding 70 percent in 1990, down from the 12.6 percent in 1989 and about the same as in 1988.
Delinquency Rates. A second measure of financial condition is the rate of delinquency of loan payments. Those respondents having real estate loans (49.4% of all respondents) were asked if their principal and interest payments were current. For those respondents, 4.9 percent said “no” (Table4). This is more than one percentage point lower than the 6.1 percent reported in 1988. This figure, which is nearly four percentage points lower than the percentage reported for 1985 and 1986, underscores the improvement that has occurred in farm real estate lending. Also, about 41 percent of those who were delinquent on their real estate loans were current on the interest payments and delinquent only on principal payments. The same question was asked about nonreal estate loans. About 7.9 percent of the respondents having nonreal estate loans indicated that their principal and interest payments were not current (Table 4), which is 2.2 percentage points higher than the figure reported in 1988. Comparable figures for 1985 and 1986 were 22 and 14 percent, respectively.
Loan Requests Rejected. A third indicator of the financial condition of farmers is the percentage of loan applications turned down. Respondents were asked if they were turned down for a 1990 farm loan and, if so, why the loan request was rejected. Only results for respondents who actually applied for a loan were considered. Of the 457 respondents indicating they applied for a loan about 11.6 percent indicated they were turned down, which is up from 7.9 percent in 1988 (Table 4), but down considerably from the more than 16 percent reported in 1986.
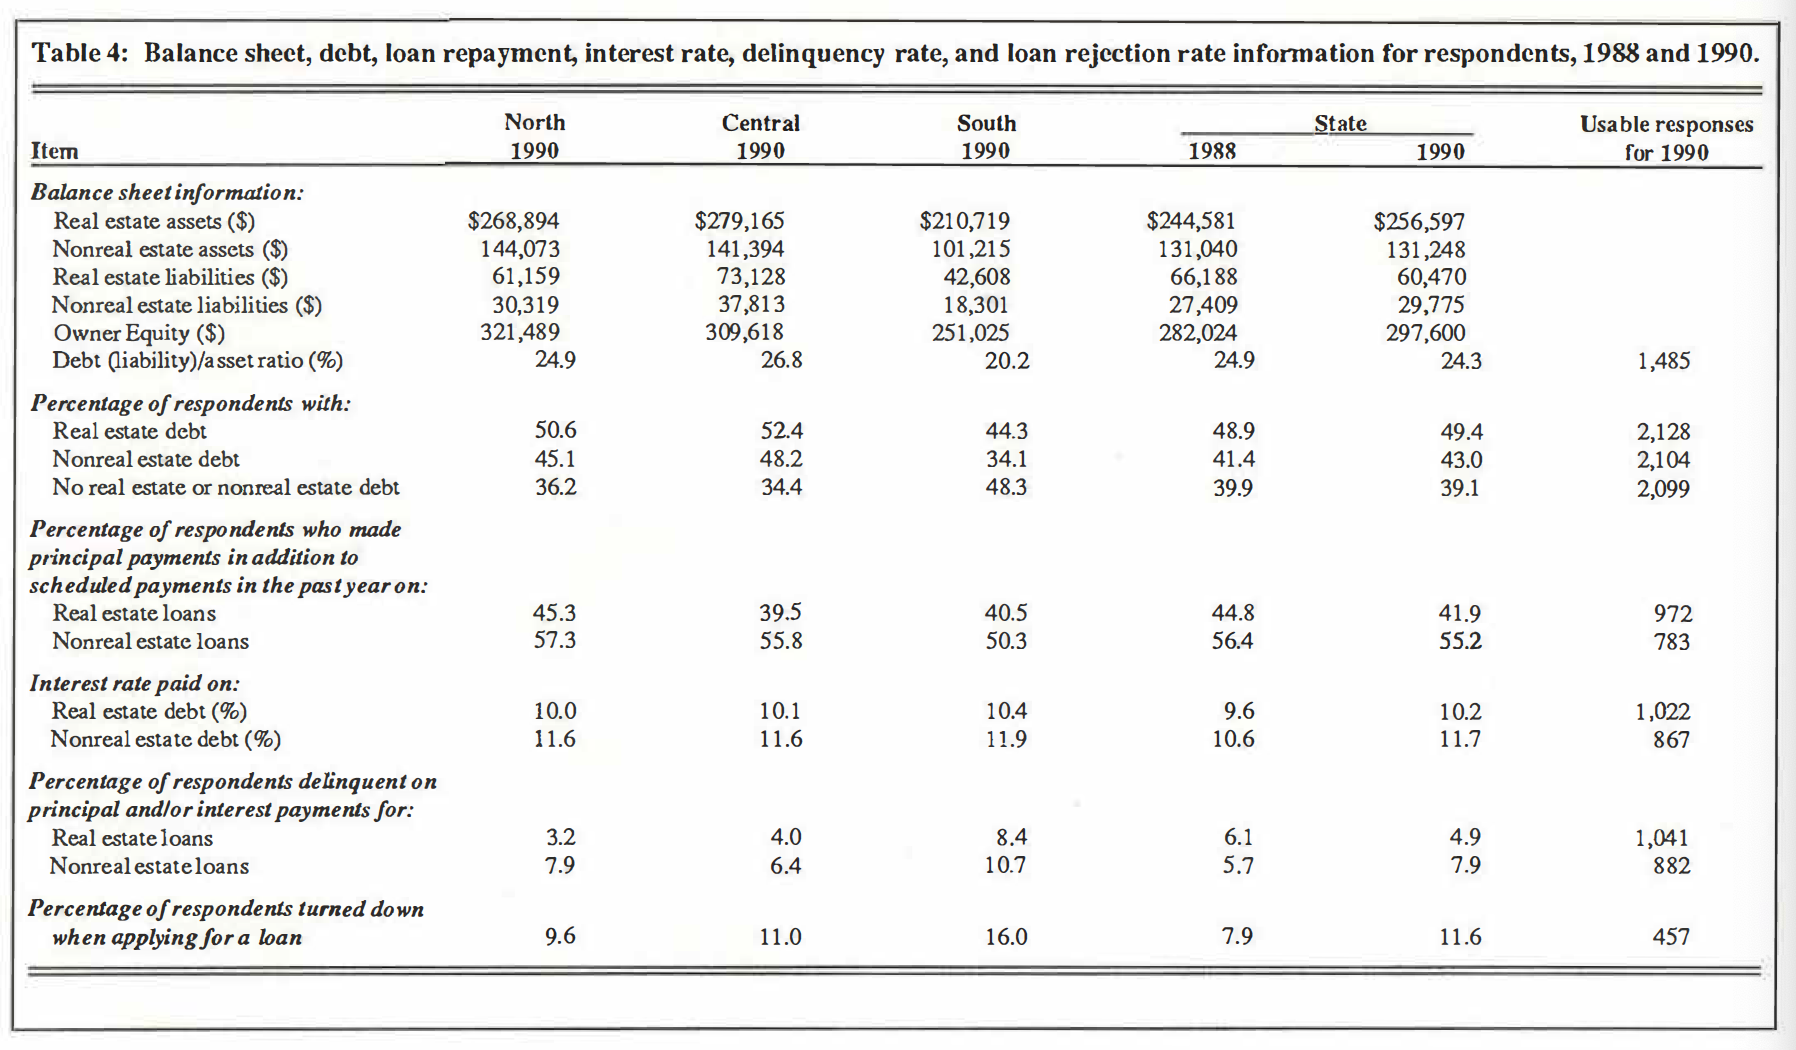
Table 4: Balance sheet, debt, loan repayment, interest rate, delinquency rate, and loan rejection rate information for respondents, 1988 and 1990.
The reasons their loan applications were rejected are ranked in order of frequency of mention, and appear in the following schedule:
Reason loan request was rejected Percentage of total reasons
Low farm income 29%
Insufficient equity 21
Lender not interested in making agricultural loans 16
Previous loan repayment problems 14
Other 20
TOTAL 100%
The percentage of respondents who indicated they were turned down because the lender is not interested in making agricultural loans, 16 percent, is two percentage points lower than the percentage found in 1988, 18 percent.
Respondents whose loan requests were rejected were asked if they eventually obtained loan funds for the 1990 crop year. Seventy-one percent of these respondents said “yes”. Thus, about three percent of those who applied for loans for the 1990 crop year (15 of 457) were unable to get loan funds, which equals the comparable figure in 1988. The sources of loan funds for the seventy-one percent who eventually received loans, ranked in order of frequency of mention, were as follows:
Source of loan funds Percentage of total sources
Lenders other than FmHA 24%
Farm suppliers 22
Relatives 18
FmHA 16
Machinery dealers 2
All other sources 18
TOTAL 100%
The 16 percent of the respondents who received loans from FmHA is down 4 percentage points from the 20 percent reported in 1988. This decline probably reflects the move by FmHA away from insured loans to guaranteed loans.
Respondents were asked to indicate how credit services (e.g., record programs, financial counseling, market information, etc.) provided by lenders have changed during the past year. One-half of the respondents indicated there had been no change in services and 41 percent indicated the question did not apply to them. Seven percent of the respondents indicated credit services have increased; whereas, only two percent indicated services decreased.
Change in credit service Percentage of respondents
No change 50%
Not Applicable 41
Increased 7
Decreased 2
TOTAL 100%
During the past 12 months, Indiana farmers have expressed concerns to the authors about the availability of loan funds and credit services. The concerns are that some lenders in Indiana have stopped making loans to farmers and this has resulted in a shortage of loan funds for farmers. No evidence was found in this study to support the claim there is a shortage of loan funds or a decrease in credit services to farmers.
Additional Information on the Incidence of Farm Financial Stress
Debt-Asset Ratios by Farm Size. Table 5 shows the percentage of all farmers and the percentage of farmers with gross incomes exceeding $100,000 per year that fell in the different debt-asset ratio categories in 1990. About onefourth of all respondents had debt-asset ratios of 40 percent or more compared to one-third of those with gross incomes over $100,000. The percentage of respondents in this higher debt category declined about one percentage point for all farmers as well as for those with higher gross incomes (Table 5).
Amount of Debt Owed by Respondents in Different Debt-Asset and Gross Farm Income Categories. Debt is concentrated in the hands of respondents in the higher debtasset ratio categories. As noted below, about 25 percent of the debt was owed by respondents with debt-asset ratios of 70 percent or higher with about six percent of the debt owed by respondents who were technically insolvent. However, the six percent is down from eight percent in 1989 and from 9 .9 percent reported in 1988. The reduction is probably due to loan write-downs by lenders. The two percent of the respondents who are technically insolvent and some respondents in the 70.0 percent to 99.9 percent debt-asset ratio category presumably are vulnerable to any future financial adversities encountered.
Debt-asset ratio category Percent of respondents Percent of debt
Under 40% 75.1 38
40.0 – 69.9% 16.6 37
70.0 – 99.9% 6.2 18.8
100% and over 2.1 6.1
TOTAL 100% 99.9%
Debt is also concentrated in the hands of larger farmers. In 1990, respondents with gross farm income exceeding $100,000 per year owed 69 percent of the debt even though they made up only 39 percent of total respondents who answered the question.
Table 5: Distribution of farms according to debt-asset ratio for all farmers in surveys and farmers in surveys with gross farm incomes exceeding $100,000 per year.
Farmer Responses to the Financial Situation
Farmers were asked to identify the adjustments that they had made during the past 12 months and those they expected to make during the next 12 months to deal with the farm financial situation. The adjustments checked by respondents, ranked according to frequency of mention using the state figures, appear in Table 6. Each adjustment made or expected to be made, which accounted for less than five percent of the total, was lumped together in the “other adjustments” item in Table 6.
Past 12 Months. The adjustments made during the previous 12 months that were most frequently mentioned by respondents were “reduced debt”, “purchased additional machinery”, “increased off-farm work”, “bought crop insurance “, and “kept more complete records” (Table 6). Adjustments made during the past 12 months can be categorized as changes which helped them to reduce costs (e.g., those relating to reducing debt, and hiring others to do custom work), to diversify and reduce risks (e.g., used my machinery to do custom work for others, adding or expanding livestock enterprises, increasing off-farm work and buying crop insurance), and to measure more accurately farm costs and returns (e.g., keeping more complete records).
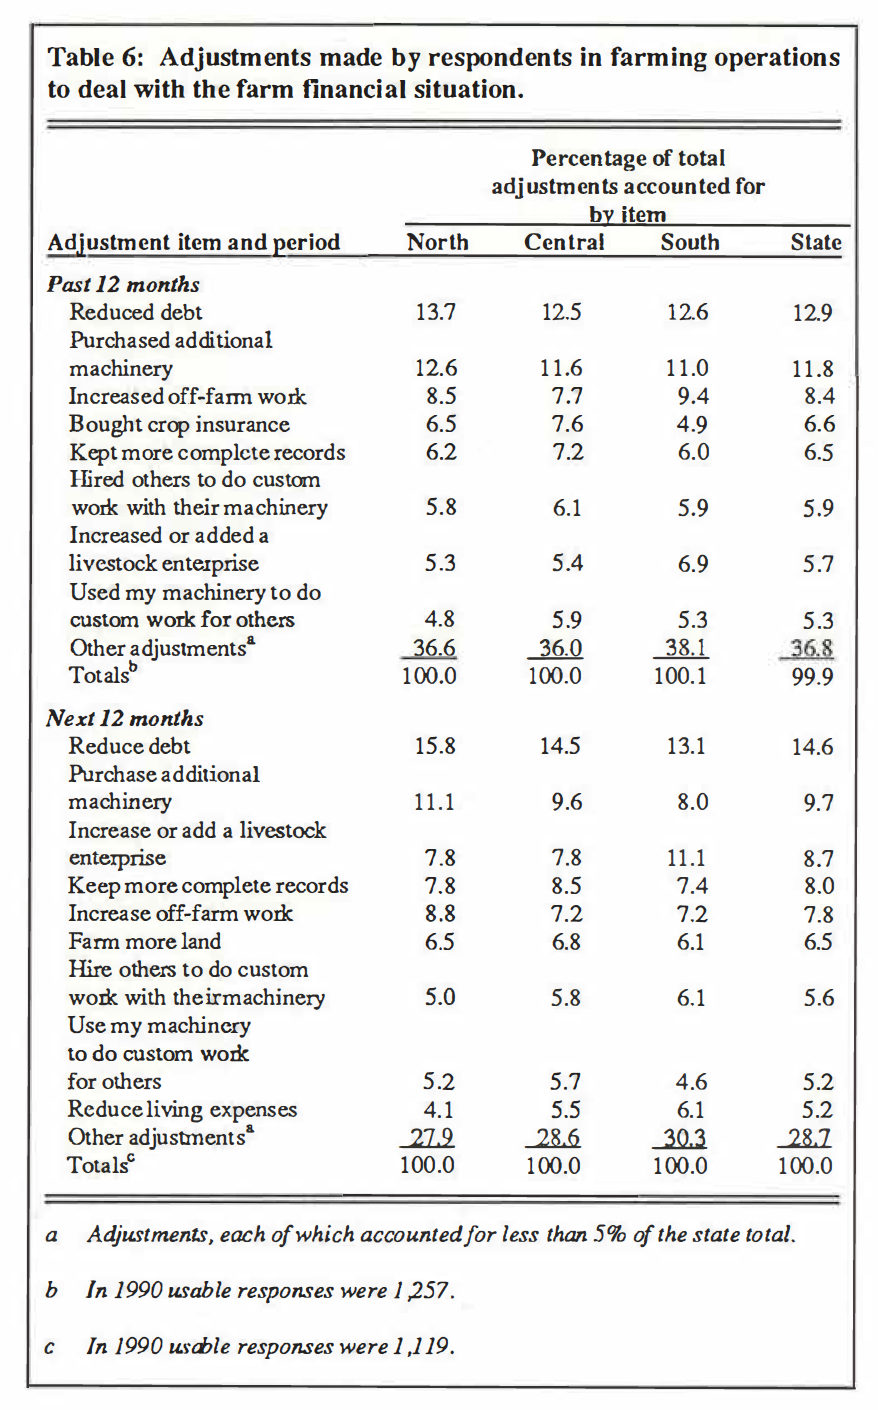
Table 6: Adjustments made by respondents in farming operations to deal with the farm financial situation.
Next 12 Months. Many of the adjustments planned for the next 12 months by the respondents are similar to those made during the previous 12 months and to those reported on previous surveys.
“Reducing debt” topped the list followed by “purchasing additional machinery”, “increasing or adding a livestock enterprise”, “keeping more complete records”, “increasing off-farm work”, “farming more land”, and “hiring others to do custom work with their machinery”. Several of the adjustments planned for the next 12 months can be categorized in a similar manner as before, with the addition of a category for expansion (e.g., purchasing additional machinery and farming more land).
Summary and Implications
Key findings and implications of the 1990 farm finance survey are that:
- The distribution of 1989 net farm incomes for respondents is similar to the distribution found in 1987. About 20 percent of the respondents in 1989 had net farm incomes greater than $20,000, down slightly from the figure reported for 1987. The percentage of respondents in 1989 with a net loss, 24.8, is slightly higher than the percentage with a net loss in 1987.
- The average total gross nonfarm income for respondents in 1989 was about $26,000.
- The average debt-asset ratio for respondents in 1990, 24.3 percent, is essentially unchanged from 1988.
- The delinquency rate on farm real estate debt in 1990, 4.9 percent, is down from the 6.1 percent reported in 1988. The 7.9 percent delinquency rate on farm nonreal estate debt in 1990 is up from 5.7 percent reported in 1988, but down from the 13.9 percent in 1986 and the 13.7 percent in 1989.
- 11i+ The percentage of Hoosier farmers who applied for a new loan or additions to existing farm loans for the 1990 crop year and were turned down, 11.6 percent, is up from 7.9 percent reported in 1988, but down from 16.3 percent in 1986.
- The percentage of all respondents in 1990 with debt-asset ratios less than 40 percent, 75.1, is slightly higher than for 1988. The percentage of farmers in 1990 with gross farm incomes exceeding $100,000 and debt- asset ratios less than 40 percent, 67 percent, also was slightly higher than for 1988.
- The percentage of all respondents in 1990 with debt-asset ratios greater than 70 percent, 8.3 percent, is about the same as the 8.2 percent reported in 1988, but down from nine percent in 1989. The percentage of farmers in 1990 with gross farm incomes exceeding $100,000 and with debt-asset ratios greater than 70 percent, 9.8 percent, is down from 12.6 percent in 1989 and about equal to the 10.1 percent in 1988.
- The percent of debt held by all respondents in 1990 with 100 percent or higher debt-asset ratios, 6.1 percent, is down from 8 percent reported in 1989 and from 9.9 percent in 1988.
- During the past year, “reducing debt” and “purchasing additional machinery,” were the two most frequently mentioned adjustments for respondents.
- There are no data to support the claim that a significant number of lenders in Indiana have stopped making loans to farmers, or that there is a shortage of loan funds available to farmers. The percentage of applicants in 1990 who applied for a loan but were turned down because the lender is not interested in making agricultural loans, 16 percent, is down from 18 percent in 1988. The percentage of respondents unable to get a loan for the 1990 crop, three percent of those who applied, is equal to the percentage in 1988.
- Additional restructuring and/or write off debt by farm lenders may be necessary since about six percent of the debt was owed by farmers who were technically insolvent on January 1, 1990.
- In summary, several findings noted above are interpreted as signaling general improvement in the financial condition of Hoosier farmers. However, two qualifications should be mentioned. First, farmers in the higher debtasset ratio categories could experience major financial problems in the future if they encounter any substantial adversity. Second, a group of Hoosier farmers continue to experience financial problems and will likely require additional debt restructuring and/or write off. Thus, Hoosier farmers should continue efforts to reduce cost, improve efficiency and reduce risks. Such adjustments will enable them to withstand unforeseen financial problems and to operate successfully in the highly competitive economic environment of the 1990’s.
References
[1] Barnard, Freddie L., W. D. Dobson, Jeurene Falck, and Cheryl Sinn, Non-farm lncome of Indiana Farmers, Staff Paper No. 87-24, July 1987.
[2] Harrington, David H., A Summary Report on the Financial Condition of Family-Size Commercial Farms, ERS-USDA, Ag. Info. Bul. No. 492, March 1985.
Authors’ Note
In June 1990 a telephone survey of about 400 nonrespondents was conducted mainly to determine if the characteristics of the farmers who did not respond to the mail questionnaire differed from those who responded. Such an investigation helped to determine if the mail questionnaires produced a representative sample, particularly whether nonrespondents were in worse financial condition than respondents. The respondents to the telephone survey farmed fewer acres (324) than respondents to the mail survey (384). The financial measures were for the most part, better for telephone respondents than for mail respondents; delinquency rates for real estate and nonreal estate loans farmers with a net farm loss in 1989, debt-asset ratio and percentages with debt-asset ratios exceeding 40 and 70 percent. The percent turned down when applying for a loan was higher for telephone respondents (12.8 percent; 39 respondents) than for mail respondents (11.6 percent; 418 respondents). No other differences in characteristics could be detected in the responses obtained by telephone. Hence, the results obtained by telephone were included with those obtained by mail questionnaires to produce the summaries appearing in this article.
![]()
![]()
![]()
![]()
![]()
