2002 Farm Bill: Down on the Farm
September 13, 2002
PAER-2002-9
Andrew Falwell, Research Associate and Allan Gray, Assistant Professor
![]()
![]()
![]()
![]()
![]()
Note: The explanations contained in this article are based on the authors’ interpretation of the Farm Bill language and historical Farm Bill implementation rule experiences. As such, all materials contained in this document are subject to change, based on USDA’s interpretations of the law. Check with your local FSA office for updates.
* The term producer is used as a generic term for the individual or entity entitled to a payment (direct or LDP under the 96 law) such as an operator owner, operating tenant, and a share lease landlord.
This article will help clarify some of the decisions that crop producers need to make to assure full benefit from this Farm Bill’s various support mechanisms.
How Does the New Farm Bill Determine Support Levels for Program Crops?
The new, six year (2002-2007), Farm Bill has three basic types of commod-ity program payments. All three types of payments are available for corn, soybeans, wheat, cotton, rice, grain sorghum, barley, oats, peanuts, other oilseeds, small chickpeas, and lentils. The payments are Direct Payments (formerly known as AMTA pay-ments), Counter-cyclical Payments
(CCP), and Loan Deficiency Pay-ments (LDP). Each type of payment uses a different formula to compute the payment the farmer will receive.
Direct Payments: Direct payments are fixed payments that are based on the producer’s* historical production base. These payments were introduced in the 1996 Farm Bill and are received by a producer regardless of commodity price levels or what is planted on the farm. Most all producers received these direct payments (known as AMTA or “Freedom to Farm” payments) since 1996. Producers (such as those who did not follow a required conservation plan) that have not been receiving these payments are eligible to sign up for the new farm bill payments if they have been planting any program crops over the last four years. The payment rates per unit of production for corn, soybeans, and wheat are shown in Table 1. These rates are multiplied by the farm’s base acres, direct payment yield, and a 0.85 adjustment factor to calculate total direct payments for a crop year.
Counter-cyclical Payments: Counter-cyclical payments accrue to producers when market prices fall below a certain level, known as a target price. The target prices for corn, soybeans, and wheat are provided in Table 1. The payments are made based on a historical production level much like direct payments. However, the rate per yield unit is not fixed. Instead, the rate per yield unit will depend upon the United States 12-month market average price.
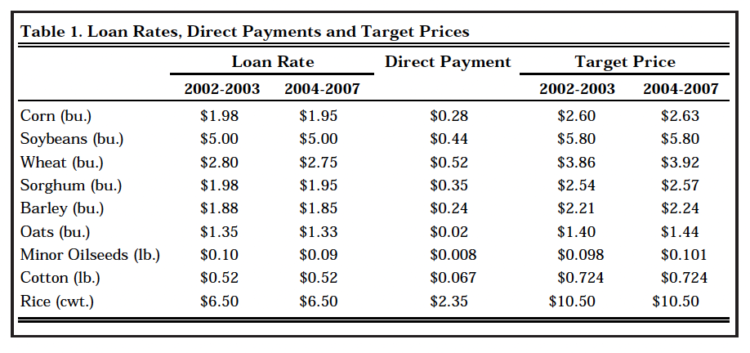
Table 1. Loan Rates, Direct Payments and Target Prices
As an example, the target price for soybeans is $5.80 per bushel. To determine the CCP rate subtract the direct payment rate of $0.44 per bushel to get an effective CCP target price of $5.36 per bushel. Next, the higher of the US marketing-year price or the loan rate, listed in Table 1, is subtracted from the CCP target price to get the final CCP payment rate. If the US marketing-year price for soybeans is $4.75 per bushel, and the loan rate (listed in table 1) is $5.00 per bushel, the final CCP payment rate is $0.36 ($5.36-$5.00) per bushel. Thus, the maximum CCP rate for soybeans is $0.36 per bushel since the loan rate keeps the CCP rate from being any larger. If on the other hand the US marketing-year average price for soybeans is $5.25 instead of $4.75, the counter-cyclical payment would be $0.11 ($5.36-$5.25) per bushel. Thus, as the market price rises above the loan rate, the total CCP will fall. Once the US average market-year price rises above $5.36, there will no longer be a CCP.
Loan Deficiency Payments: LDP payments are available when the posted county price, on a chosen day, is below the loan rate for that county. These payments are made based on a producer’s (farmer’s) current production of that crop. To receive the payments, the farmer must be in possession of the har-vested crop on the day chosen to exercise the LDP payment. That is, the farmer must first harvest the crop, select a date to exercise the LDP payment, and prove possession of the crop. If possession of the crop is transferred before exercising the LDP, no payment will be allowed.
A LDP calculation requires knowledge of the posted county price and the loan rate for the county where the farmer’s crop is sold. The posted county price, loan rate and current LDPs are on the Farm Service Agency’s web page.
National average loan rates for corn, soybeans, and wheat are provided in Table 1. Using the national average wheat loan rate of$2.80 as an example, if the posted county price of wheat was $2.40 on the day a producer elected to take the LDP payment, then the LDP payment would be $0.40 per bushel. The$0.40 per bushel would be paid on every certified bushel of the farmer’s production for that year. If a producer chose to sell the crop on that same day for $2.40 then the farmer’s price for wheat would be the $2.80 per bushel loan rate. In essence, the loan rate combined with the LDP works much like a put option. If exercised properly, the LDP option can guarantee that a producer will receive a price no lower than the loan rate.
Loan deficiency payments and marketing assistance loans have been available since the 1996 Farm Bill was enacted. The 2002 Farm Bill maintains or raises the loan rates for all commodities except soybeans, which is lowered from $5.26 nationally to $5.00. In addition, the Secretary of Agriculture is instructed, under the 2002 Farm Bill, to examine the determination of county-level loan rates and posted county prices.
Thus, some county-level loan rates may change more or less than the published national average loan rates in the 2002 Farm Bill. Finally, loan rates for corn and wheat will be lowered from their original levels after the 2003 crop year, as shown in Table 1. The lower loan rates will be offset, somewhat, by increases in the target prices used to compute the CCP.
How are Base Acres and Payment Yields Determined?
Under the new Farm Bill, producers have the option to update their “base acres.” Base acres are the historical acres planted to a program crop used in determining the amount of direct and CCP payments a producer receives. Generally, farms have corn base acres, referred to as a contract acres base (CAB) under the 1996 Farm Bill, and some may also have wheat base acres, also called contract acres.
Under the new Farm Bill, those base acres can be updated to reflect the farm’s average plantings over the 1998 to 2001 crop seasons. In addition, a producer can now sign-up for soybean base acres, which have not been available in past farm programs. To update base acres a producer needs to present planted and pre-vented planted acres on a farm, for all crops, in each of the four years 1998 to 2001, to the county FSA office. The new base acreage for each crop will be the average plantings for each crop over this four-year period, including a zero for any year that the particular crop was not planted. The 2002 Farm Bill offers a producer four specific options in regards to base acres and yield updates, the list below gives a brief summary of these options. The following paragraphs will then expand on these summaries.
Option 1: Make no changes.
Option 2: Make no changes, except add soybean base to fully base acreage.
Option 3: Maximize soybean base through base acreage trading.
Option 4: Update base acres and update yields (3 sub-options for Option 4)
- Update base acres, but keep old yields
- Update base acres, update yields by 70% rule.
- Update base acres, update yields by 93.5% rule.
Option 5: Swap selected PFC acres for additional soybean base.
The farmer may choose not to update base acreage for crops that already contain a base and can add soybean acres up to the maximum of the average soybean acres planted from 1998 through 2001 up to the total amount of cropland. For example, if a producer has 100 acres of land that currently has 55 acres of corn base. A producer has been planting 50 acres of corn and 50 acres of soybeans every year from 1998 through 2001. This producer can either update his corn base to 50 acres and add soybean base of 50 acres or leave his corn base at 55 acres and add 45 acres of soybean base. A producer cannot have 55 acres of corn base and 50 acres of soybean base since this will exceed the total crop acreage of 100 acres. If a producer has been planting a non-program crop such as popcorn or tomatoes then those acres will not count toward the historical plantings. For instance, say a producer has 100 acres of land that currently has 55 acres of corn base. A producer has been planting 50 acres of corn, 40 acres of soybeans, and 10 acres of popcorn every year from 1998 through 2001. This producer can update his acres to 50 acres of corn and 40 acres of soybeans. Notice that a producer actually loses the 10 acres planted to popcorn. If a producer decides to maintain current bases, but add soybean base, a producer can add the 40 acres of soybean base due to his/her historical plantings.
Historical acres of soybeans may not be what were actually planted by a producer when options 2 or 3 from the USDA are chosen. Soybeans are required to use the lesser of historical acres or total farm acreage minus base acres for all crops. For example, say a producer has 100 acres of land that currently has 60 acres of corn base and 10 acres of wheat base. Historically a producer has been planting 50 acres of corn and 50 acres of soybeans. This producer can only update his soybean acreage to 30 acres because there are only 30 unbased acres available even though they have been historically planting 50 acres of soybeans.
The decision to update base acres will depend upon the amount of current base acres for each crop and historical program yields. As will be explained next, the decision to update base acres will depend in part on a producer’s desire to update payment yields for CCP payments.
Payment yields are used, in combination with base acres, to determine direct and counter-cyclical payment amounts. For direct payments, the payment yield is the same yield currently used to compute AMTA payments under the 1996 Farm Bill. This yield is based on the farm’s average yield for the crop from 1981 through 1985. In the case of soybeans, the direct payment yield is determined by taking the average soybean yield for the farm from 1998 through 2001, excluding years when no soybeans were planted, and multiplying by 0.78. (0.78 is the ratio of the average national soybean yield from 1981 through 1985 relative to the average national soybean yield from 1998 through 2001.)
Counter-cyclical payment yields are a bit more confusing. If the farmer chooses to update base acres, then the farmer may also choose to update payment yields for computing a CCP. The updated yield is based on the farm’s average yield for the crop from 1998 through 2001. For any year the crop was not planted, no yield is recorded. Any year that the farm’s yield is more than 75 percent below the county-average yield, a producer can use 75 percent of the county average yield instead of the actual yield. Once the average for the 1998 through 2001 crop yield for the farm is determined, a producer can choose one of the following methods to determine the payment yield for CCP payments:
- Use the direct payment yield plus 70 percent of the difference between the 1998 through 2001 average yield and the direct payment yield.
- Use 93.5 percent of the 1998 through 2001 average yield.
For example, if the farm has a 120 bushel direct payment yield for corn and the average over the 1998 through 2001 period is 150 bushels, a producer would have the following choices:
- 120 + (150-120)*0.70 = 141.0
- 150 * 0.935 = 140.3
In this case, the farmer would choose option 1. However, there are cases when option 2 would be the better choice. Whichever method is used, that method must be used for all crops on that specific farm. That is, a producer cannot update yields for corn using option 1 and update yields for soybeans using option 2. Both crops must use the same option for updating yields. In addition, a producer cannot update yields unless they also update base acres. This may be a problem if the farm currently has substantial corn base. The 2002 Farm Bill parameters favor corn over soybeans, so the farmer may have reason to want to keep old base acres rather than lowering base acres to increase payment yields for CCP payments.
What are acceptable documents for verifying yields?
The local Farm Service Agency (FSA) will require verifying documentation from a producer, for updating yields. If the product was sold or stored off-farm one of the following items are required: LDP records, ware-house receipts, warehouse ledgers, load summaries, settlement sheets or scale tickets (weigh slips) supported by a sales document. If the product was fed or used on the farm one of the following documents is required: FSA measurements, FSA appraisals, Risk Management Association (RMA) appraisals, RMA measured production, LDP records and farm records for seed use. The FSA recognizes that this information could be difficult to locate by individual farm numbers, so producers will be allowed to commingle the entire crop and take an overall average to be used for all farm numbers. Please see your local FSA office for additional information on proper yield verification.
If the farmer has purchased or began farming a new farm the following documents are needed to update acres and yields. The preferred option is to obtain the records from the previous producer (tenant or operating owner or share lease owner). For feedgrains, the farmer may use either historical information from neighboring farms or 75% of the county average yield. For oilseeds the only options are to obtain the previous producer’s records or use 75% of the county average yield.
FSA will not actually require verification at the time of enrollment in the program. However, all farm yield information will be verified at some point during the life of the Farm Bill. For more details concerning verifying yields go to your FSA office.
Can You Provide an Example of How All of These Payments May Come Together for a Farm?
A typical central Indiana farm will be used to illustrate the computations for the various payments available to crop farmers. Basic information assumed for the example farm
is contained in Table 2. The calculations of all three government payments are summarized in Worksheet 1.
Over the 1998 through 2001 period, the farm produced on average 812 acres of corn, 688 acres of soybeans, and 150 acres of wheat. The farm currently has 875 acres of corn base and 125 acres of wheat base which were established as contract acres during the 1996 Farm Bill. The farm also has current payment yields of 120 bushels for corn and 58 bushels for wheat, established in 1985. These yields will be used to compute direct payments. The farm averaged 150 bushels per acre for corn, 45 bushels per acre for soybeans, and 75 bushels per acre for wheat over the 1998-2001 periods. For the 2002 Farm Bill, this farm will choose to update its base acres and update yields for all CCP payments. The yields will be updated using rule 1, which takes 70 percent of the difference between the 1998-2001 average yield and the direct payment yield.
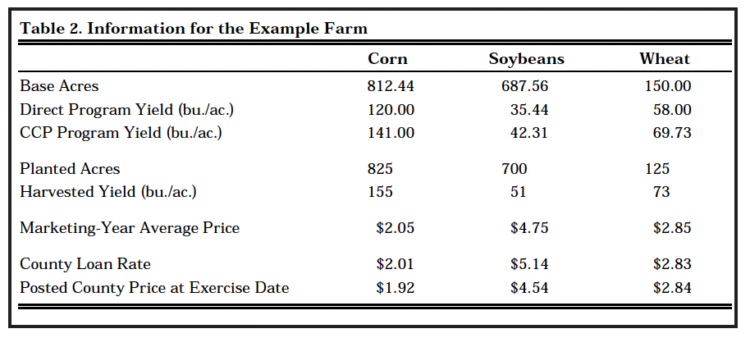
Table 2. Information for the Example Farm
Having developed the historical production base for the farm (base acres and payment yields) Work-sheet 1 can be completed to deter-mine the government payments the farm can expect to receive in a given year. We will use the 2002-03 direct payment rates, target prices, and loan rates to compute the payments. Assume the 12-month season average prices are: $2.05 per bushel for corn, $4.75 per bushel for soybeans, and $2.85 per bushel for wheat.
The direct payments for corn for the farm would be $23,191 ($0.28 payment rate X 812 base acres X 120 bu. payment yield X 0.85 adjustment factor). The calculations for soybeans and wheat are identical to corn, resulting in direct payments of $9,114 and $3,845, respectively. Total direct payments are $36,163 for this 1650 acre crop farm which is just under the $40,000 payment limit set for direct payments. Direct payments per base acre are $28.56, $25.64, and $13.26 for corn, soybeans, and wheat, respectively which will be the same every year throughout the life of the Farm Bill. These calculations illustrate the favorable position of corn relative to soybeans for direct payments.
Based on the assumed 12-month marketing-year prices, CCP payments for the example farm are $26,290, $8,901, and $4,356 for corn, soybeans, and wheat, respectively. The per-base-acre payments are $32.36, $12.95, and $29.04 for corn, soybeans, and wheat, respectively. These values again illustrate the relative benefits for each crop where soybean base benefits are maximized at the loan rate while corn and wheat benefits could still be higher if market prices fell from the current assumed levels to levels below the loan rate.
LDP payments do not rely on historical planting bases or payment yields. Instead, LDP payments are based on current production levels and the posted county price at the time a producer chooses to exercise LDP’s. In this example, a producer chose to exercise LDP’s for corn when the posted county price was $1.92. The county loan rate is assumed to be$2.01 resulting in a payment of $0.09 per bushel of corn produced for a total, in this example, of $11,509. Similar calculations result in LDP’s for soybeans of $0.60 per bushel produced. The posted county price for wheat was not below the county level loan rate resulting in no LDP payments for the example producer’s wheat production.
Summary
The 2002 Farm Bill continues the direct payment and loan deficiency payments system that was introduced in the 1996 Farm Bill. In addition, the new Farm Bill introduces a counter-cyclical payment to offset reductions in commodity prices. The new counter-cyclical payments will be paid on a historical production base consisting of base acres and payment yields that may be updated to reflect average production levels in 1998 through 2001. In addition, the new Farm Bill lowers the loan rate for soybeans and raises the loan rate for corn and wheat. To offset the lower loan rate for soybeans, a direct payment and counter-cyclical payment is introduced in the 2002 Farm Bill, requiring producers to create an historical acreage and yield base for soybeans. Finally, the new Farm Bill maintains the planting flexibility introduced in the 1996 Farm Bill. However, the introduction of base acres of soybeans reduces the flexibility that Indiana and other Cornbelt producers have to grow fruits and vegetables on some of their acreage without sacrificing current or future government payments.
Currently the USDA is finalizing most of the rules for implementing the new Farm Bill. Producers are now faced with several important decisions that affect the amount of support they receive from the government over the next six years. April 1, 2003 is the deadline for signing up acreage and yield update options. This article illustrates payment provisions in the 2002 Farm Bill and has attempted to clarify some of the decisions that will need to be made over the next several months.
If you have further questions, please contact the Department of Agricultural Economics at Purdue University.
Editor’s note: The author’s deal with the direct and counter-cyclical payments as separate parts of the 2002 Farm Bill for clarity. Others, including the Farm Service Administration, present the same information under the heading of Direct and Counter Cyclical Payments (DCP) as though the two are one aspect of the 2002 Farm Bill. Every individual with an interest (tenant or owner) in farmland should be knowledgeable of the 2002 Farm Bill requirements and options. Accuracy of the law and regulations, and data with respect to an individual’s farmland interest should be verified with the local Farm Service Administration County executive director.
While cash-rent landlords are not producers (don’t directly share in payments) for Farm Bill payment purposes, they (or a knowledgeable, legal representative) should evaluate the 2002 Farm Bill provisions and options. The choices under this new law will impact the Farm Bill payments for their land. Rented parcels are often pooled to constitute a “farm” for a tenant/producer under price and income support legislation and regulations. It is possible that a given landlord’s parcel with a high corn base relative to tillable acres and high historic yields could be disadvantaged under a pooled arrangement.
Payment limitations in the 2002 Farm Bill may encourage producers to seek formal business reorganizations. The implications of various entities (corporations, partnerships, limited liability companies, … ) under the new Farm Bill should be checked with the rules of the Farm Bill before taking action. Lastly, individuals should be aware that there is an appeal procedure for what may be adverse interpretations and rulings. If significant disputes arise, the affected individual may want to contact legal counsel who is an expert in these matters.
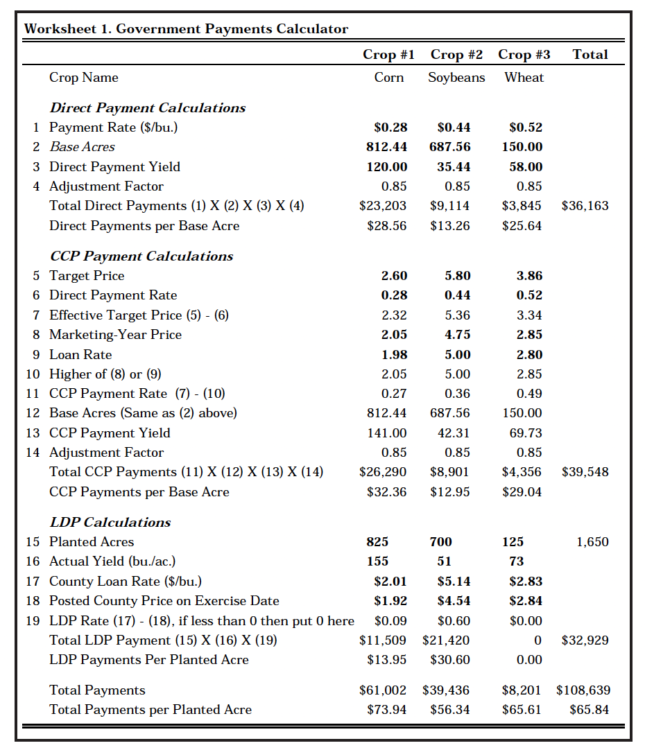
Worksheet 1. Government Payments Calculator
![]()
![]()
![]()
![]()
![]()
