2012 Indiana’s Farmland Market Continues Moving Higher
August 1, 2012
PAER-2012-07
Craig L. Dobbins, Professor and Kim Cook, Research Associate
![]()
![]()
![]()
![]()
![]()
While Indiana crops are suffering from the worst drought since 1988, the weather is not the only thing that has been hot. Robust net farm incomes, favorable interest rates, strong farmland demand, and a limited supply of farmland for sale kept Indiana farmland values and cash rents moving higher. The June 2012 Purdue Farmland Value Survey1, indicates the statewide increase in farmland value was 14.3% to 18.1%. Statewide cash rents increased 12.8% to 15.2%.
For the state as a whole, the 2012 survey found the average value of bare Indiana cropland ranged from $5,013 per acre for poor quality land to $7,704 per acre for top quality land (Table 1). Average quality cropland had a value of $6,359 per acre. For the 12-month period ending June 2012, the value of top, average, and poor quality land increased 18.1%, 16.3% and 14.3%, respectively.
To assess farmland productivity, survey respondents estimated long-term corn yields for poor, average, and top quality land. For the state, the average long-term corn yields for poor, average, and top quality land were 126, 159, and 192 bushels per acre, respectively. State-wide, the value per estimated bushel of corn yield for poor, average, and top land qualities was
$39.70, $39.97 and $40.05 per bushel, respectively.
The transitional land market, that is farmland moving out of agriculture, appears to be coming back to life after declining for four straight years. In 2012, the average value was $8,505, an increase of 7.2%. This is a specialized market with the transitional land value strongly influenced by the planned use and location. The estimated value of farmland in this market has a very wide range. In June 2012, transitional land value estimates ranged from $2,500 to $21,000 per acre. Because of the wide variation in transitional land values, the median value2 may give a more meaningful picture than the arithmetic average. The median value of transitional land in June 2012 was $8,000 per acre, $750 per acre more than in 2011.
The June 2012 state-wide average value of rural recreational land, land used for hunting and other recreational activities, was $3,489 per acre, an increase of 3.9% when compared to June 2011. As with transitional land, there is a wide range of values for rural recreational land, again making the median value a more meaningful indictor than the arithmetic average. The median value for rural recreational land in June 2012 was $3,000 per acre, the same as 2011.
State-wide Rents
There were also strong increases in the 2012 cash rent. The increase was the largest for top quality land at $35 per acre. Rents for average and poor quality land increased $26 and $18 per acre, respectively. The estimated cash rent was $265 per acre on top quality land, $208 per acre on average quality land, and $159 per acre on poor quality land (Table 2). These cash rent estimates represent the gross rent. To arrive at a net return for the landowner expenses such as real estate taxes, drainage assessments, insurance and other maintenance expenses would need to be subtracted. On a percentage basis, cash rent for top, average, and poor quality land cash rent increased by 15.2%, 14.3%, and 12.8%, respectively. On a per bushels basis cash rent ranged from $1.26 to $1.38 per bushel.
For top quality farmland, cash rent as a percentage of farmland value was 3.4%. This was 0.1% below the 2011 level. For average and poor quality farmland, cash rent as a percentage of farmland value was 3.3% and 3.2%, respectively. These percentages were the same as 2011. These percentage values are the lowest in the 38-year history of the survey and averaged 5.6% for the entire period.
Area Land Values
Survey responses were organized into six geographic regions (Figure 1). As in the past, there are geographic differences. This year, changes in farmland values were similar in the North, Northeast, West Central and Central regions. (Table 1). The West Central region continues to have the highest per acre farmland values. The value for top, average, and poor quality farmland was $8,949, $7,475, and $6,121 per acre, respectively. The lowest farmland values are in the Southeast where top, average and poor quality farmland have values of $4,465, $3,854, and $3,160 per acre, respectively.
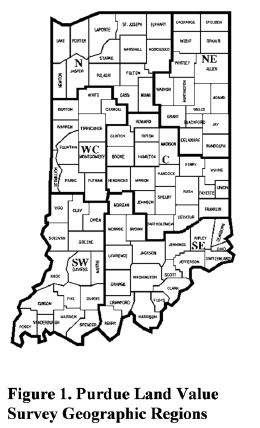
Figure 1. Purdue Land Value Survey Geographic Regions
Land value per bushel of estimated long-term corn yield (land value divided by bushels) is the highest in the West Central region, ranging from $43.77 to $44.93 per bushel. The per bushel values for the North, Northeast, Central, and Southwest are quite similar, ranging from $37.51 to $41.05. The lowest per bushel values are in the Southeast, ranging from $25.84 to $29.52 per bushel.
Area Cash Rents
The largest percentage increase in cash rent was in West Central Indiana. Here cash rents increased from 13.4% to 18.9% (Table 2). The percentage change in the North, Northeast, and Central regions were similar, ranging from 10.8% to 16.3%. For all regions except the Southwest and Southeast, the largest percentage increase was for top quality land.
The highest per acre cash rent is $314 per acre for top quality land in the West Central region. With a range in per acre rents across land qualities in this region of $195 to $313, this region has the strongest cash rents for all land qualities. Cash rents continue to be the lowest in the Southeast, ranging from $106 to $186 per acre.
Differences in productivity have a strong influence on per acre rents. To adjust for productivity differences, cash rent per acre was divided by the estimated long-term corn yield. Rent per bushel of corn yield in the West Central region ranged from $1.39 to $1.58. Cash rent per bushel of corn yield in the North, Northeast, Central, and Southwest regions ranged from $1.19 to $1.40 per bushel. Per bushel cash rent in the Southeast ranged from $0.99 to $1.08 per bushel. This is the first time that per bushel cash rent in the southeast has exceeded $1.00 per bushel.
Range of Responses
Tables 1 and 2 provide information about the averages of the survey responses. Averages are helpful in establishing a general value for farmland and cash rent and the direction in which values and rents are moving across time. However, it is important to remember that an average is developed from several different responses regarding the perceived value and cash rent. In some cases, those responding might be closely clustered around the average. In this case, the range of survey responses will be narrow. In other cases, the responses may be widely dispersed; there will be a wide difference in survey responses. It is possible to have the same or nearly the same average with either type of dispersion. Figure 2 illustrates these properties for farmland values. The top of the dark line is the largest value reported by respondents in the area for land of the specified quality. The bottom of the dark line indicates the smallest value. The square along the line indicates the average.
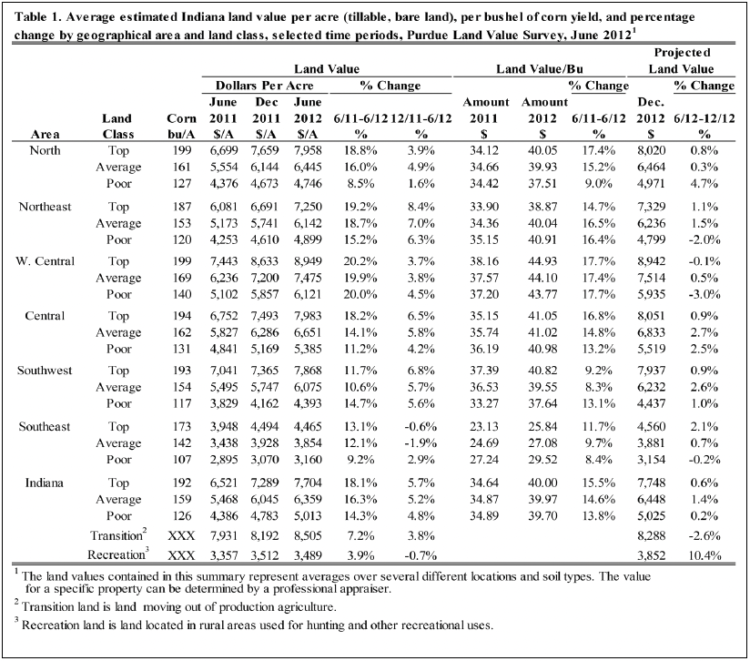
Table 1. Average estimated Indiana land value per acre (tillable, bare land), per bushel of corn yield, and percentage change by geographic area and land class, selected time periods, Purdue Land Values Survey, June 2012
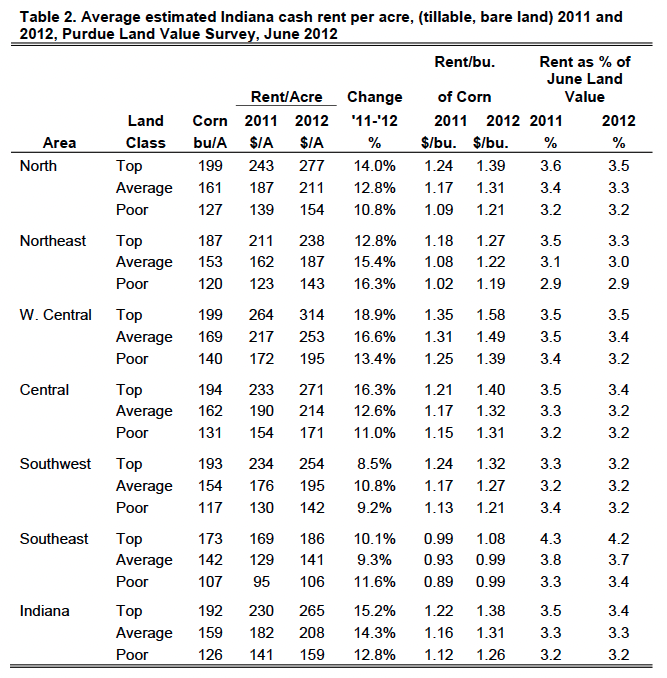
Table 2. Average estimated Indiana cash rent per acre, (tillable, bare land) 2011 and 2012, Purdue Land Value Survey, June 2012
Consider top quality land in the North region. The range of reported values was from about $6,000 per acre to $10,000 per acre. The average of the responses was $7,958 per acre, a value close to half way between the minimum and maximum. This indicates there was a reasonably even distribution of responses between the maximum and the minimum. For top land in the Northeast region there is greater range of values. In addition, the average is closer to the minimum value than the maximum value. For this situation, more responses are clustered at the lower values.
Figure 3 illustrates the same information for cash rents. In both the case of farmland value and cash rent, the survey provides a general guide to value or rent but does not indicate a farmland value or cash rent for a specific farm. Arriving at a value or amount of cash rent for a specific farm requires additional research or assistance from a professional.
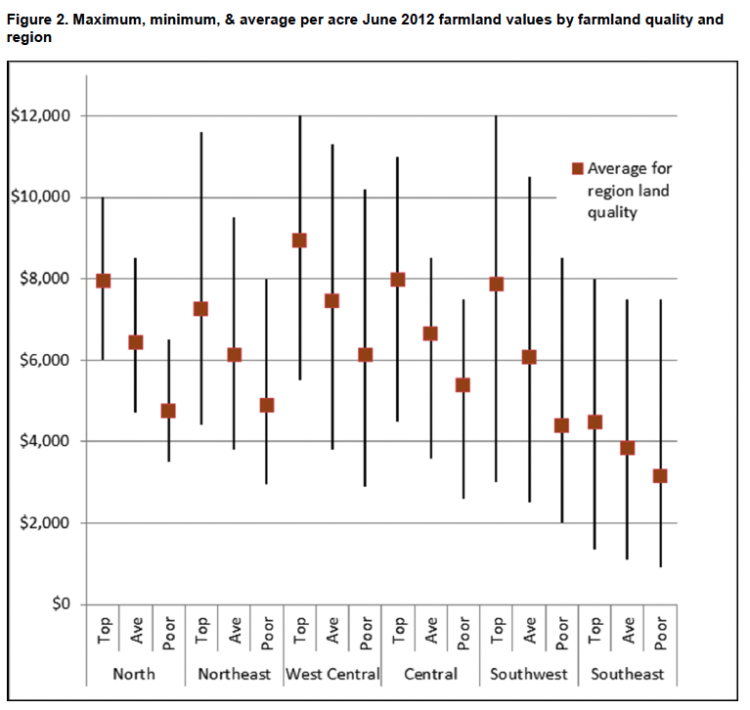
Figure 2. Maximum, minimum, & average per acre June 2012 farmland values by farmland quality and region
Rural Home Sites
Respondents were asked to estimate the value of rural home sites located on a blacktop or well-maintained gravel road with no accessible gas line or city utilities. These properties have a very wide range in value. Because of this wide range, median values (the value at the midpoint of the range) are used as a measure of value for these properties. The median value for five-acre home sites ranged from $8,000 to $10,000 per acre (Table 3). Estimated per acre median values of the larger tracts (10 acres) ranged from $7,500 to $9,750 per acre.
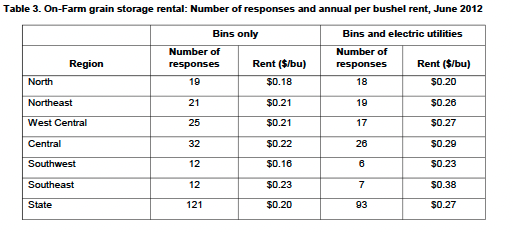
Table 3. Median value of five-acre and ten-acre unimproved home sites
For 2012, the home site data indicate that for many of the regions the value of rural housing sites is beginning to increase. Values in all regions have not returned to the values reported prior to the great recession, but it appears that respondents are more positive about rural housing site values.
Expected Grain Prices, Interest Rates, and Inflation
Current market conditions and expectations about the future have a strong influence on farmland values. To obtain information about the future expectations, survey respondents were asked to provide an estimate of the average corn and soybean price for the period 2012 to 2016. This year saw an estimated five-year corn price similar to the 2011 estimate (Table 5). On average, survey participants expect corn prices to average $5.56 per bushel. The estimated five-year soybean price increased to $12.04 per bushel. This was an increase of $0.45 over last year’s estimate. If these prices are realized, production costs for corn and soybeans do not rapidly increase, and rainfall returns to normal, returns from crop production will remain strong. However, price expectations can quickly change as illustrated by the five-year average prices expected in 2009, 2010, and 2011. Given the reduced crop size this year, corn and soybean prices have been moving upward. Where prices may be in 2015 and 2016 is not clear.
Interest rates have important implications for real estate markets. As interest rates decline, the price of real estate tends to increase. There has been a general decline in Interest rates for the past 30 years. Interest rates have reached a level where there seems to be little more possibility of further declines. Still mortgage rates for houses have continued to decline. Survey respondents’ expectations about the average interest rate over the next five years declined. The 2012 expected interest rate was 90 basis points (0.9%) less than the estimate in 2011.
Inflation rate expectations also continue to decline. On average, survey respondents estimate annual inflation over the next five years will be 3.1%. Since 2008, expectations about long-term inflation have declined by 0.8%. Market Influences Expectations about corn and soybean prices, interest rates and the inflation rate are all pointed in a positive direction for future farmland values. To identify how these and other forces may be influencing the farmland market, survey respondents were asked to assess the influence of 11 different items. These items included: 1) current net farm income, 2) expected growth in returns to land, 3) crop price level and outlook, 4) livestock price level and outlook, 5) current and expected interest rates, 6) returns on competing investments, 7) outlook for U.S. agricultural export sales, 8) U.S. inflation/deflation rate, 9) current inventory of land for sale, 10) cash liquidity of buyers, and 11) current U.S. agricultural policy.
Respondents used a scale from -5 to +5 to indicate the effect of each item on farmland values. A negative influence is given a value from -1 to -5, with a -5 representing the strongest negative influence. A positive influence was indicated by assigning a value between 1 and 5 to the item, with 5 representing the strongest. An average for each item was calculated.
In order to provide a perspective on the changes in these influences, data from 2010, 2011, and 2012 are presented in Figure 4. The horizontal axis of the chart indicates the item from the list above. It comes as no surprise that current net farm income, the expected growth in returns, and crop prices are important positive forces. However the importance of crop prices was not as important this year as last year.
This change is in part a reflection of survey timing. Until mid-June, commodity prices had been declining in anticipation of a large crop this year. By the last half of June, the dry weather and its impact on yields was beginning to be noticed by grain markets and prices began to move higher.
Interest rates, the return from alternative investments, and supply of land on the market and the cash position of buyers were also important influences in the farmland market. The influence of interest rates and the cash position of buyers was stronger in 2012. The influence of alternative investments and supply of land were about the same as in 2011. Livestock price level and outlook and current U.S. agricultural policy provided small positive contributions to the land market.
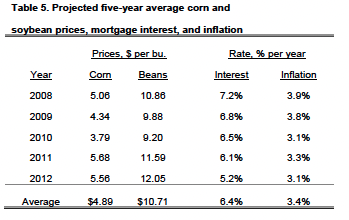
Table 5. Projected five-year average corn and soybean prices, mortgage interest, and inflation
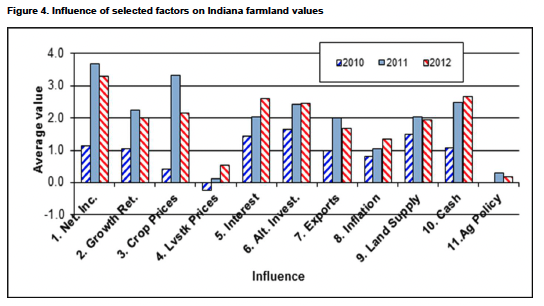
Figure 4. Influence of selected factors on Indiana farmland values
Expected Future Land Values Expectations about corn and soybean prices, net income, and the other influences impacting the land market indicate strong farmland values. However, participants see the growth rate in farmland values slowing considerably. Given the current drought, it is not surprising that respondents would be cautious about forecasting future farmland values. On a state-wide basis, Table 1 indicates that for the six-month period from June to December 2012, survey respondents expect farmland values to increase by only 0.2% to 1.4%. The regional averages indicate respondents in all regions are expecting farmland value growth to slow significantly. The region expected to have the strongest growth is the Central with an increase of 0.9% to 2.7%. In some regions, respondents expect small declines in the value of some farmland qualities.
- What might happen that would make each group correct? Here are a few influences on the side of continued farmland value increases:
- Strong domestic and international demand for corn and soybeans and strong prices
- Rains return to Indiana or other states in the Midwest and the 2012 U.S. corn and soybean crops turn out bigger than expected
- Moderate increases in input costs for corn and soybeans, keeping crop production margins well above historic averages
- Continued low long term interest rates
- Little change in the amount of land available for sale
- An expectation that general inflation will sharply increase
What about influences for those that expect a decline in farmland values?
- Sharp declines in corn demand from livestock and ethanol industry and in soybean export demand
- Sudden change in the U.S. policy away from mandating ethanol usage levels
- Sharp rise in interest rates because of a downgrade in the credit rating of U.S. government debt obligations, increased inflation fears, or major shift in Federal Reserve policy
- Sharp rise in crop input costs reducing crop production margins
- Elimination of farm cash reserves because of the 2012 drought
- The development of a multi-year drought
- Strong international corn and soybean acreage increase resulting from capital investments in agricultural production stimulated by high grain prices
- U.S. recession brought on by the inability of Congress to deal effectively with the fiscal issues facing the country at the end of 2012
-
A worsening world economy because of a deepening European debt crisis and slow growth in Chain
-
Something no one has thought of
While the probability of events triggering a decline in farmland values seems low, the 2012 drought is likely to make farmland buyers more cautious. Farmers have been an important group of buyers in this market for the last several years. The drought will draw down cash reserves making it more difficult for farmers to make a large capital purchase. While a decline in farmland values is not expected for next year, neither is another double digit increase. If you are planning a farmland purchase, it will be important to carefully assess how such a purchase would impact the business. In an economic environment with big uncertainties, a useful exercise is to perform a stress test and develop a “Plan B.”
Acknowledgements For The Purdue Land Value and Cash Rent Survey
The Purdue Land Value and Cash Rent Survey is conducted each June. The survey is possible through the cooperation of numerous professionals knowledgeable of Indiana’s farmland market. These professionals include farm managers, appraisers, land brokers, agricultural loan officers, Purdue Extension educators, farmers, and persons representing the Farm Credit System, the Farm Service Agency (FSA) county offices, and insurance companies. Their daily work requires that they stay well informed about land values and cash rents in Indiana. These professionals provide an estimate of the market value for bare poor, average, and top quality farmland in December 2011, June 2012, and the expected value for December 2012. They also provide an estimate of the current cash rent for each farmland quality. To assess the productivity of the land, respondents provide an estimate of long-term corn yields. Respondents also provide a market value estimate for land transitioning out of agriculture and recreational land. Responses from 276 professionals are contained in this year’s survey representing all but four Indiana counties. There were 43 responses from the North region, 43 responses from the Northeast region, 57 responses from the W. Central region, 72 responses from the Central region, 33 responses from the Southwest region, and 28 responses from the Southeast region. Figure 1 illustrates the counties in each re gion. Appraisers accounted for 16% of the responses, farm loan professionals represented 53% of the responses, farm managers or farm operators provided 11% of the responses, and other professionals provided 20% of the responses. We express a special appreciation to the support staff of the Department of Agricultural Economics. The changes occurring in the department at the time of the survey resulted in several of the staff pitching in on short notice. Without your help this project would never have been completed. Hopefully our plea for help was viewed as a welcome change in your usual summer routine. The data reported here provide general guidelines regarding farmland values and cash rent. To obtain a more precise value for an individual tract, contact a professional appraiser or farm manager that has a good understanding of the local situation.
![]()
![]()
![]()
![]()
![]()
