2016 Purdue Crop Cost and Return Guide
December 13, 2015
PAER-2015-19
Michael Langemeier and Craig Dobbins, Professors of Agricultural Economics
![]()
![]()
![]()
![]()
![]()
The 2016 Purdue Crop Cost and Return Guide, which is available free from the Center for Commercial Agriculture website, gives estimated costs for planting, growing and harvesting a variety of crops, as well as estimated contribution margins and earnings. The guide is updated frequently as grain futures prices change and the costs of inputs, such as seed, fertilizer, pesticides and fuel, fluctuate. This paper discusses estimates made in late November 2015.
The guide presents cost and return information for low, average, and high productivity soils. The discussion here will focus on the estimates for average productivity soil. Table 1 presents crop budget information for continuous corn, rotation corn, rotation soybeans, wheat, and double-crop soybeans for average productivity soil in Indiana. Double-crop soybeans are typically planted after wheat so it is typical to combine the contribution margin for these two crops when comparing to continuous corn, rotation corn, and rotation soybeans. The yield estimates in Table 1 reflect trend yields for Indiana for each crop. The contribution margin, obtained by subtracting total variable cost from market revenue, ranges from $119 per acre for continuous corn to $266 per acre for wheat/double-crop soybeans.
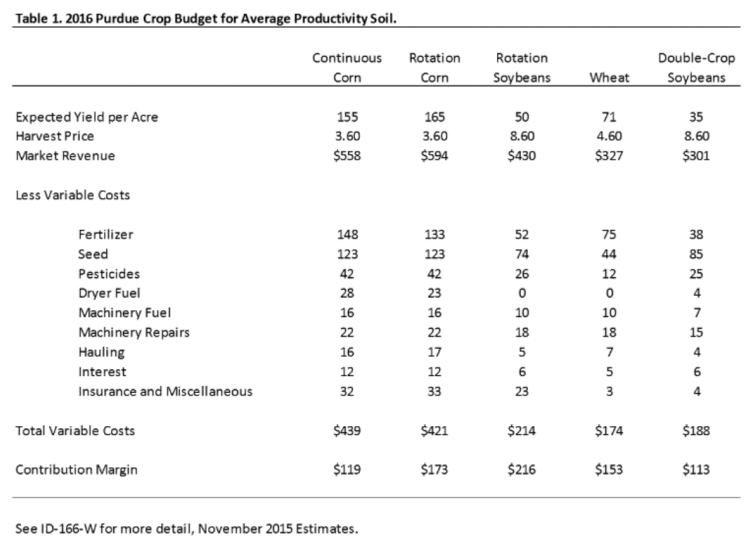
Table 1. 2016 Purdue Crop Budget for Average Productivity Soil.
Figure 1 illustrates the trends in market revenue, total variable costs, and the contribution margin for rotation corn from 2007 to 2016. Market revenue in 2016 is expected to drop approximately 8%, due to the decline in corn prices. Variable costs are expected to decrease approximately $25, primarily due to lower fertilizer and fuel costs. The trend in fertilizer and seed costs over the last ten years is illustrated in Figure 2. Fertilizer costs are based on price estimates in late November. The contribution margin for 2016 is expected to drop $25 per acre (approximately 12%) and is expected to be the lowest since 2006. It is important to note that the contribution margin is used to cover overhead costs such as machinery costs, family and hired labor, and rent. The inability to cover these overhead costs typically puts downward pressure on rents.
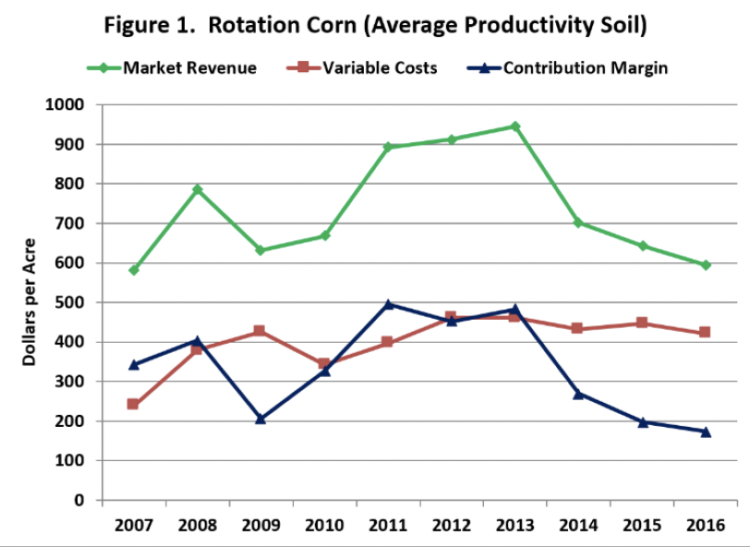
Figure 1. Rotation Corn (average productivity soil)
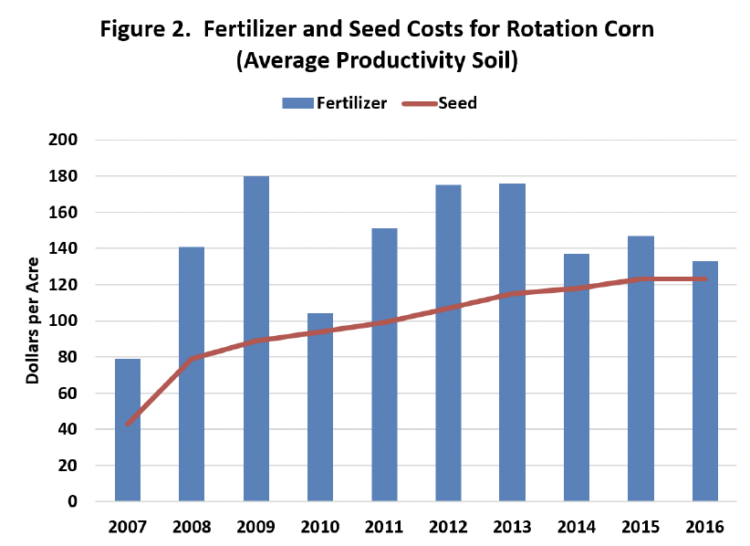
Figure 2. Fertilizer and Seed Costs for Rotation Corn (average productivity soil)
Trends in market revenue, total variable costs, and the contribution margin for rotation soybeans are illustrated in Figure 3. As with rotation corn, the market revenue for rotation soybeans is expected to drop. Due to relatively lower fertilizer and fuel costs, total variable costs are expected to decline approximately $10 per acre. The trend in fertilizer and seed costs for rotation soybeans is illustrated in Figure 4. The contribution margin for rotation soybeans is expected to decline $32 per acre (approximately 13%).The contribution margin for rotation soybeans is the lowest it has been since 2009.
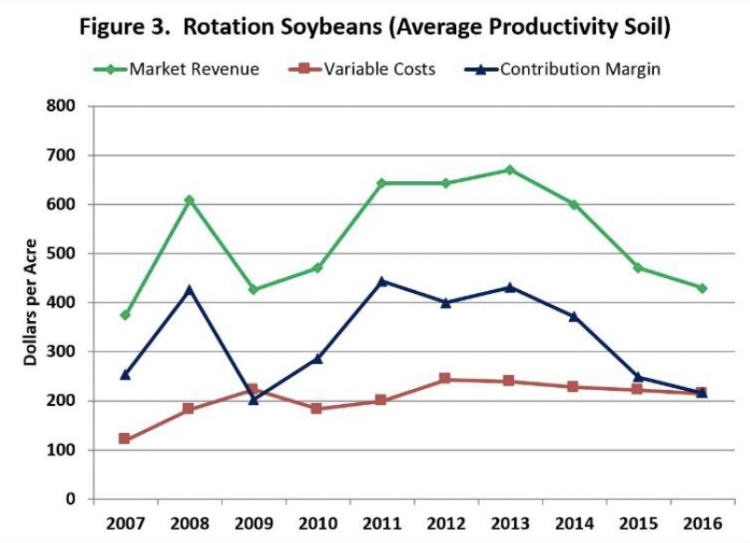
Figure 3. Rotation Soybeans (average productivity soil)
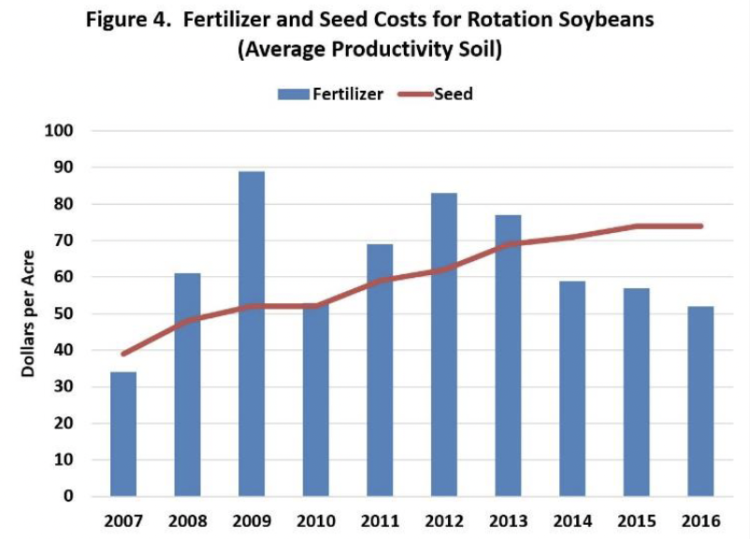
Figure 4. Fertilizer and Seed Costs for Rotation Soybeans (average productivity soil)
From 2010 to 2013, the contribution margin for rotation corn was higher than the contribution margin for rotation soybeans. The average difference in the contribution margin was approximately $50 per acre during this period. The relative attractiveness of corn during the last few years, encouraged many producers to plant relatively more corn than soybeans The situation in 2014, 2015, and 2016 is considerably different. Soybeans had a relatively higher contribution margin in 2014 and 2015. For 2016, rotation soybeans are expected to have a contribution margin that is approximately $45 per acre higher than the contribution margin for corn. Given the expected change in the relative attractiveness of corn and soybeans, producers should carefully budget both crops.
In the long-run, in addition to covering variable costs, producers need to cover the overhead costs associated with machinery, family and hired labor, and rent. Even if a producer does not hire labor or rent land, they need to consider the opportunity costs associated with these items, which can be estimated by answering the following questions. What is the value of family labor if it was employed off the farm? Similarly, what could the land that I own be rented for?
The residual remaining after subtracting variable costs and overhead costs, which include the opportunity costs associated with family labor and owned land, from market revenue and government payments is called “earnings” in the Purdue Crop Cost and Return Guide. Over the long-run, we would expect the average earnings per acre to gravitate towards zero. Figure 5 presents earnings per acre for a farm with 3000 crop acres that utilizes a corn/soybean rotation. From 2007 to 2015, earnings per acre ranged from a negative $102 in 2015 to $212 in 2011. Earnings per acre are expected to be a negative $135 per acre in 2016, well below the ten-year average of $48 per acre.
In summary, margins will remain very tight in 2016. This increases the importance of carefully scrutinizing input and crop decisions. Producers are encouraged to create crop budgets and in general improve their record keeping. Lower crop margins will adversely affect a farm’s
![]()
![]()
![]()
![]()
![]()
