2018 Indiana Farmland Values – Up, Down, & Sideways
August 1, 2018
PAER-2018-10
Author: Craig Dobbins, Professor of Agricultural Economics
![]()
![]()
![]()
![]()
![]()
The direction of change in Midwest farmland value has been a challenge to discern. In Iowa, the December 20177 report indicated the average value of farm- land had stopped declining and increased 2% from 2016. The March 2018 Nebraska report indicated the average market value of farmland declined by 3% compared to the year earlier value. The February 2018 Minnesota report showed a statewide farmland sales prices declined by 8%. The quarterly report by the Chicago Federal Reserve Bank issued May 2018 indicated a 1% decline in Illinois for the period of April 1, 2017 to April 1, 2018. This survey reported a 3% increase for this period in Indiana, a 2% increase in Iowa, and a 3% increase in Wisconsin. For the entire district, farmland values were stable.
These reports illustrate your experience with changes in farmland values is likely to depend on where you are located. The 2018 Purdue Farmland Value Survey1 also indicates a mixture of increases and decreases in Indiana farmland values and cash rents.
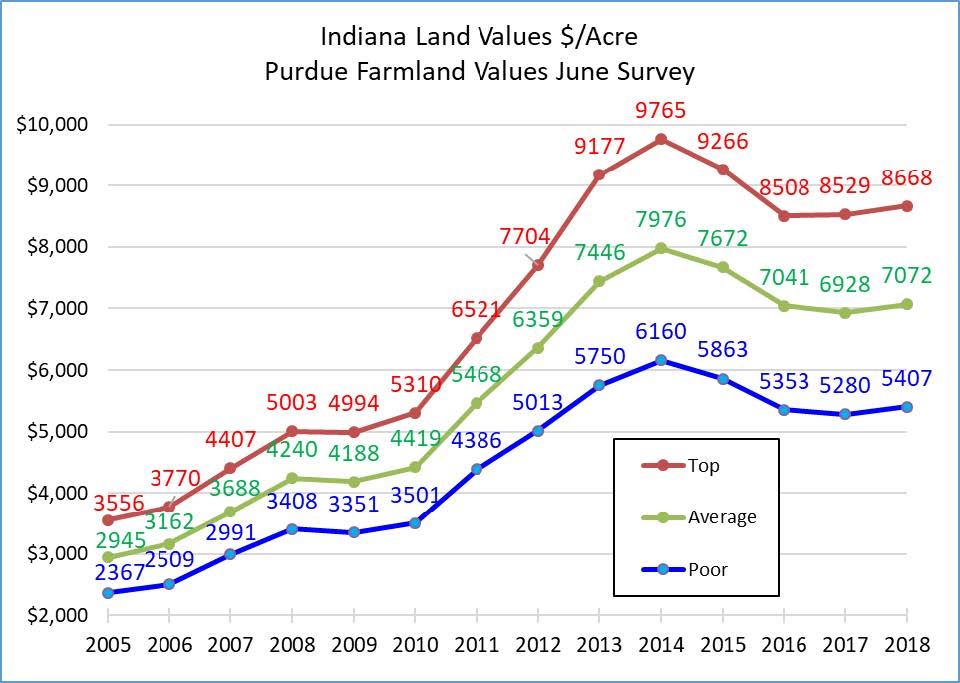
On a statewide basis, June year-to-year farmland value comparisons indicate an uptick for top, average, and poor quality farmland. For the state as a whole, the strongest percent increase was for poor land, increasing 2.4%. Top and average quality farmland rose by 1.6% and 2.1%, respectively (Table 1). Rounding these changes to the nearest percent indicates a 2% statewide increase for each land quality. If one is willing to associate the word modest with these increases, these results indicate the downward adjustment in farmland values may be over.
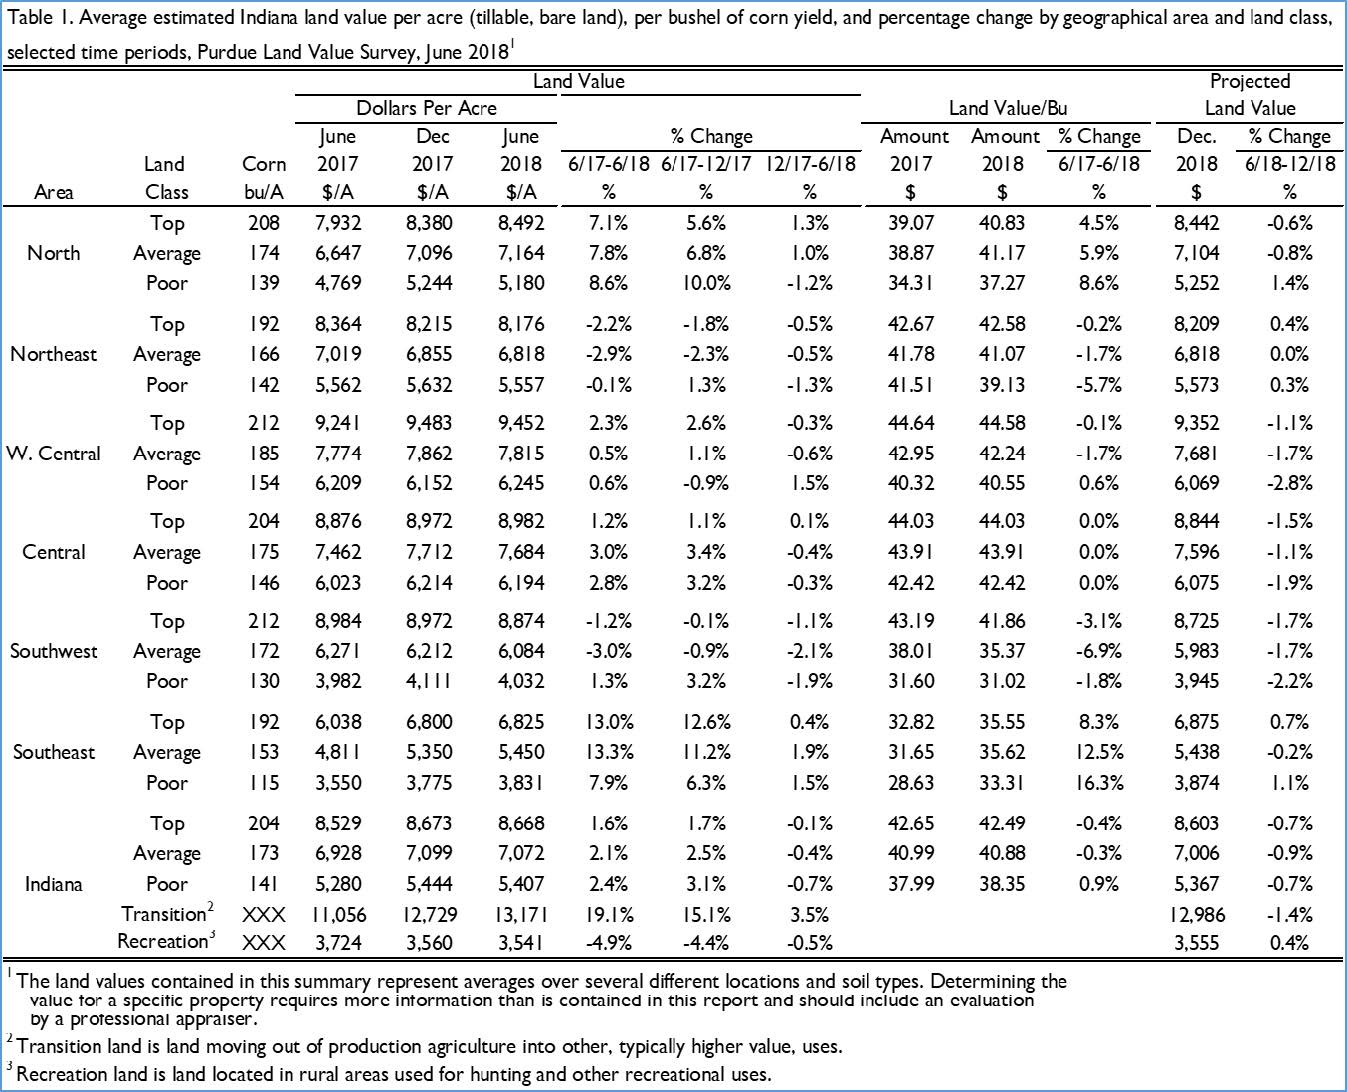
The 2018 changes in farmland values across regions of the state and quality of farmland was a mixture of increases and decreases. Statewide top quality land had a value of $8,668 per acre, average quality land had a value of $7,072 per acre and poor quality land had a value of $5,407 per acre.
The Northern and Southeast regions (Figure 1) reported renewed strength in farmland values.
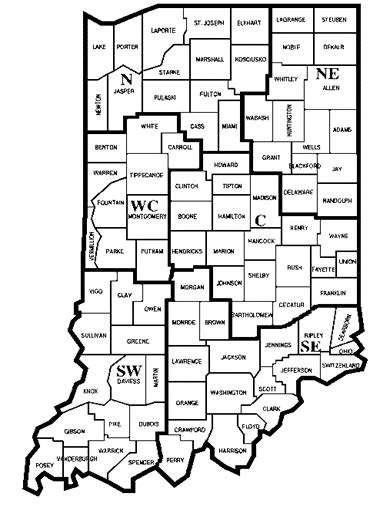
Figure 1. County clusters used in Purdue Land Value Survey to create geographic regions
For the June-to-June period, farmland value increases ranging from 7.1% to 13.3%. In the North region, poor quality farmland had the largest percentage in- crease. Poor quality farmland in the North region increased by 8.6% to $5,180 per acre. Top quality farm- land increased by 7.1% to $8,492 and average quality farmland increased by 7.8% to $7,164 per acre. In the Southeast region, average quality farmland had the largest percentage increase. In the Southeast region, average quality farmland increased by 13.3% to $5,450 per acre. Top quality farmland increased by 13% to $6,825 and poor quality farmland increased by 7.9% to $3,831 per acre.
The West Central and Central regions also had in- creases across all land qualities but they were more modest than the increases in the North and Southeast. For the West Central and Central region, the increase in farmland values ranged for 0.5% to 3.0%. In West Central Indiana, top quality farmland increased by 2.3% to $9,452 per acre, average quality land increased 0.5% to $7,815, and poor quality land increased 0.6% to $6,245. For the Central region, top quality farmland increased by 1.2% to $8,982 per acre, average quality land increased 3.0% to $7,684, and poor quality land increased 2.8% to $6,194.
For the Northeast region, declines in farmland values ranged from 0.1% to 2.9%. Top quality, average quality, and poor quality farmland declined by 2.2%, 2.9%, and 0.1%, respectively. The per acre value for top, average, and poor quality farmland in the North- east was $8,176, $6,818, and $5,557, respectively.
In the Southwest, farmland values were a mixture of increases and decreases. The value of top quality farmland declined 1.2% to $8,874 per acre and average quality farmland declined 3.0% to $6,084 per acre. Poor quality land increased 1.3% to $4,032.
For areas with increasing farmland values, the increases appear to have occurred between June 2017 and December 2017. For this period, there were more positive changes than negative changes. For December 2017 to June 2018, the percent increases were smaller. There were also farmland value decreases. The later period had a larger number of negative changes than positive changes.
Historically the highest farmland values have been in the West Central region. For 2018, this continues to be true. Top quality land was $9,452 per acre. Average and poor quality farmland was $7,815 and $6,245, respectively. The next highest region was the Central region. The least expensive farmland continues to be in the Southeast region.
Per acre farmland values adjusted for productivity provides an estimate of farmland cost per unit of productivity. The unit of productivity used was an estimate of long-term corn yield. Dividing per acre values by long run yields provides the value or cost of farmland per bushel. Based on this cost measure, the highest priced farmland remains in the West Central and Central regions. The per bushel farmland cost for these two regions varied from $40.55 to $44.58 per bushel, a difference of $4.03 per bushel. After the West Central and Central regions, the next most expensive regions were the North, Northeast, and the Southwest. For these regions, the cost of farmland per bushel ranged from $31.02 to $42.58. In the Southeast, the per bushel cost across farmland quality ranged from $33.31 to $35.62.
Comparing each region across farmland quality, the smallest difference between the high and low cost per bushel was $1.61 in the Central region. The South-east had a difference of $2.31 the Northeast a difference of $3.45, the North a difference of $3.90, the West Central a difference of $4.03, and the South- west a difference of $10.84.
To gain insight into changes the future may hold, survey respondents projected the expected December 2018 value of farmland. For the whole state, respondents expect farmland values to decline slightly. Declines of 0.7%, 0.9%, and 0.7% were forecast for top, average, and poor quality land, respectively.
In the West Central, Central, and Southwest declines in value are expected across all land qualities. Respondents expect these changes to be small, ranging from a decline of 1.1% to 2.8%.
The North and Southeast regions have a mixture of increases and decreases. In the North, top and average quality farmland is expected to decline 0.6% and 0.8%, respectively. Poor quality land in the North is expected to increase 1.4%. In the Southeast, average quality land is expected to decline 0.2% and top and poor quality land is expected to increase 0.7% and 1.1%, respectively.
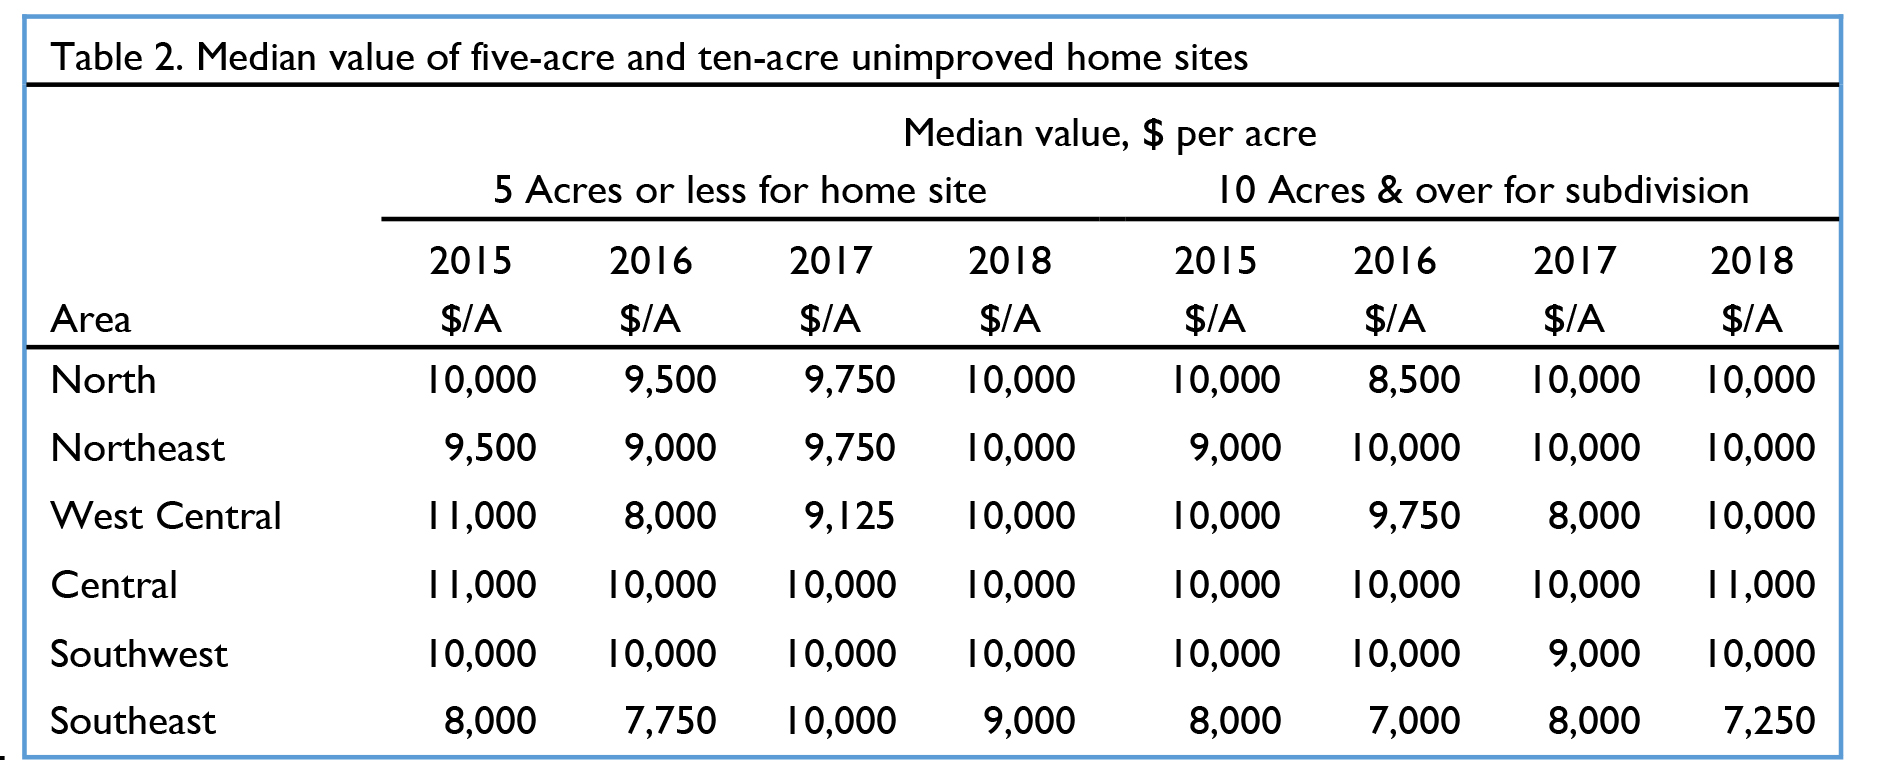
In addition to the economic profitability of production agriculture, many nonfarm factors influence farmland values. One of these nonfarm factors is the demand for additional commercial and residential development. Information about the value of farmland moving out of production agriculture into commercial and residential uses (transition land) was also gathered. The June statewide average value of transition land in- creased to $13,171 per acre. From the previous June, this was an increase of 19.1%. The strength of the general economy likely is a major positive influence associated with this change. The statewide average value of recreational land declined in 2018 from $3,724 in June 2017 to $3,541, in June 2018, a decrease of 4.9%.
A characteristic of the transition and recreation markets is a very wide range of values in which location plays an important role in the value of the property. In markets of this type, the median value (the value dividing a series of ordered numbers in half) can give additional information about the central tendency of the farmland values distribution. The statewide median for transition land values was $10,500 per acre. The statewide median for recreational land values was $3,500.
Another nonfarm influence effecting farmland values is the demand for rural home sites. Respondents estimated the value of rural home sites located on a blacktop or well-maintained gravel road with no accessible gas line or city utilities. Like transitional farmland and recreational farmland, these properties have a very wide range in value. Because of the wide range, median values are reported (Table 2). The median value for five-acre home sites ranged from $9,000 per acre in the Southeast region to $10,000 per acre in the all other regions. The value of $10,000 per acre was commonly reported as the median for larger tracts (10 acres). The North, Northeast, West Central, and Southwest region all had a median of $10,000 per acre. In the Central region, the median value was $11,000 per acre. In the Southeast region, the median value was $7,250 per acre for 10-acre parcels.
Farmland Market Forces
Respondents evaluated the importance of eleven market forces having the potential to influence the farm- land market. These forces included: 1) current net farm income, 2) expected growth in returns to land, 3) crop price level and outlook, 4) livestock price level and outlook, 5) current and expected interest rates, 6) returns on alternative investments, 7) outlook for U.S. agricultural export sales, 8) U.S. inflation rate, 9) current supply of land for sale, 10) cash liquidity of buyers, and 11) current U.S. agricultural policy.
Respondents used a scale from -5 to +5 to indicate the effect of each item on farmland values. A negative influence is given a value from -1 to -5, with a -5 being the strongest negative influence. A positive influence is given a value between 1 and 5, with 5 representing the strongest. An average for each item was calculated. To provide a perspective of the change in these influences across time, data from 2016, 2017, and 2018 are included in Figure 2. The horizontal axis shows the item from the list above.
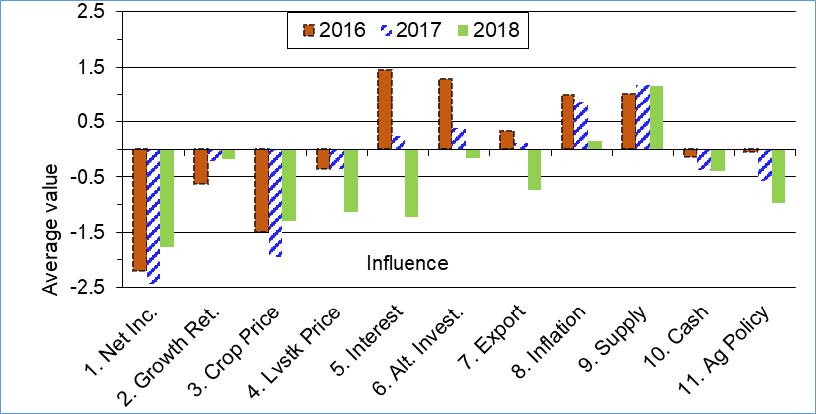
Figure 2. Influence of eleven drivers of Indiana farmland values in 2018
For 2018 there were only two positive influences found, the inflation rate and the current supply of farmland for sale. Given the continued low grain prices and net farm in- come over the period of 2016, 2017, and 2018, it is not surprising respondents placed a negative influence on net farm income, expected growth in returns, crop prices, and livestock prices. Respondents have become less negative about net income (#1), the expected growth in returns to land (#2), and crop prices (#3). The cyclical nature of production agriculture may influence the less negative influence of these factors. Low prices signal the need for a smaller supply and over time supply does decline helping to increase price. The passage of time also allows producers to reduce the per unit cost of production. The improved assessment of expected farmland return may indicate margin pressure is lessening.
The influence of livestock prices, interest rates, ex- ports and agricultural policy have stronger negative influences in 2018. Livestock prices (#4) have had small negative influences in prior years. Producer losses in the dairy industry and concerns about profit- ability in the pork and beef industries have likely contributed to increasing the negative view of livestock prices.
Interest rates (#5) show a major shift in direction. In 2016 interest rates had a positive influence of nearly 1.5. In 2018, it is nearly a negative 1.5. While there has been concern about possible increases in long term interest rates for some time, actual increases combined with the Federal Reserve Bank’s announced plans to continue pushing interest rates up appears to have raised interest rate concerns.
Another noticeable change is the influence of exports (#7). The rhetoric about the unfairness of trade agreements seems to have shifted to a trade war. The actions that will be taken, outcomes associated with possible actions, and how long the trade war will continue are creating a great deal of uncertainty for agriculture. How will the buyers and sellers of farmland respond given the shift from a world trade policy focused on finding new markets and reducing barriers in existing markets to one focused on erecting barriers?
The last noticeable change is the perceived negative influence of agricultural policy (# 11). As someone required to read and study work of other agricultural economists about the market distortions caused by government price support programs and how these distortions were capitalized in to farmland values, finding agricultural policy is now perceived to have a negative influence will likely require, if correct, a change in thinking.
Over the last few years the supply of farmland on the market has been an often-listed reason for why farmland values have not declined further.
When asking respondents to compare the amount of farmland on the market this year compared to last year 45% of the respondents indicated less. This is the third year the response of less has been received from a large percent of the respondents (Figure 3).
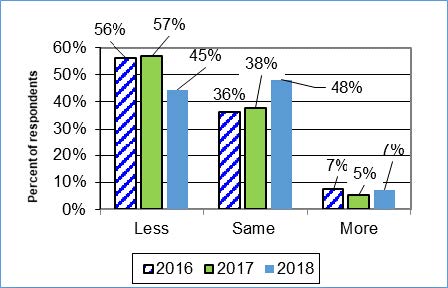
Figure 3. Percentage of respondents indicating less, same, or more farmland on the market than in the previous June
Those respondents saying the same amount of farmland on the market as last year was 48%. Given the last three years, even a same response this year is likely to mean the amount of farmland on the market today is less than in 2015.
Only 7% of the respondents said the amount of land on the market was more this year than last.
It is common to compare the current downturn in farmland values with the downturn of the 1980s. One of the significant differences between these two downturns is there was an increase in farmland on the market during the 1980s downturn.
Five-Year Forecasts
Respondents were asked to forecast the five-year average corn price, soybean price, mortgage interest rate, inflation rate, and finally the change in farmland value. The price and rate estimates for the past five years are presented in Table 3. Respondents estimated the 5-year average per bushel price of corn in 2014 would be $4.70. The market realities of 2014 and 2015 resulted in a significant downward revision in 2015. The 2016 corn price was similar to 2015 suggesting a bottom for the 5-year average may have been reached. However, 2017 resulted in another 26¢ decline. The 5-year corn price estimate for 2018 in- creased by $0.18 to $3.97.
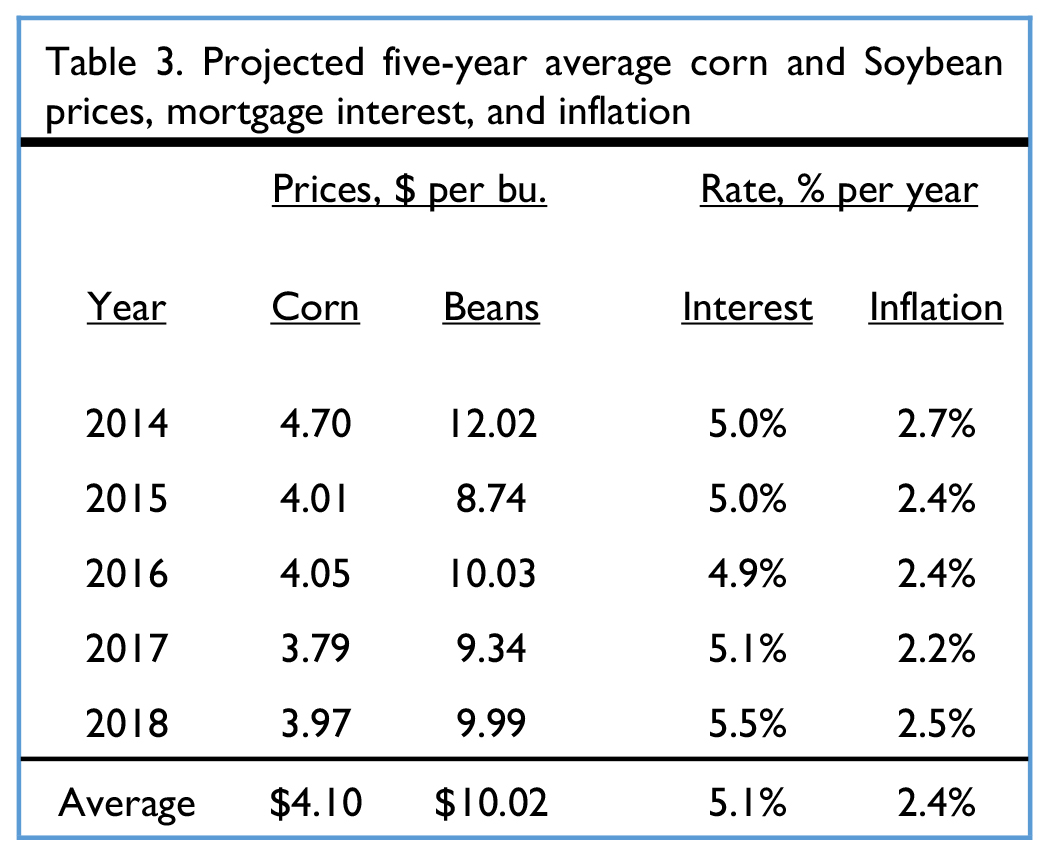
Estimates of the 5-year average soybean price have been down and up. Like corn, the 5-year average soy- bean price started high at just over $12.00 per bushel in 2014. Lower soybean prices in 2014 and 2015 led to a downward revision to the five-year estimate in 2015.
Renewed strength in soybean prices resulted in an upward revision in 2016 to $10.03. There was a 69¢ decline in the 5-year average soybean price in 2017. The 5-year average price in soybean price rebounded again this year.
Stability is the word that applies to the 5-year estimates of interest and inflation rates. With a 2018 average mortgage interest rate of 5.5%, respondents are revising their interest rates upward, but it does not appear they are expecting a substantial increase. Inflation rate expectations increased in 2018 but they are still lower than what was expected in 2014.
Where do respondents expect farmland values to be in five years given these estimates? As expected, there is much less consensus about where farmland values will be in five years than when asking for 2018 year-end estimates. When comparing the three choices of higher farmland prices, lower farmland prices, or farmland prices that are similar to current values, higher farmland prices was the largest group, 52% of the respondents. The next largest group is respondents that expect farmland values in five years to be the same as today (30%). There could be ups and downs over five years, but in five years the value will be about where it is today. The final group is the group of respondents expecting farmland values to be lower in five years (18%).
If you anticipate farmland values will be higher than today, over half of the respondents agree with you. History also supports this view of future farmland values. However, when respondents were asked how much higher farmland land values would be in five years, the group average was 6.8%. By historical standards, a 6.8% increase in farmland values over five years is a very modest increase.
However, a pessimist may look at history and conclude that historically having farmland values at the same or lower value in five years is rare. This might indicate respondents seeing no change or a decline in farmland values in five years have a sense something important has shifted in the farmland market. Combining no change and value decline groups means 48% of the respondents are expecting an outcome in the Indiana farmland market that historically rarely happens.
What might lie ahead for the farmland market? Crop production margins continue to be under pressure. Recent price trends seem to say this margin pressure is likely to continue. Shifting away from a trade policy designed to encourage exports to one designed to create barriers, is not a supportive policy for the agricultural industry and farmland prices. Likewise, continuation of a support price program that does not provide relief during periods of chronically low prices is not supportive of farmland prices. A strong general economy leading to rising long term interest rates creates an even stronger head wind for rising farmland prices.
However, to have a sale someone must be willing to sell. How many sellers will be willing to accept a price lower than last year. Reducing the supply of farmland on the market even further might keep farmland values from declining.
With many negative and few positive forces currently in the farmland market, it seems more likely farmland values will be lower in June 2019. Time will tell.
Cash Rent
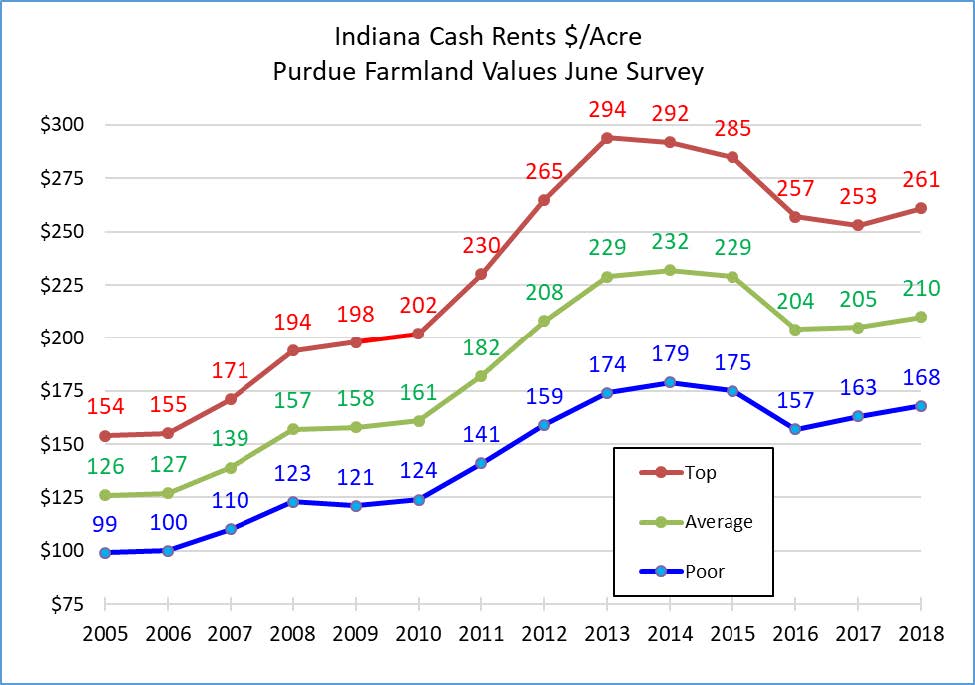
The 2015 survey was the first survey since 1999 to report a statewide decline in cash rents across all land qualities. This year is the first survey since the 2015 survey to report statewide increases in cash rent across all classes of farmland quality.
This year, top quality farmland had a cash rent of $261 per acre, an increase of 3.2% (Table 4). Aver- age quality land had a cash rent of $210 per acre, an increase of 2.4%. Poor quality land had a cash rent of $168 per acre, an increase of 3.1%. In dollars per acre, this was an increase of $8, $5, and $5 for top, average and poor farmland, respectively.
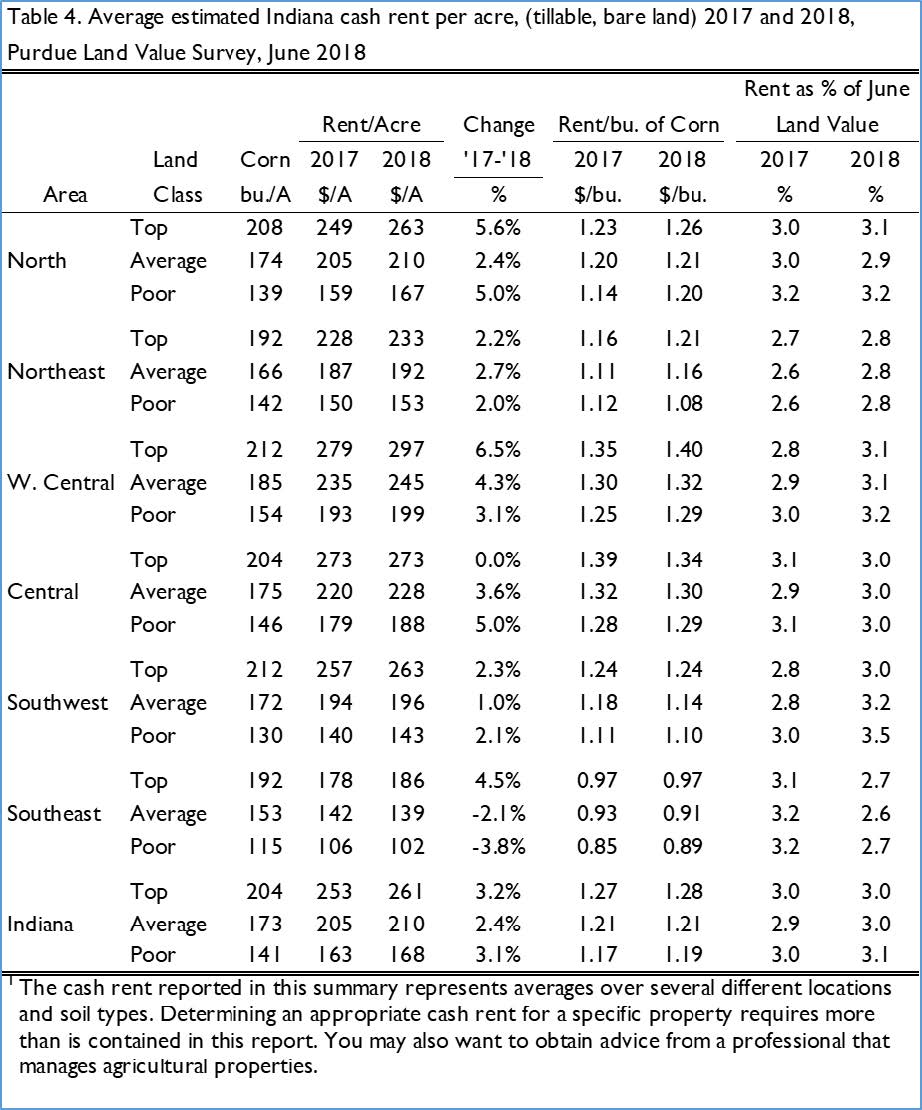
Comparing regional cash rent changes, an increase occurred in all regions. The Southeast reported a cash rent increase for top quality land of 4.5%. Cash rents for average and poor farmland declined. In the Central region, there was an increase of 3.6% for average quality farmland and 5% increase for poor quality farmland. Cash rent for top quality farmland did not change. For the other regions, cash rent increases ranged between 1% and 6.5%. Across farmland quality, the strongest cash rent increase occurred in the West Central region, ranging from 3.1% to 6.5%. The North followed with a range of 2.4% to 5.6%. The Northeast and Southwest regions had similar cash rent increases ranging from 1.0% to 2.7%
The only declines in cash rent for 2018 were in the Southeast region where average quality farmland declined 2.1% and poor quality farmland decline 3.8%.
As with farmland values, the West Central region consistently has the highest cash rents. In 2018, top quality farmland averaged $297 per acre, average quality farmland averaged $245 per acre, and poor quality land averaged $199 per acre. The region with the second highest cash rent was the Central region followed by the North, Southwest (except for poor quality farmland), Northeast, and Southeast region.
Statewide cash rent per bushel stayed the same or increased. Statewide top quality farmland cash rent increased from $1.27 to $1.28 per bushel. Cash rent per bushel of corn for poor quality farmland increased from $1.17 to $1.19. Average quality farm- land cash rent stayed at $1.21 per bushel of corn. Cash rent per bushel of corn increased for all land qualities in the North, and West Central regions. The Northeast, Central, Southwest, and Southeast regions were a combination of increases and decreases.
The difference in cash rent per bushel across land quality continues to be small. For the state as a whole, the difference across farmland quality is only $0.09 per bushel.
The largest regional difference in cash rent per bushel across land quality was $0.14 in the Southwest region and $0.13 in the Northeast. The smallest was $0.05 and $0.06 in the Central and North region, respectively.
On a statewide basis, rent as a percent of land value remains around 3% (Table 4 and Figure 4). This is the fifth year in a row the relationship between gross cash rent and farmland value has been approximately 3%. From 1985 through 2014, this value steadily declined. This decline is likely associated with the decline of long term interest rates during this same period.
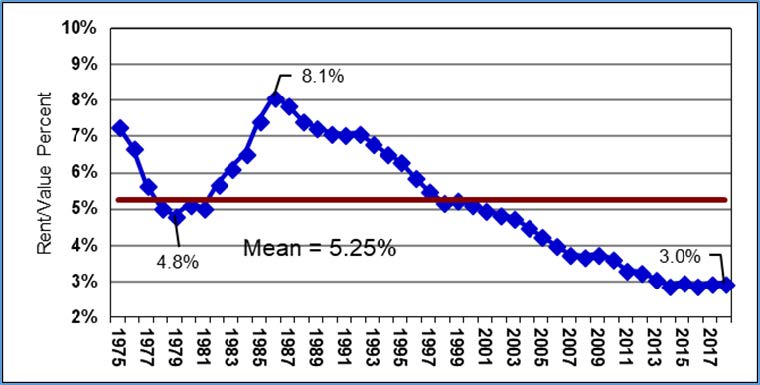
Figure 4. Gross cash rent for average quality farmland divided by value of average value of average quality farmland, 1975 – 2018
Both long term interest rates and rent as a percentage of farmland value have paused. What does the future hold? At this time, further declines in long term inter- est rates do not seem likely. Long term interest rates could remain stable at current levels, but the most popular scenario seems to be a gradual increase in long-term interest rates.
If long term interest rates rise, it is likely cash rent divided by farmland value will follow. What would cause cash rent as a percent of farmland values to rise? Here are a few possibilities: 1) cash rents could increase more than farmland values, 2) farmland values could remain at current levels while cash rent in- creases, 3) cash rent could remain at the current level and farmland values decline, and 4) other combinations. As you consider the management of your business, does it matter which alternative emerges?
Expected Changes in 2019 Cash Rent
Information was presented previously about expected corn and soybean prices, mortgage interest rates, the rate of inflation, and their influence on farmland values. These items also influence cash rent. Respondents were asked if they expected 2019 cash rents to be higher, the same, or lower. If they expected an increase or decrease, they were asked to indicate the percentage change. Just over half, 51%, of the respondents expect cash rents to be the same in 2019. Those anticipating an increase in 2019 cash rent accounted for 22% of the respondents. The average increase for this group was 6.8%. Those anticipating a decline in 2019 cash rent accounted for 27% of the respondents. The average decline for this group was 6.4%. Combining all three groups provides an overall average decline in the 2019 cash rent of 0.2%
The 2018 survey reported an increase in several cash rents. Given the continued tight margins putting pressure on producers to lower per unit production cost, the size of some of the cash rent increases is surprising. The overall expectation of survey respondents is for flat cash rent in 2019, but a group of respondents would not be surprised to see an increase of nearly 7% in cash rent. Given the June price declines in corn and soybeans and other June events, rising cash rent seems overly optimistic. Stable cash rent or slight declines seem more likely. Again, time will tell.
1 This information is a summary of data collected June 2018 as part of the Purdue Farmland Value Survey.
Purdue Farmland Value and Cash Rent Survey
The Purdue Farmland Value and Cash Rent survey is conducted each June. The survey is possible through the cooperation of numerous professionals knowledgeable of Indiana‘s farmland market. These professionals include farm managers, rural appraisers, land brokers, agricultural loan officers, Purdue Ex- tension educators, farmers, and representatives of the Farm Service Agency (FSA) county offices. These professionals were selected because their daily work requires they stay well informed about farmland values and cash rents.
These professionals provide an estimate of the market value for bare poor, average, and top quality farmland in December 2017, June 2018, and a fore- cast value for December 2018. To assess the productivity of the farmland, respondents provide an esti- mate of long-term corn yield. Respondents also pro- vide a market value estimate for land transitioning out of agriculture and recreational land.
We express a special appreciation to the support staff of the Department of Agricultural Economics. Tracy Buck coordinated survey mailings and handled data management. Without her capable assistance, the survey would not have happened.
The data reported here provide general guidelines regarding farmland values and cash rent. To obtain a more precise value for an individual tract, contact a professional appraiser or farm manager that has a good understanding of the local situation.
Prior reports are located at: https://ag.purdue.edu/agecon/Pages/Purdue-Agricultural-Economics-Report-Archive.aspx
![]()
![]()
![]()
![]()
![]()
