2019 Indiana Farmland Values and Cash Rents Slide Lower
August 5, 2019
PAER-2019-09
Author: Craig Dobbins, Professor of Agricultural Economics
![]()
![]()
![]()
![]()
![]()
What an adventure 2019 has been. After many unexpected events during the first half of the year, I’m hoping for something more normal during the second half of 2019. Who would have thought corn and soybean planting would extend into late June?
News reports about the farmland market during the first half of the year called attention to the ability of top quality farmland to retain its value, while lower quality land seemed to be weakening But across all farmland qualities the limited supply of farmland for sale was pointed to as the primary reason for relative stability in farmland values. What is the situation and outlook in Indiana now?
Statewide the 2019 Purdue Farmland Value Survey indicates farmland values moved lower. June year-to-year farmland value comparisons indicate top quality farmland declined 5.3%, average quality farmland declined 0.9%, and the poor quality farmland decline was so small it resulted in a 0.0% change (Table 1).
The change in top quality farmland for June 2018 to December 2018 accounted for the largest part of the farmland value change. Average and poor quality farmland values in this period had small increases, a 1.0% increase for average quality farmland and a 3.3% increase for poor quality farmland. During the December 2018 to June 2019 period, top quality farmland continued to decline. Declines in value for average and poor quality land were large enough to offset the gains in the first six months. Average quality farmland declined 1.8% and poor quality farmland declined 3.2%. For the June 2018 to June 2019 period, top quality farmland declined $456 per acre, average quality farmland declined $61 per acre and poor quality farmland declined by $2 per acre.
There was a decrease in the value of transitional farmland from June 2018 to December 2018 but an increase from December 2018 to June 2019, leaving the year-to-year average value at $13,245. For the year, this was an increase of 0.6%. The average value of farmland moving into recreational uses increased $132 per acre, an increase 3.7%.
As is always the case, there are locational differences in farmland values. To explore locational differences, the state is divided into six regions (Figure 1).
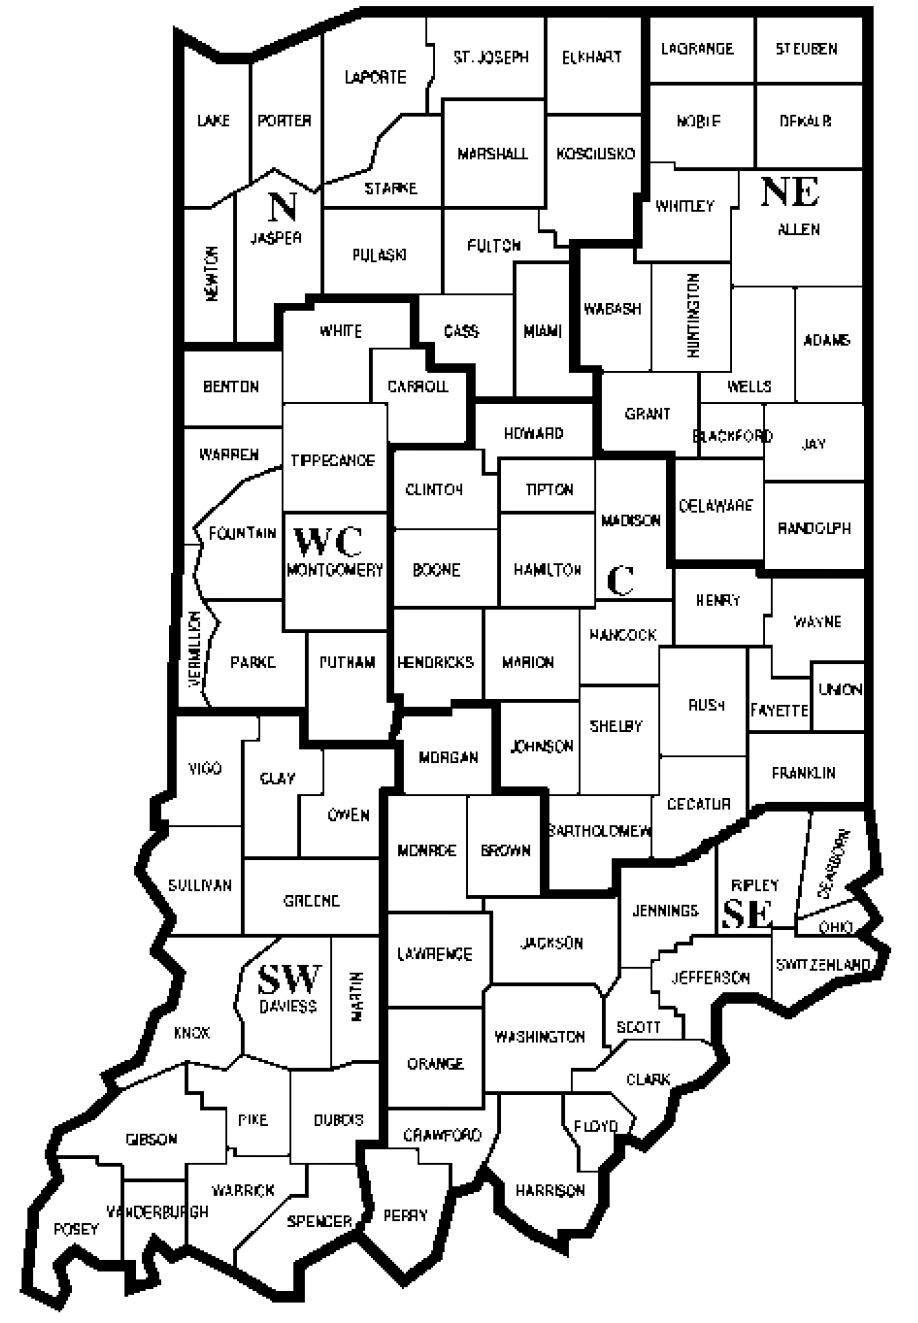
Figure 1. County clusters used in Purdue Land Value Survey to create geographic regions
For the June-to-June period, farmland value changes ranged from a decline of 15.6% to an increase of 9.3%. In the North, Northeast, and Southeast region, all land qualities declined. In the Southeast, average quality farmland had the largest decline followed by poor quality and top quality farmland.
In the West Central and Southwest regions, only top quality farmland declined in value. Average and poor quality farmland values for the year increased. In the Central region, top quality farmland and average quality farmland declined and poor quality farmland remained nearly the same with a decline of only $3.00 per acre.
In most cases, the largest changes in the region occurred in the first half of the year. In the West Central, Central, and Southwest regions, average and poor quality farmland had positive increases in farmland values the first half of the year but a decline in the last half of the year.
Historically the largest farmland values have been in the West Central region. For June 2019, this continued to be true. Top quality land was $9,178 per acre. Average and poor quality farmland was $7,851 and $6,318, respectively. The next highest region was the Central region. The least expensive farmland continues to be in the Southeast region with top, average, and poor quality land having values of $5,900, $4,600, and $3,268 per acre, respectively.
Per acre farmland values adjusted for productivity provides an estimate of farmland cost per unit of productivity. The unit of productivity used was an estimate of long-term corn yield. Each survey respondent provided a long-term yield estimate for each quality of farmland. The average of these yield estimates are the corn yields reported in Table 1.
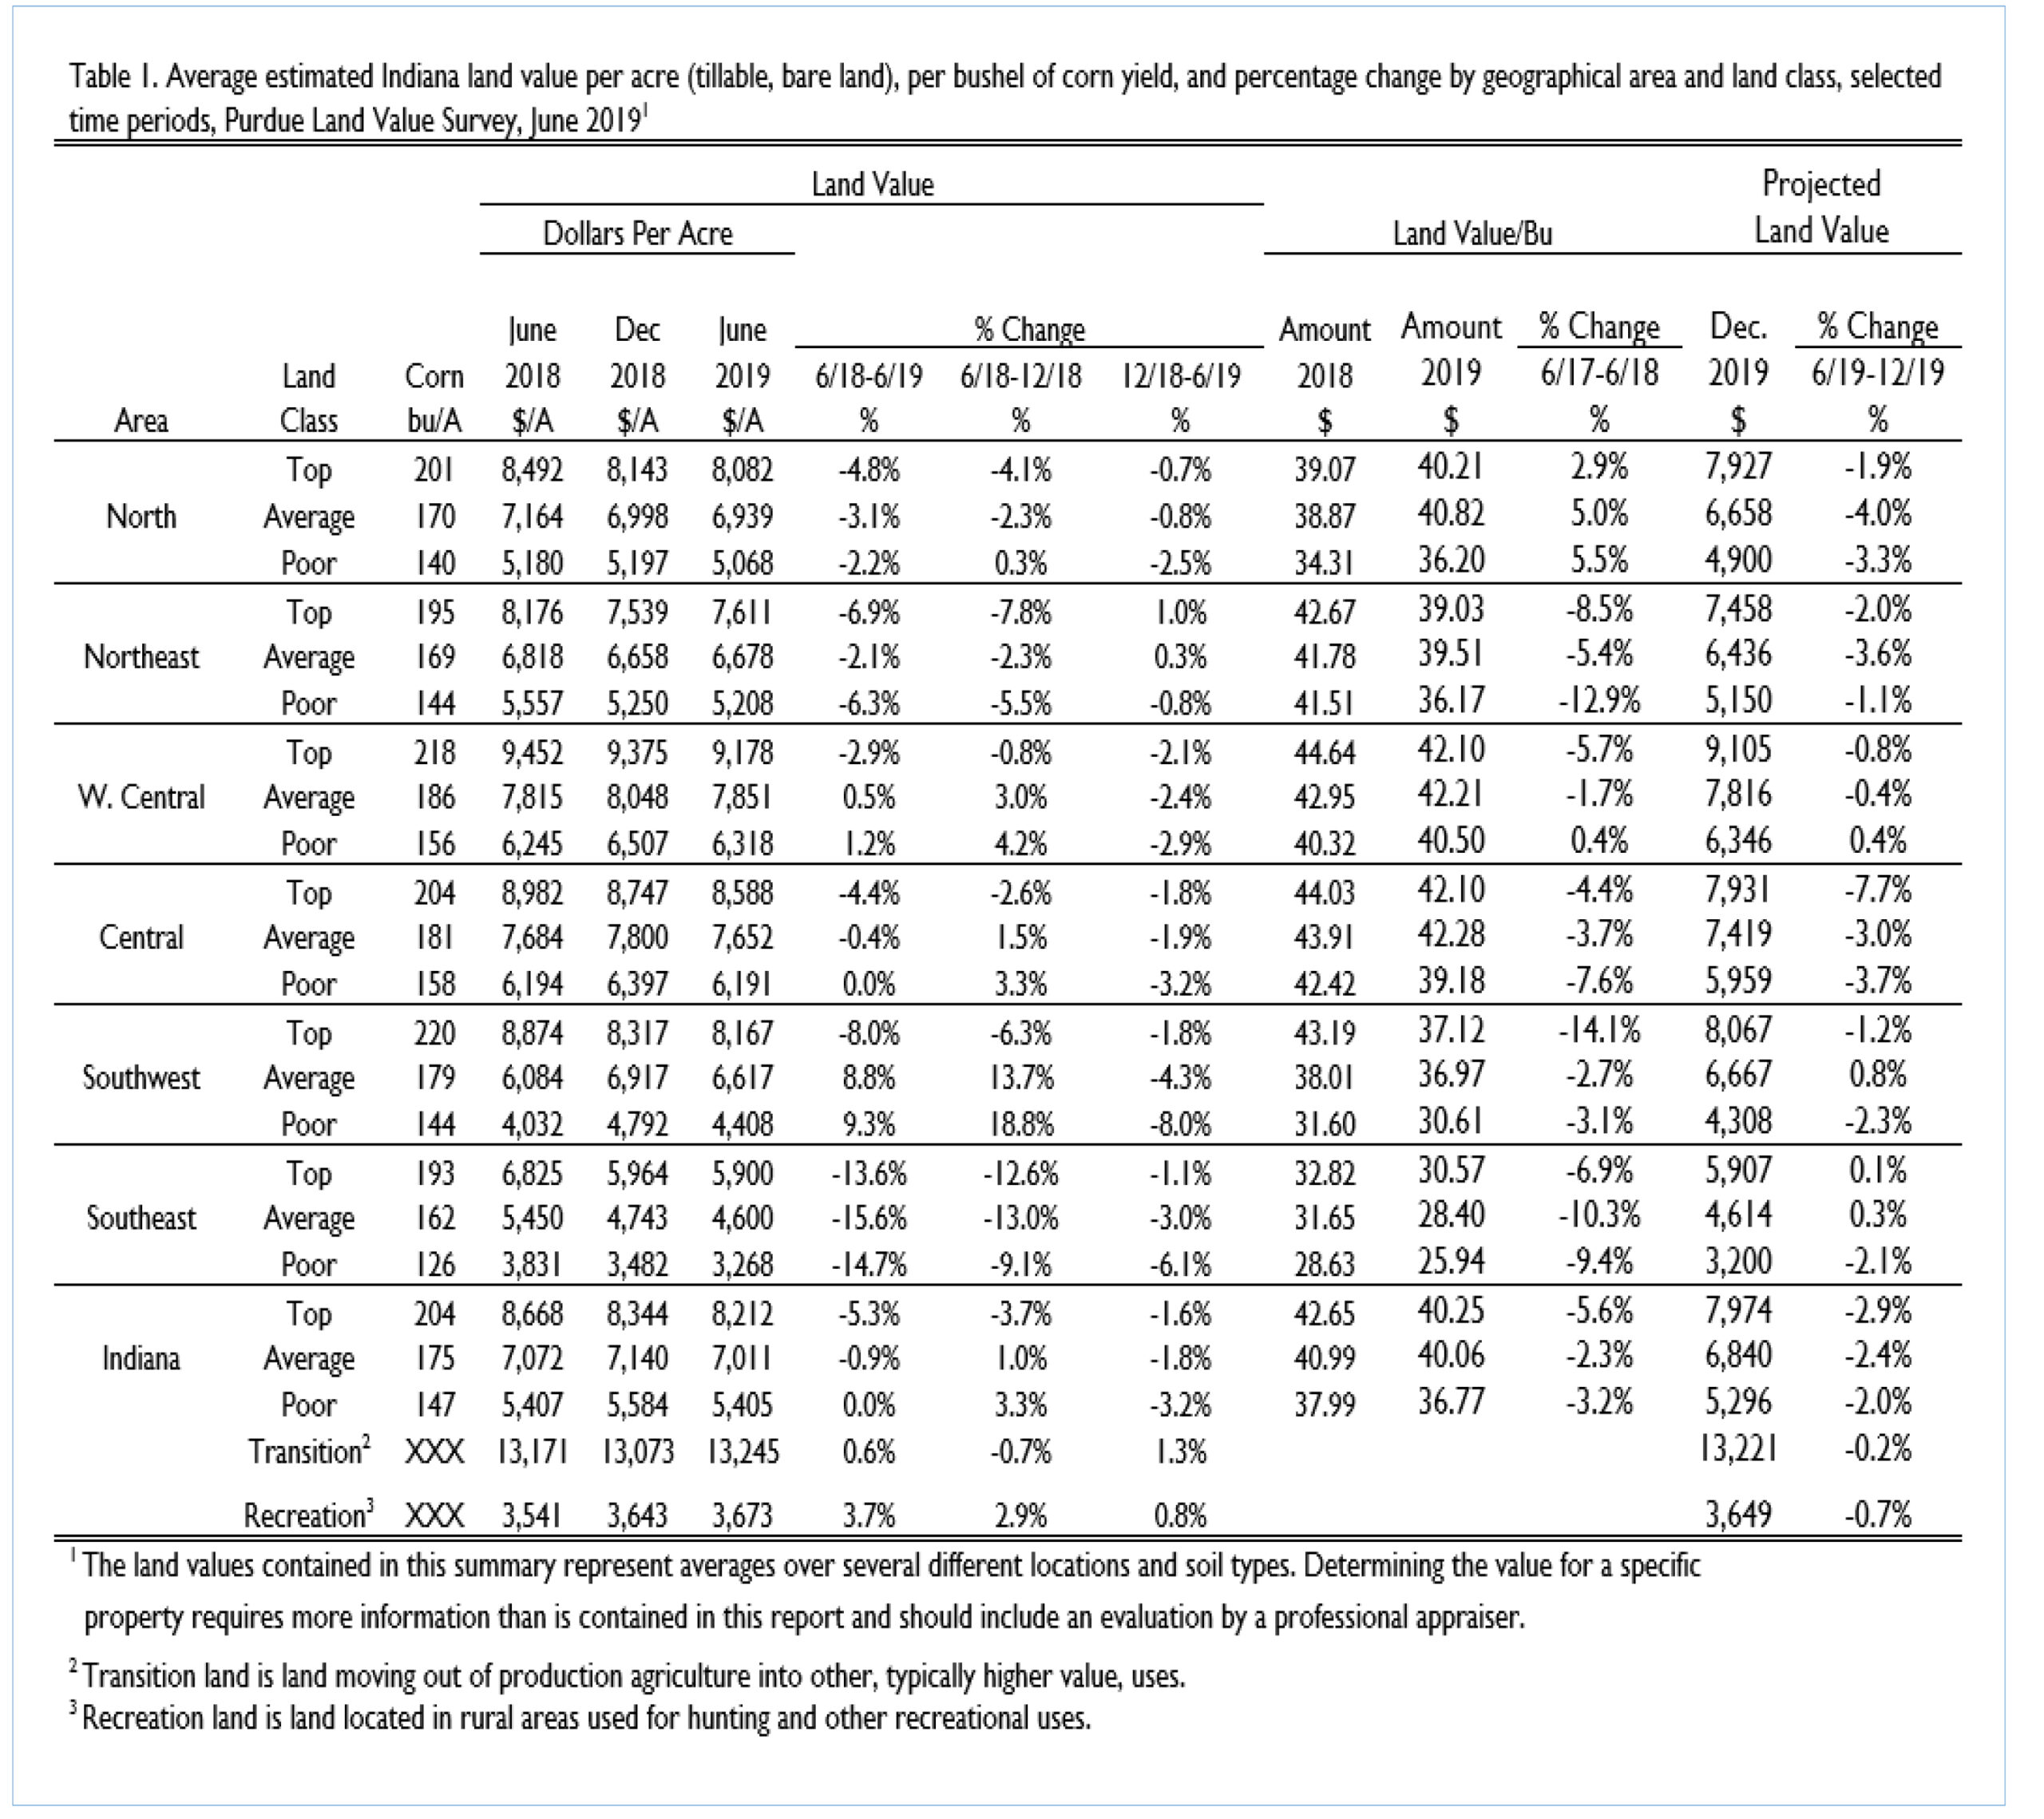
Table 1. Average estimated Indiana land value per acre (tillable, bare land), per bushel of corn yield, and percentage change by geographical area and land class, selected time periods, Purdue Land Value Survey, June 2019.
Dividing per acre values by long run yields provides the value or cost of farmland per bushel. Based on this measure of cost, the highest priced farmland continues to be in the West Central and Central regions. The per bushel farmland cost for these two regions varied from $39.18 to $42.28 per bushel, a difference of $3.10 per bushel. After the West Central and Central regions, the next most expensive regions were the North, Northeast, and Southwest. For these regions, the cost of farmland per bushel ranged from $30.61 to $40.82. In the Southeast, the per bushel cost across farmland quality ranged from $25.94 to $30.57.
Comparing each region across farmland quality, the smallest difference between the high and low cost per bushel was $1.71 in the West Central region. The Central had a difference of $3.10, the Northeast a difference of $3.34, the North a difference of $4.62, the Southeast had a difference of $4.63, and the Southwest a difference of $6.51.
To gain insight into changes the future may hold, survey respondents projected the expected December 2019 value of farmland. For the whole state, respondents expect farmland values to decline. Declines of 2.9%, 2.4%, and 2.0% were forecast for top, average, and poor quality land, respectively.
In the North, Northeast, and Central declines in value are expected across all land qualities. Respondents expect these changes to range from a decline of 1.1% to 7.7%. The West Central, Southwest, and Southeast regions have a mixture of increases and decreases. The expected change in value in these regions is small ranging from an increase of 0.8% to a decline of 2.3%.
The transition of Indiana farmland to nonagricultural commercial uses and residential developments has been an important market influence for several years. While the opportunity to sell farmland for nonfarm uses is location specific, this influence spreads though the market as the money obtained from such a sale is often invested in other agricultural farmland to avoid the payment of capital gain taxes. As noted earlier the value of farmland moving out of production agriculture (transition land) had a modest increase for the year.
The survey also collects information about the value of farmland moving into rural residences and subdivisions. Respondents estimated the value of rural home sites located on a blacktop or well-maintained gravel road with no accessible gas line or city utilities.
These markets are characterized by a very wide range of values. In markets of this type, the median value (the value dividing a series of ordered numbers in half) can give additional information about the central tendency of the farmland values distribution. The statewide median for home sites and subdivisions were both $10,000 per acre in June 2019.
Like transitional farmland and recreational farmland, these properties have a very wide range in value. Because of the wide range, median values are reported (Table 2). The median value for five-acre home sites ranged from $9,000 per acre in the Southwest region to $10,000 per acre in all other regions. The value of $10,000 per acre was commonly reported as the median for subdivision tracts (10 acres or more). The Northeast, West Central, Central, and Southeast region all had a median of $10,000 per acre. In the North region, the median value was $8,250 per acre. In the Southwest region, the median value was $15,000 per acre for 10-acre parcels.
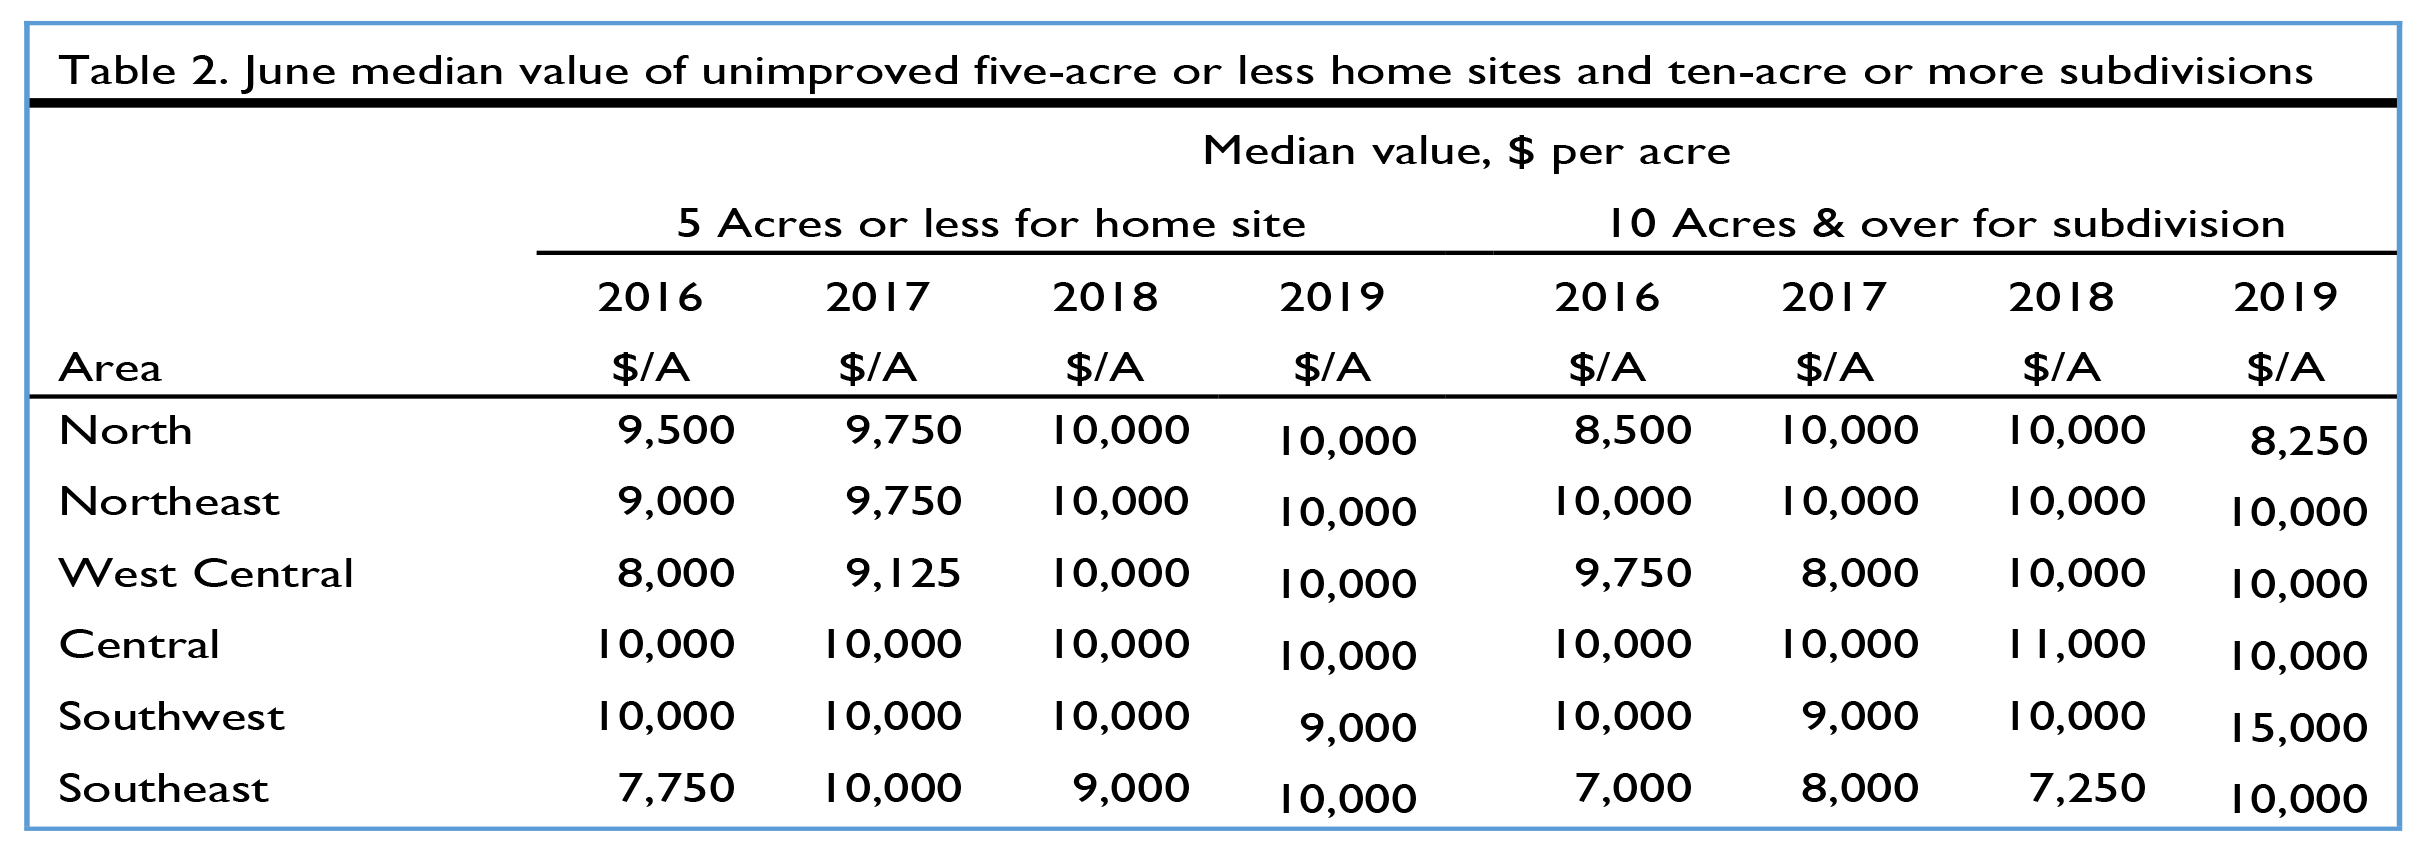
Table 2. June median value of unimproved five-acre or less home sites and ten-acre or more subdivisions
Farmland Market Forces
Respondents evaluated the importance of ten market forces having the potential to influence the farmland market. These forces included: 1) current net farm income, 2) expected growth in returns to land, 3) crop price level and outlook, 4) livestock price level and outlook, 5) current and expected interest rates, 6) returns on alternative investments, 7) outlook for U.S. agricultural export sales, 8) U.S. inflation rate, 9) cash liquidity of buyers, and 10) current U.S. agricultural policy.
Respondents used a scale from -5 to +5 to indicate the effect of each item on farmland values. A negative influence is given a value from -1 to -5, with a -5 being the strongest negative influence. A positive influence is given a value between 1 and 5, with 5 representing the strongest. Zero indicates the item was not an influence in the market. An average for each item was calculated. The averages from 2017, 2018, and 2019 are included in Figure 2. The horizontal axis shows the item from the list above.
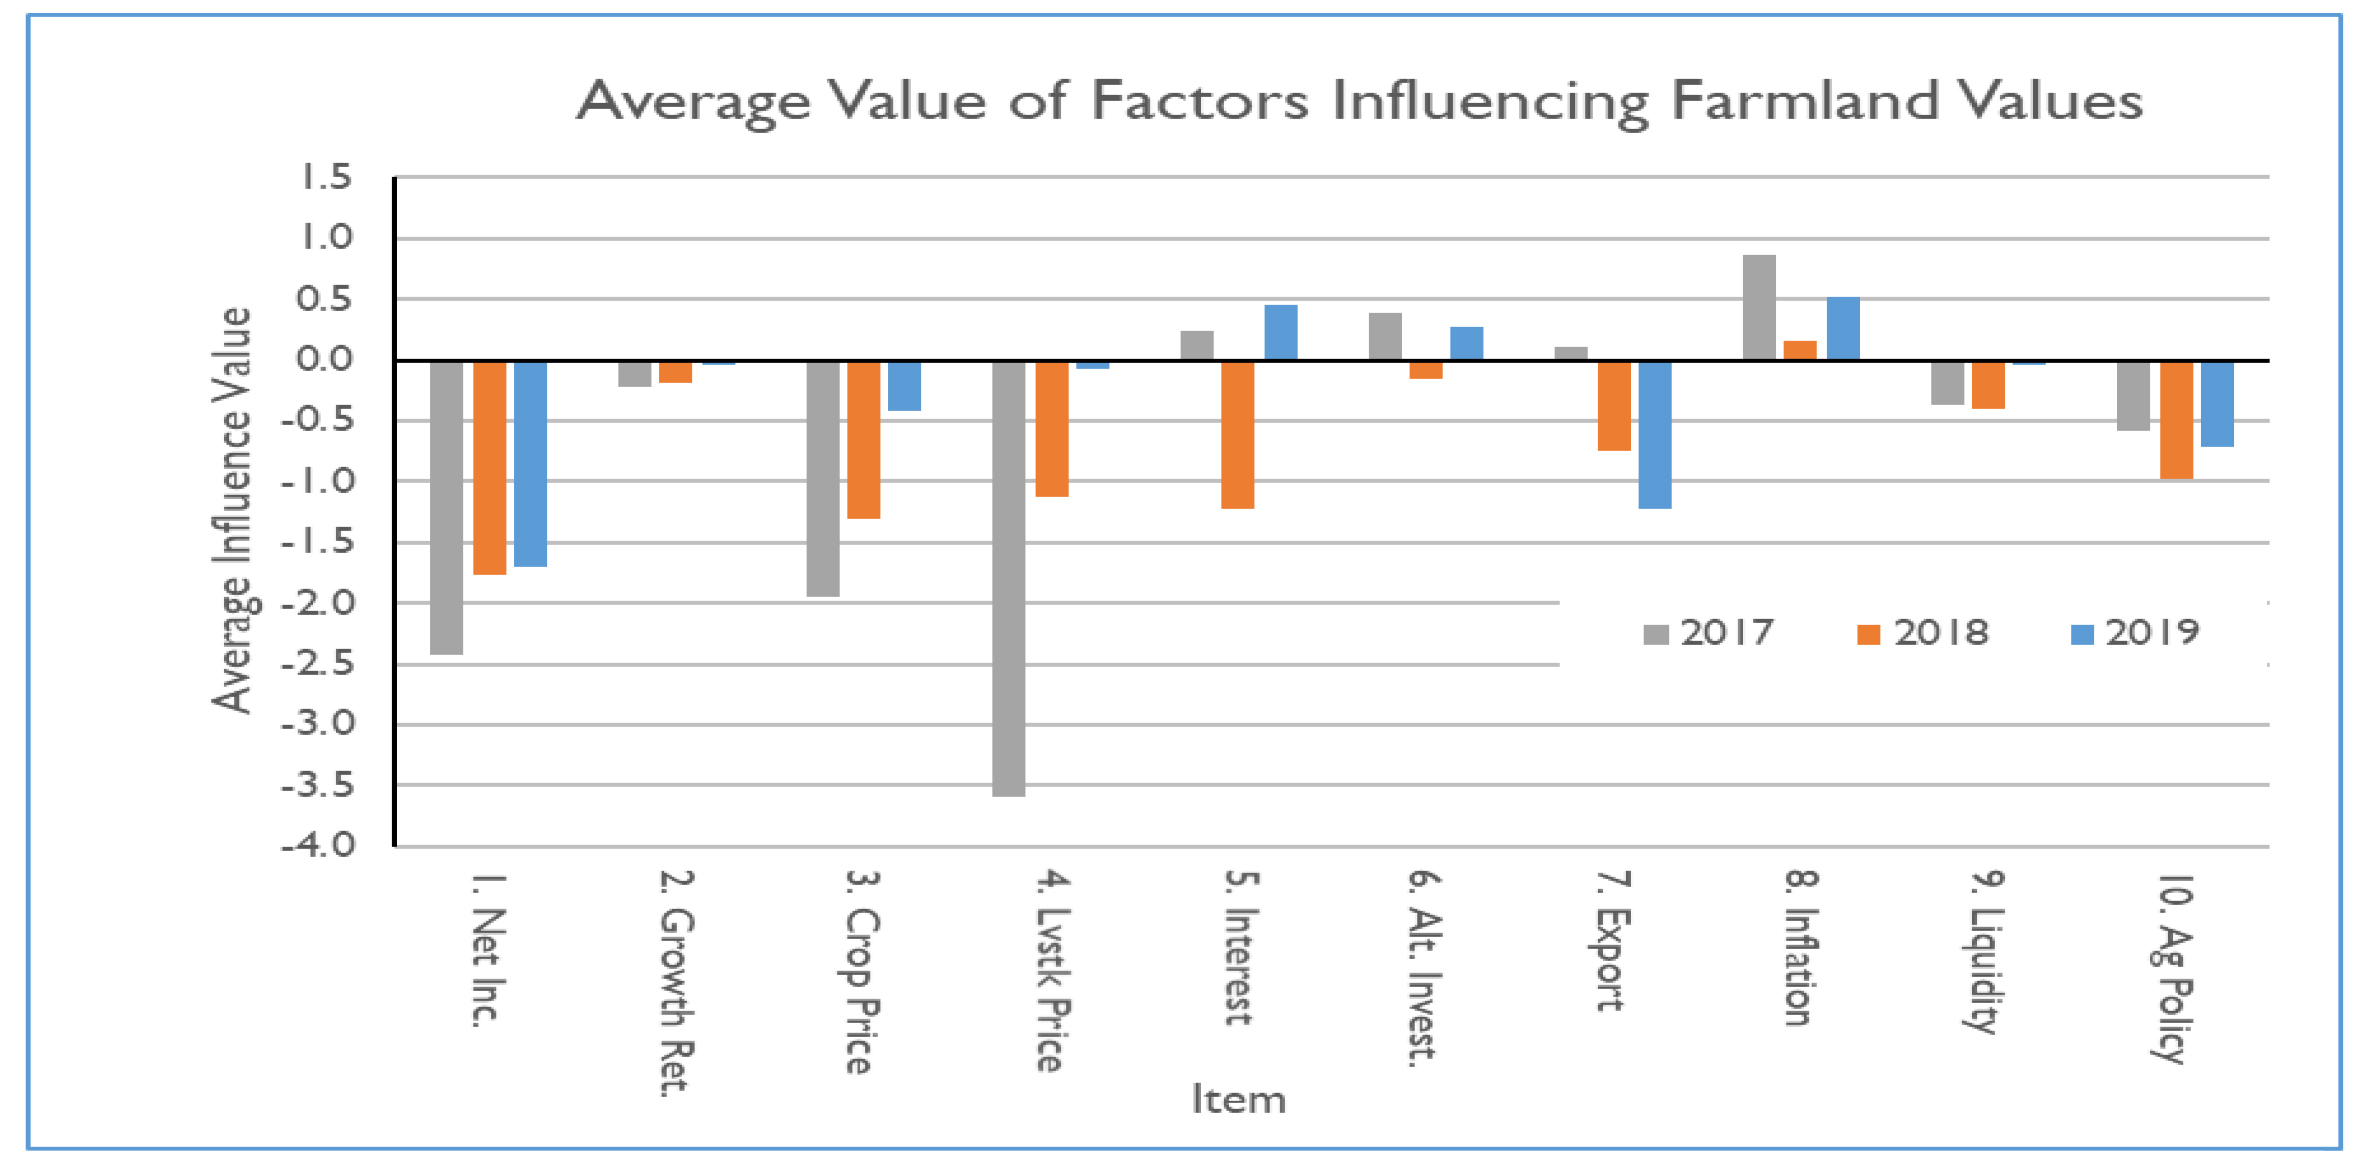
Figure 2. Influence of ten drivers on 2019 Indiana farmland values
For 2019 there were three positive influences found, compared to just one in 2018. The most notable change in 2019 compared to 2018 is the influence of interest rates. In 2018, rates were increasing and respondents indicated the long-term interest rate was a significant negative influence. Since that time, there have been declines in long term interest rates and the Federal Reserve shifted from indicating future increases in interest rates were likely to discussing the potential of a recession and implying they might consider an interest rate reduction.
Given the continued low grain prices and net farm income over the period of 2017, 2018, and 2019, it is not surprising respondents placed a negative influence on net farm income, expected growth in returns, crop prices, and livestock prices. Respondents have become less negative about each of these items but all continue to be negative.
The growing concern about getting the crop planted provided pricing opportunities at the end of June that did not exist at the beginning of June. This may have resulted in late respondents being more optimistic about commodity prices and margins than early respondents. However, for higher prices to be helpful, there needs to be production. As always in July there is uncertainty about yields, but this year there is also uncertainty about how many acres got planted.
The one item that had an increased negative influence was the outlook for agricultural exports. The quick resolution of trade issues with China and others has not occurred and this government policy change is resulting in an increasing negative influence.
Survey respondents indicated farmers purchased 70% of the farmland sold in 2018. This makes farmers the largest segment of buyers by a significant margin. The next largest group was the long-term nonfarm investors at 18% with developers at 6% and pension funds at 5%. Other buyers were less than one percent. Given the amount of press coverage focused on the importance of maintaining working capital, monitoring liquidity, and farmers keeping their lender informed of their financial position, it is a bit surprising that concern about the liquidity of buyers declined (9. Liquidity).
While low crop prices, slow reductions in cost, and tight margins has resulted in increased financial stress, the issue of buyer liquidity is about whether there are enough capable buyers in the market. Thus, the supply of farmland brought to the market is important. Fifty-nine percent of the respondents indicated there was less land on the market than in 2018. (Figure 3). Forty-one percent of the respondents indicated the amount was the same. For the first time in over 20 years, none of the respondents indicated an increase. For all years from 2014, there was only one year in which less than 50% of the respondents indicated less land on the market than the year before. That was 2018 when 45% of the respondents indicated less land was on the market.
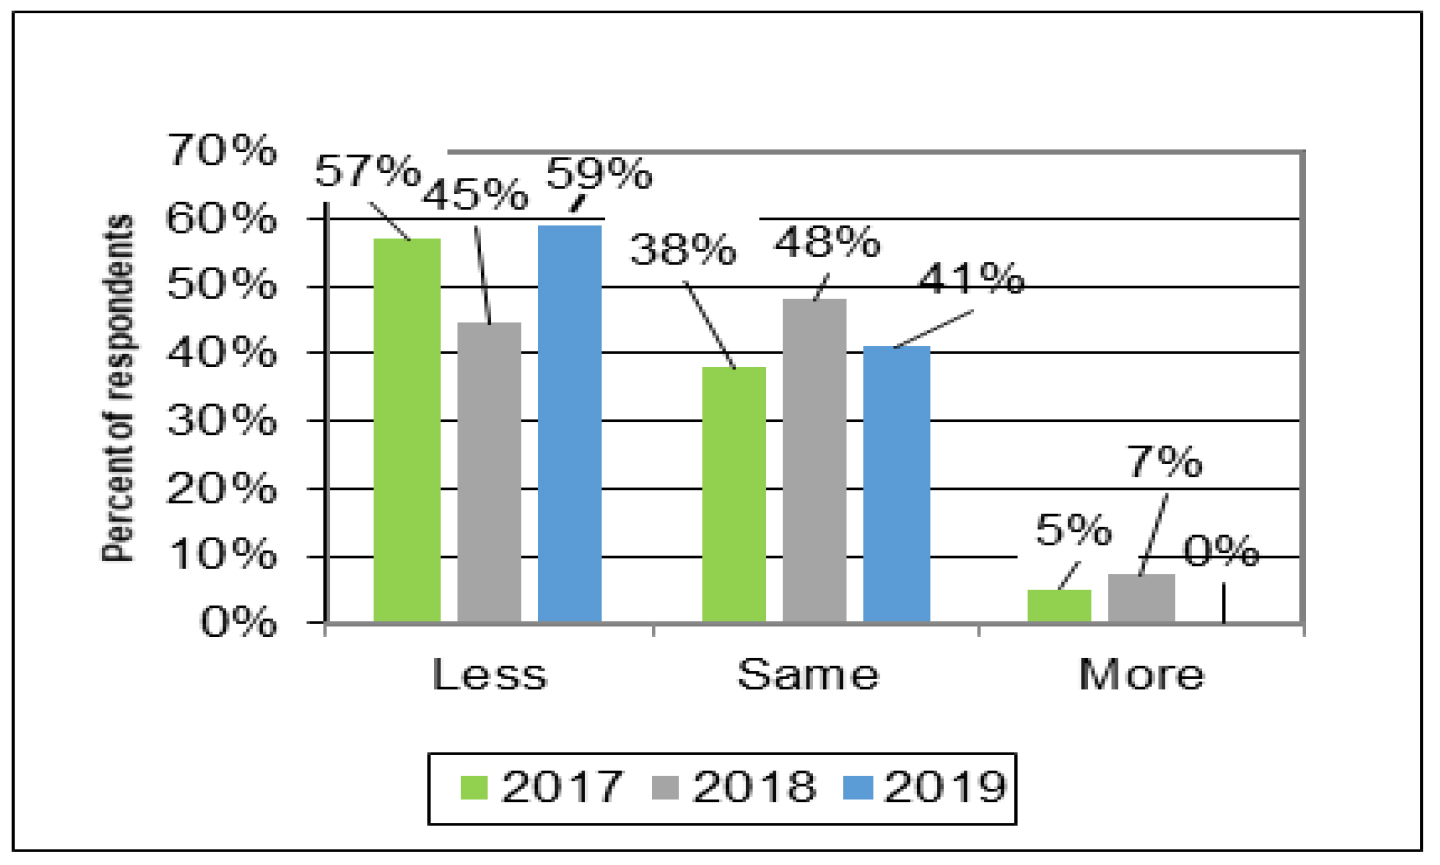
Figure 3. Percent of respondents indicating there is less, the same or more farmland on the markets in June 2019 than in June 2018
This is the third year U.S. agricultural policy has been viewed as having a negative influence on the farmland market (10. Ag Policy). Agricultural policy is viewed a little less negatively than in 2018, but seeing agricultural policy as a negative influence on farmland values is a sharp departure from the view held over the prior 70 years.
Five-Year Forecasts
Respondents were asked to forecast the five-year average corn price, soybean price, mortgage interest rate, inflation rate, and finally the change in farmland value. The price and rate estimates for the past five years are presented in Table 3.
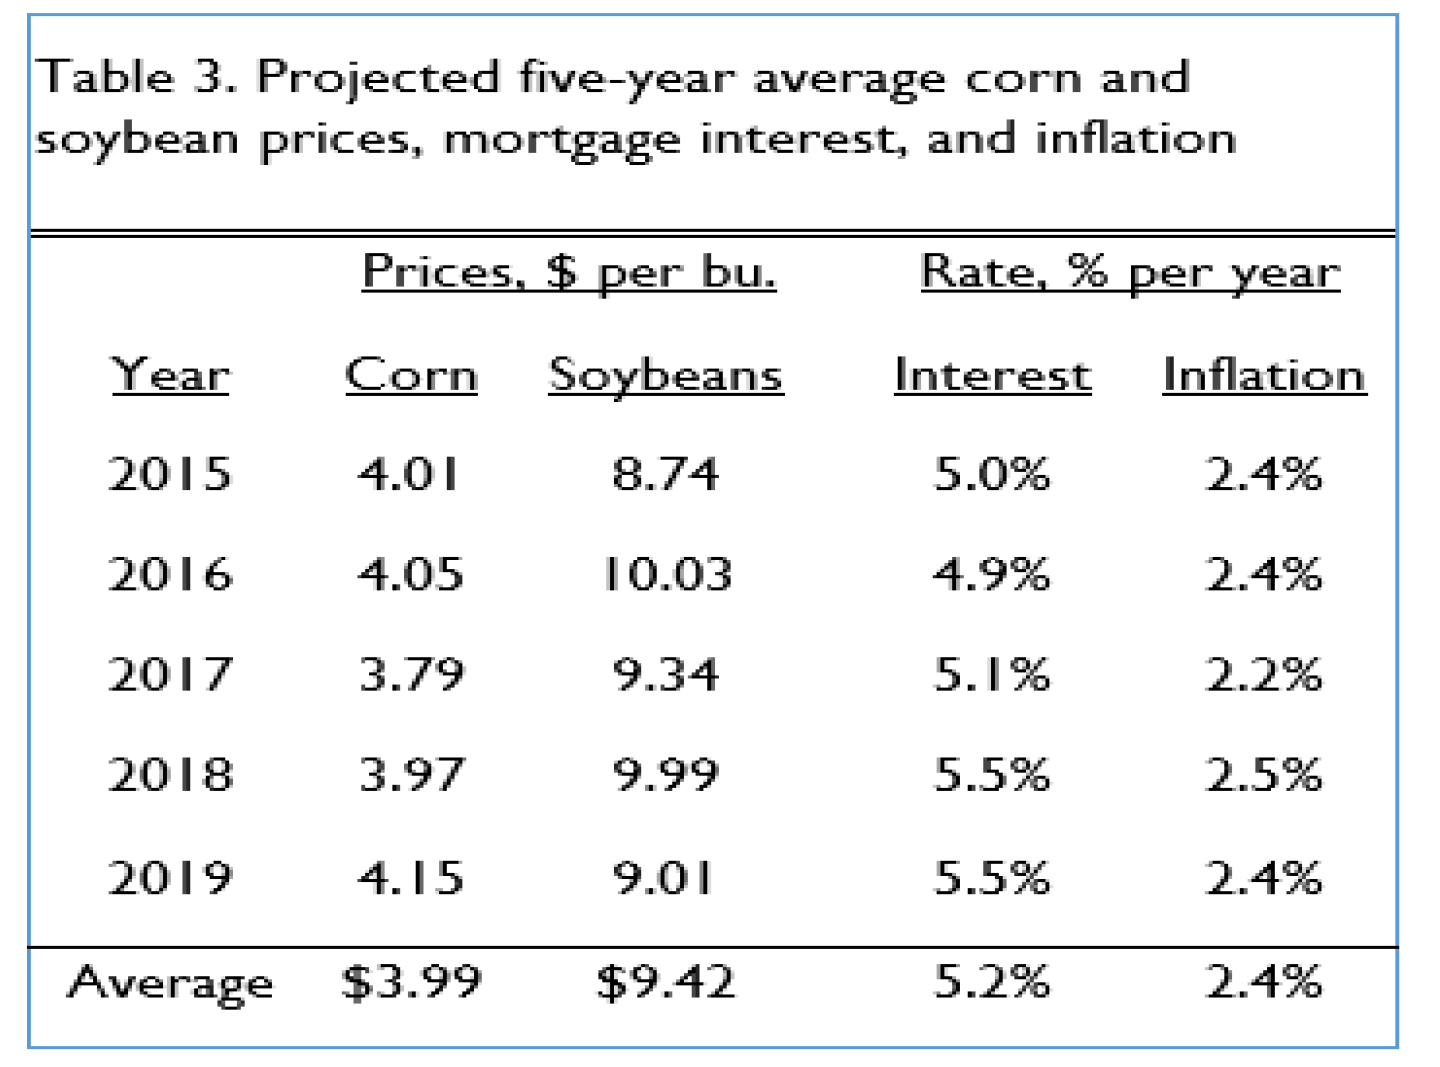
Table 3. Projected five-year average corn and soybean prices, mortgage interest, and inflation.
Respondents estimated the 5-year per bushel average price of corn to be $4.15. This was an $0.18 increase for the 5-year average corn price, making it the highest price in the last five years. The five-year average soybean price was estimated to be $9.01, a decline of $0.98 per bushel. Only 2015 had a lower 5-year average price.
Stability is the word that applies to the 5-year estimates of interest and inflation rates. With a 2019 average mortgage interest rate of 5.5%, the 5-year average interest rate was the same as reported for 2018. Over the years 2015 to 2019 the average 5-year inflation rate has varied only 0.3 percentage points.
Where do respondents expect farmland values to be in five years given these estimates? As expected, there is less consensus about where farmland values will be in five years than when asking for 2019 yearend estimates. When comparing the three choices of higher farmland prices, farmland prices similar to current values, or lower farmland prices, higher farmland prices was the largest group, 58% of the respondents. This is 6% more than in 2018. The next largest group, at 29%, was respondents expecting farmland values in five years to be the same as today. That leaves 13% of the respondents expecting farmland values to be lower.
If you anticipate farmland values will be higher in five years than today, over half of the respondents agree with you. In addition, history also strongly supports this view of future farmland values (Figure 4). However, when respondents were asked how much higher farmland land values would be in five years, the group average was 10.4%. By historical standards, a 10.4% increase in farmland values over five years is a very modest increase.
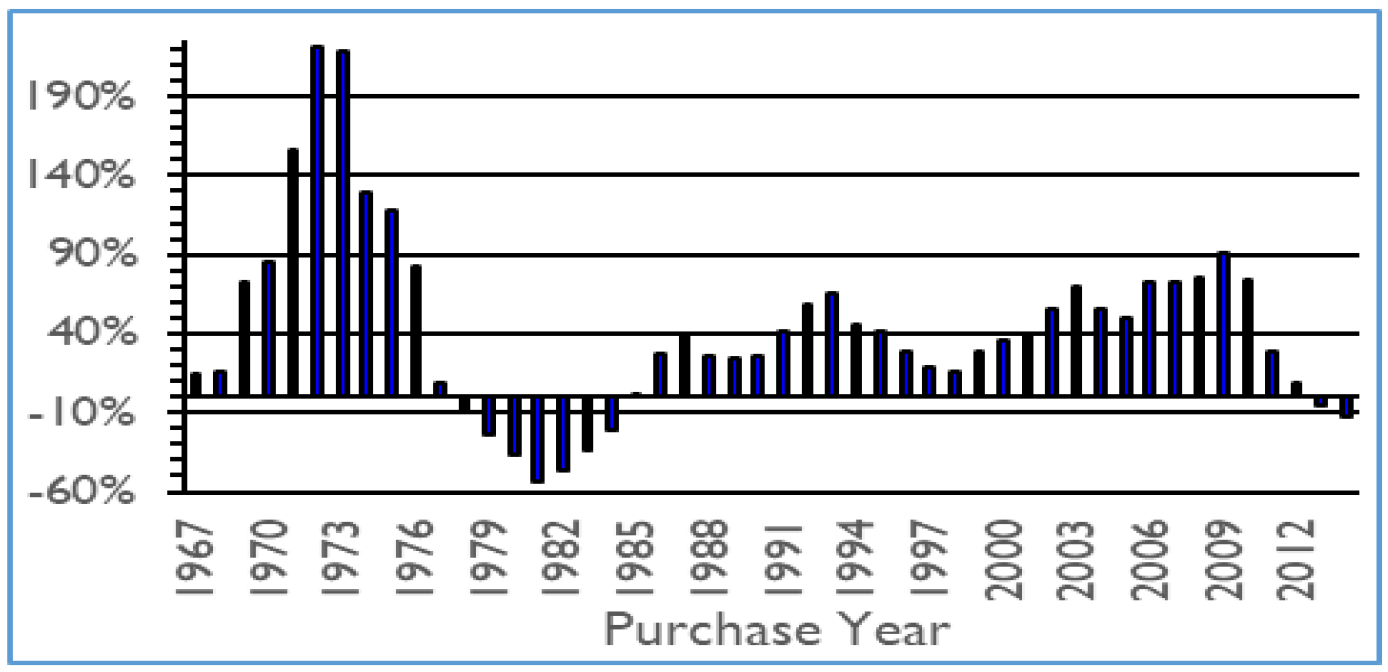
Figure 4. Percentage change in farmland value over the five year ago price for average quality Indiana farmland
If you think that farmland values will be the same or lower there are 42% of the respondents that agree with you. The difference with this expectation is history provides little support. This does not mean it cannot happen, just that it is not a frequent event. Plenty of people remember the 1980s and a few may even have memories of the Great Depression. Sometimes the best strategy is to expect the unexpected.
2020 Farmland Values Outlook
What might lie ahead for the farmland market? Crop production margins continue to be under pressure. There may be some relief from this margin pressure because of a supply disruption. The unfortunate part of this solution is that if your business is one helping to make the supply smaller it can change a bad situation into a crisis. We have a new farm bill but it continues most of the polices of the previous farm bill. The price or income support program in the farm bill does not provide much relief during periods of chronically low prices. If financial stress progresses to the point producers decide selling farmland can no longer be avoided, then the increased supply of farmland on the market could be enough to saturate the demand and accelerate the decline in farmland prices?
There remain more negatives than positives in the farmland market. A smaller supply of corn and soybeans will help increase grain prices, but large inventories and weak demand could limit those increases. And will somewhat higher prices offset smaller production enough to improve crop margins overall? It appears we are in a situation much like 2018 with more market negatives than positives. As a result, the outcome for 2020 is likely to be similar with farmland values being the same or lower. Time will tell.
Cash Rent Results
Last year was the first time since 2015 for the survey to report statewide increases in cash rent across all classes of farmland quality. This year we are back to reporting declines in cash rent across all class of farmland quality. The largest decline was 4.6% for top quality farmland (Table 4). This was followed by 1.4% decline in average quality farmland and a 1.2% decline in poor quality farmland.
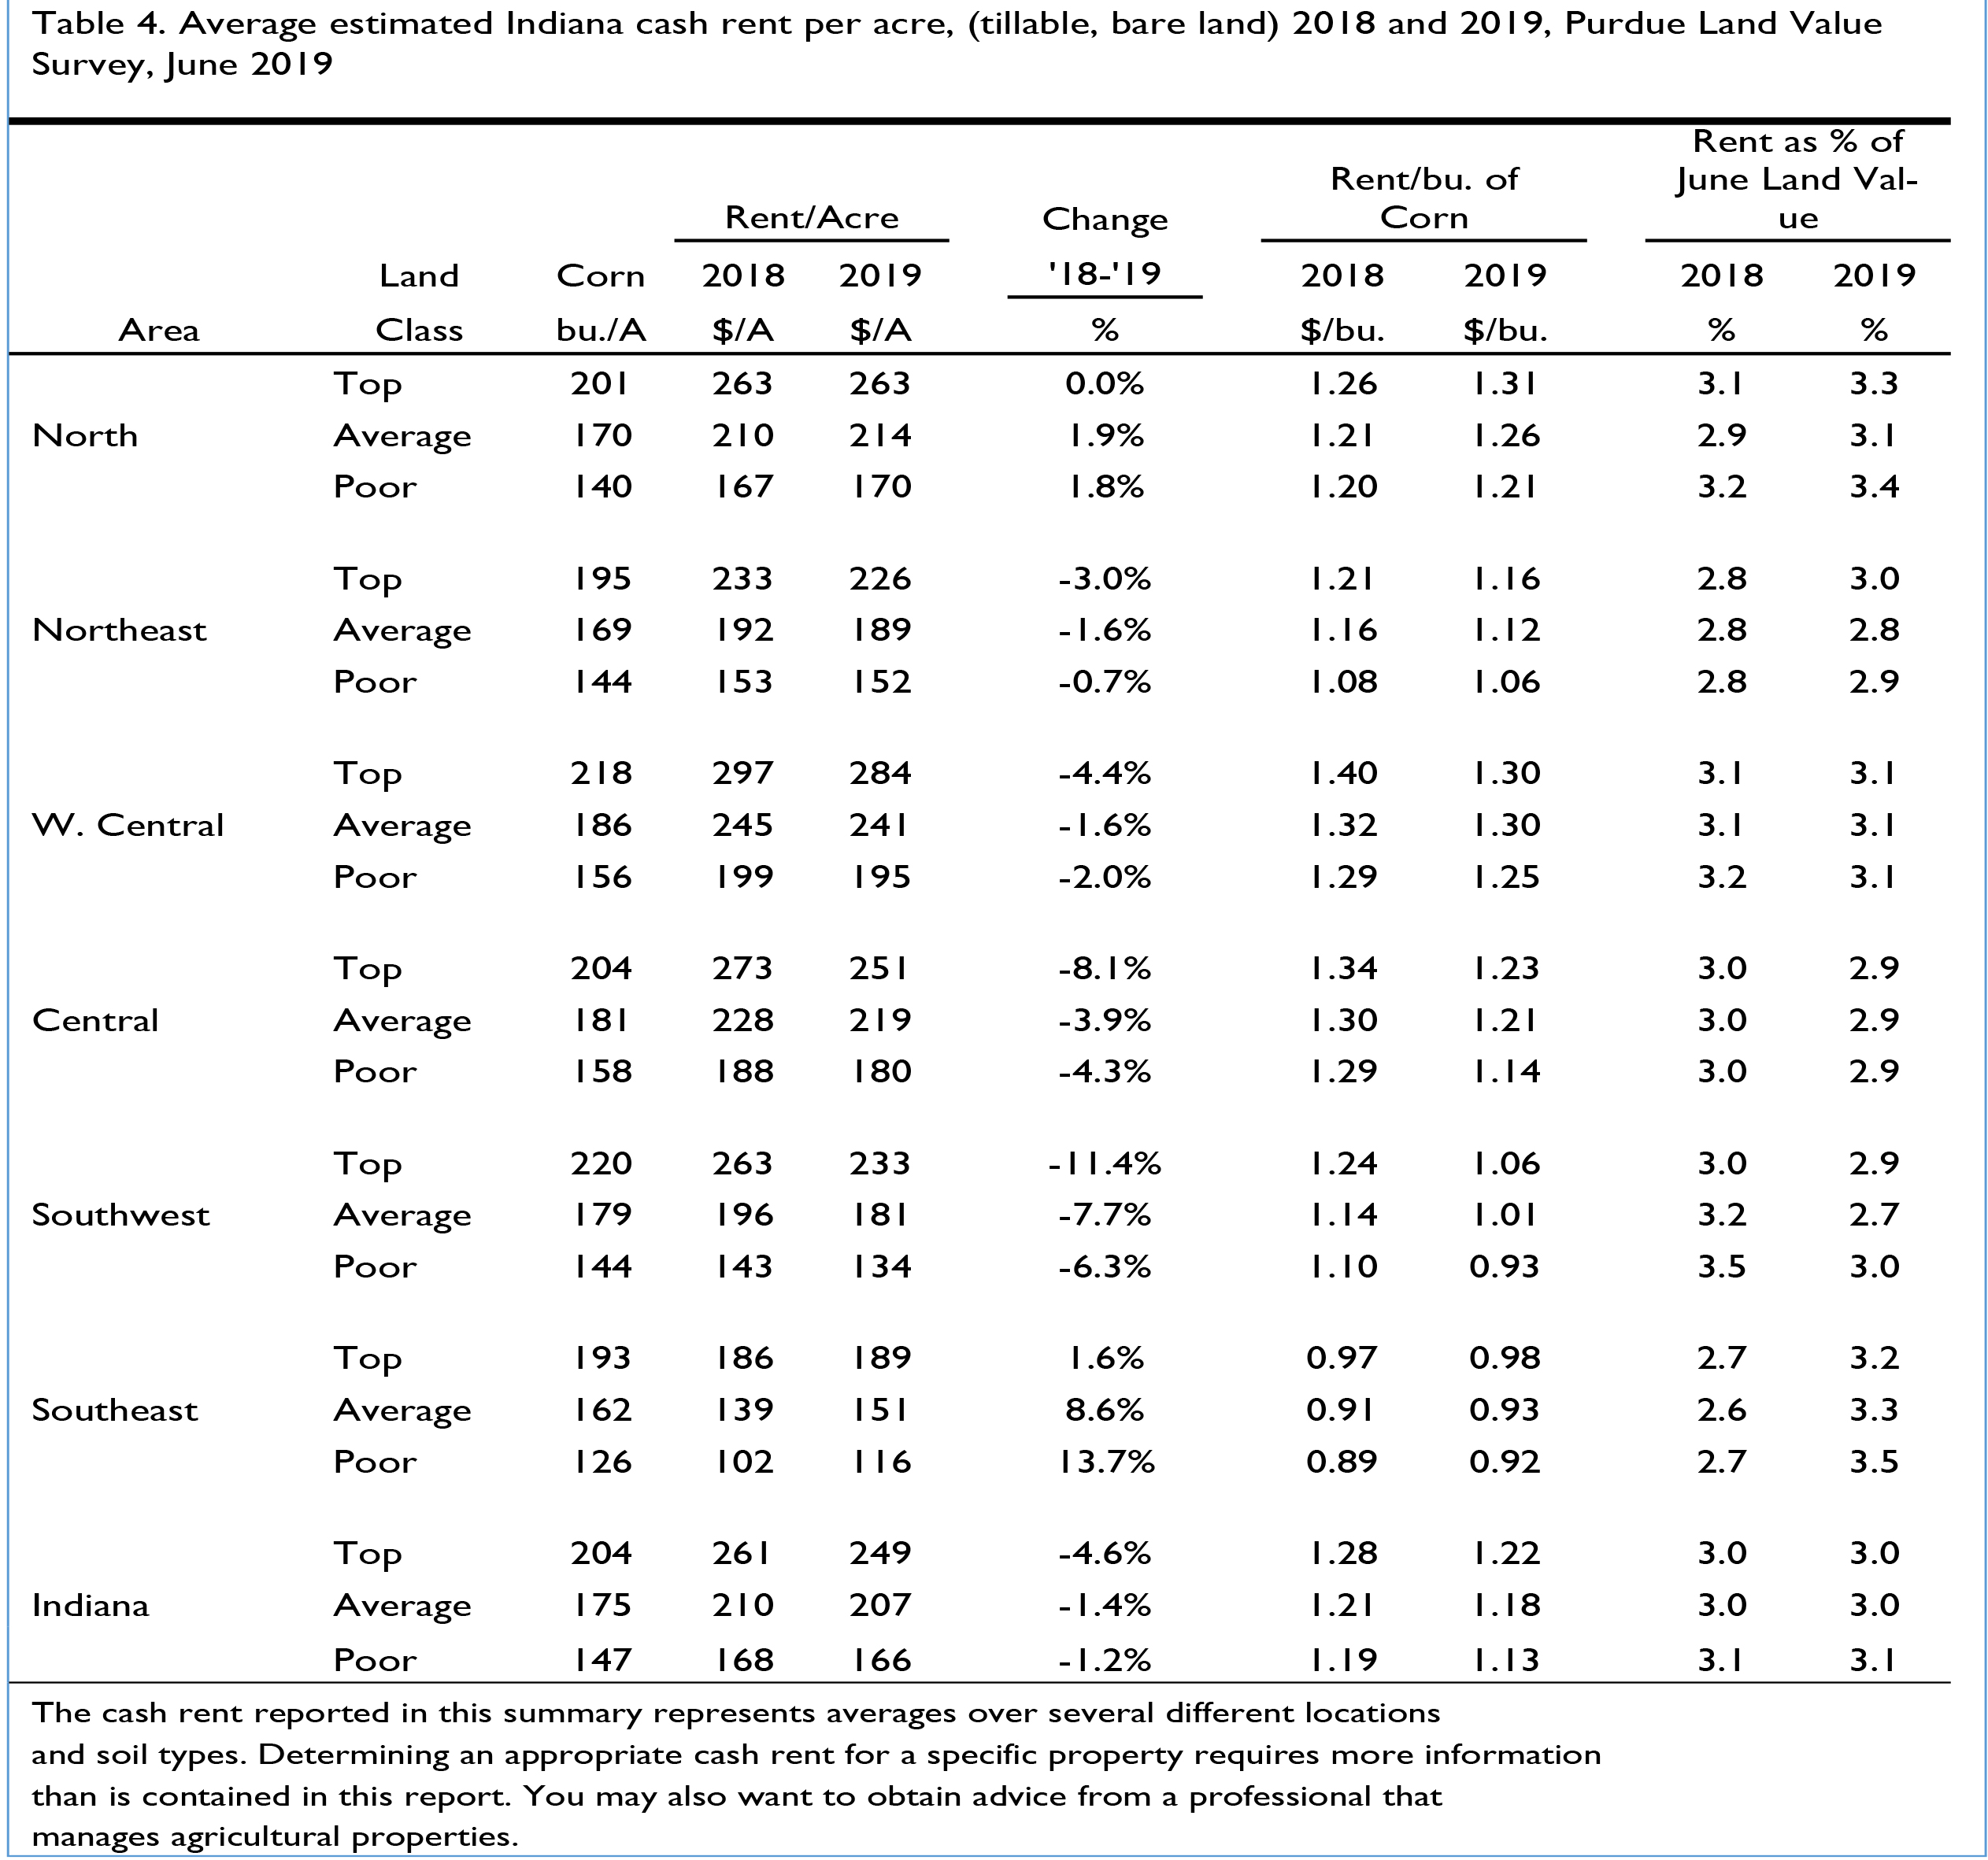
Table 4. Average estimated Indiana cash rent per acre, (tillable, bare land) 2018 and 2019, Purdue Land Value Survey, June 2019
Statewide top quality farmland had a cash rent of $249 per acre, a reduction of $12 per acre. Average quality land had a cash rent of $207 per acre, a decline of $3 per acre. Poor quality land had a cash rent of $166 per acre, a decline of $2 per acre.
Comparing regional cash rent changes, a decline occurred for all land classes in the Northeast, West Central, Central, and Southwest. The Southwest reported the largest declines of these four regions. The Southeast reported increases across all quality measures of farmland and the North had no change in top quality land and small increases in average and poor quality farmland.
As with farmland values, the West Central region consistently has the highest cash rents across all farmland qualities. In 2019, top quality farmland averaged $284 per acre, average quality farmland averaged $241 per acre, and poor quality land averaged $195 per acre.
With the exception to top quality farmland, the region with the second highest cash rent was the Central region with top average and poor values of $251, $219, and $180, respectively. In the North region, cash rent for top, average, and poor quality farmland were $263, $214, and $170, respectively. The cash rent levels for the Northeast and Southwest were next. The Cash rent in the Southeast were the lowest with $189 per acre for top quality farmland, $151 for average quality farmland, and $116 for poor quality farmland.
Statewide cash rent per bushel declined, in 2019 cash rent per bushel ranged from $1.22 per bu. for top quality farmland to $1.13 per bu. for poor quality farmland. The decline in cash rent per bushel across all farmland qualities was also true for the Northeast, West Central, Central, and Southwest regions. The North and Southeast regions reported increases in cash rent per bushel for all farmland qualities.
The difference in cash rent per bushel across land quality were small. For the state, the difference across farmland quality is $0.09 per bushel.
The largest regional difference in cash rent per bushel across land quality was $0.13 in the Southwest. The smallest was $0.05 and $0.06 in the West Central and Southeast region, respectively. The North and Northeast regions reported a difference of $0.10 per bushel.
On a statewide basis, rent as a percent of land value remains around 3% (Table 4 and Figure 5). This is the sixth year the relationship between gross cash rent and farmland value has been approximately 3%. From 1985 through 2014, this value steadily declined (Figure 5). This decline is likely associated with the decline of long term interest rates during this same period.
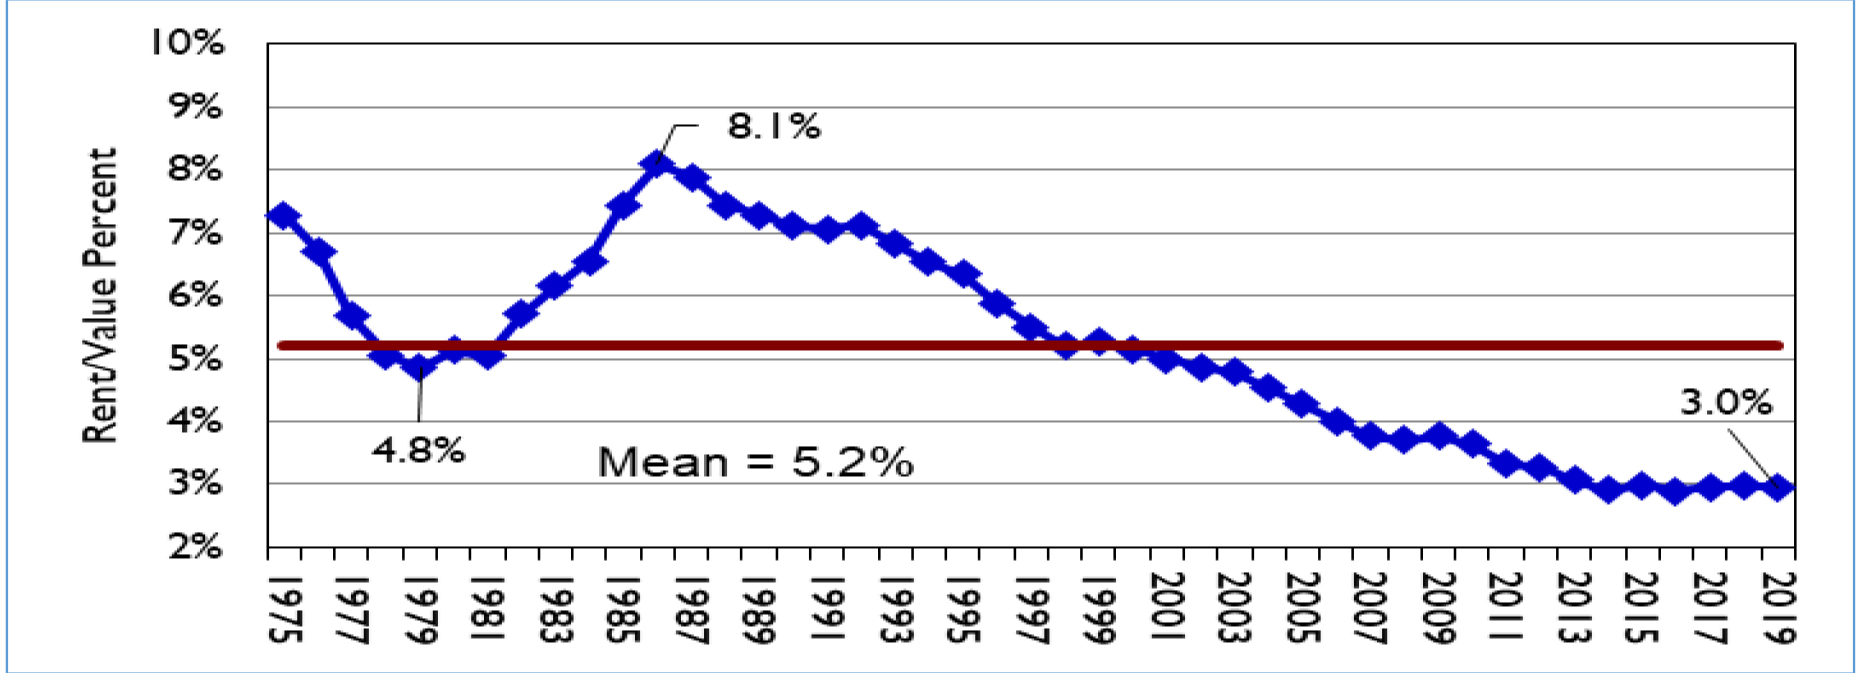
Figure 5. Gross cash rent for average quality farmland divided by the value of average quality farmland, 1975 – 2019
Rent as a percentage of farmland value has paused. What does the future hold? The Federal Reserve Bank Board of Governors seem to have shifted from inflationary concerns to recessionary concerns. If recessionary concerns continue to grow, there could be an effort to lower interest rates. Such a move would help to support farmland values. Since the national economy is in a “wait and see” mode, long term interest rates and the relationship of cash rents to farmland values are expected to remain stable for now.
2020 Cash Rent Outlook
Information was presented previously about expected corn and soybean prices, mortgage interest rates, the rate of inflation, and their influence on farmland values. These items also influence cash rent. Respondents were asked if they expected 2020 cash rents to be higher, the same, or lower. If they expected an increase or decrease, they were asked to indicate the percentage change. Just under half, 47%, of the respondents expect cash rents to be the same in 2020. Those anticipating an increase in 2020 cash rent accounted for 19% of the respondents. The average increase for this group was 8.4%. Those anticipating a decline in 2020 cash rent accounted for 34% of the respondents. The average decline for this group was 8.6%. Combining all three groups provides an overall average decline in the 2020 cash rent of 1.3%
The 2019 survey reported a decrease in cash rent in many regions of the state and the state as a whole. Combining the continued tight margins putting pressure on producers to lower per unit production cost and the added uncertainty associated with the late planting this spring, creates an increased level of uncertainty about net earnings from crop production in 2019.
University of Illinois agricultural economists are advising crop farmers that 2019 net income is likely to be significantly less than 2018 even though corn and soybean prices may be higher.* In this environment, it seems likely the changes in cash rent for 2020 are likely to be similar to the changes in 2019. Stable or slight declines seem likely. Again, time will tell.
![]()
![]()
![]()
![]()
![]()