2019 Purdue Crop Cost & Return Guide
December 5, 2018
PAEr-2018-22
Authors: Michael Langemeier, Associate Director, Center for Commercial Agriculture & Professor of Agricultural Economics and Craig Dobbins, Professor of Agricultural Economics
![]()
![]()
![]()
![]()
![]()
The 2019 Purdue Crop Cost and Return Guide, which is available for free download from the Center for Commercial Agriculture website (here), gives estimated costs for planting, growing, and harvesting a variety of crops, as well as estimated contribution margins (revenues minus variable costs) and earnings (revenues minus total costs). Total costs include accounting and opportunity costs. Examples of opportunity costs are the interest charge on the investment in machinery, buildings, and land, and depreciation on machinery and buildings. The guide is updated frequently as grain futures prices change and the costs of inputs, such as seed, fertilizer, pesticides and fuel, fluctuate. This paper discusses estimates made in early December 2018.
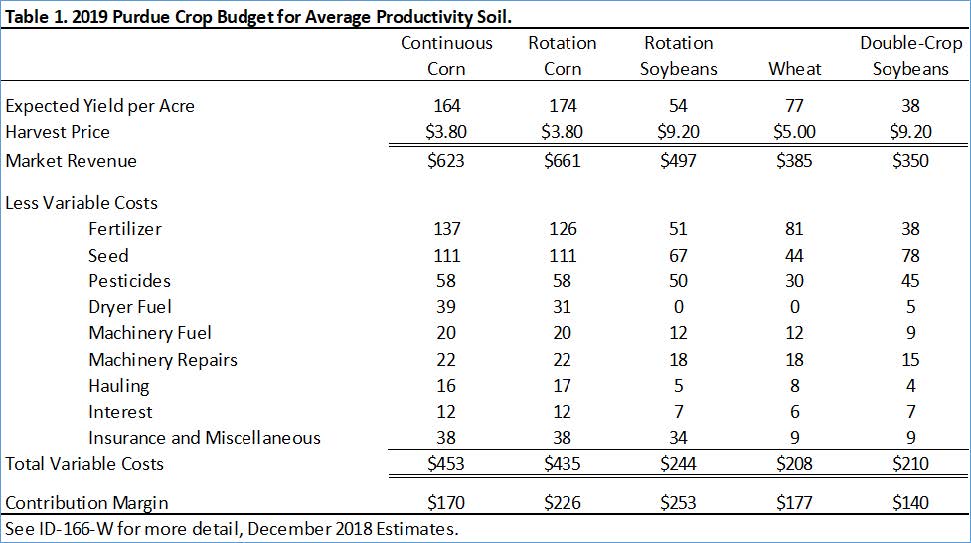
The guide presents cost and return information for low, average, and high productivity soils. The discussion in this paper will focus on the estimates for average productivity soil. Table 1 presents crop budget information for continuous corn, rotation corn, rotation soybeans, wheat, and double-crop soy- beans for average productivity soil. Double-crop soybeans are typically planted after wheat so it is typical to combine the contribution margin for these two crops when comparing to continuous corn, rotation corn, and rotation soybeans. It is important to note that crop yields have been modified in this year’s guide. The current yield estimates reflect trend yields for Indiana for each crop. The contribution margin, obtained by subtracting total variable cost from market revenue, ranges from $170 per acre for continuous corn to $317 per acre for wheat/ double-crop soybeans. The contribution margins for rotation corn and rotation soybeans on average productivity soil are $226 and $253 per acre, respectively. It is important to note that the contribution margin is used to cover overhead costs such as machinery costs, family and hired labor, and rent. Failure to adequately cover these overhead costs typically puts downward pressure on cash rent.
From 2007 to 2013, the average contribution margin for rotation corn was higher than the contribution margin for rotation soybeans by $38 per acre. The situation since 2014 has been considerably different. The average difference in the contribution margin since 2014 has been an advantage to soybeans of $72 per acre. However, with the decline in soybean prices, the projected difference in 2019 is only $27 per acre.
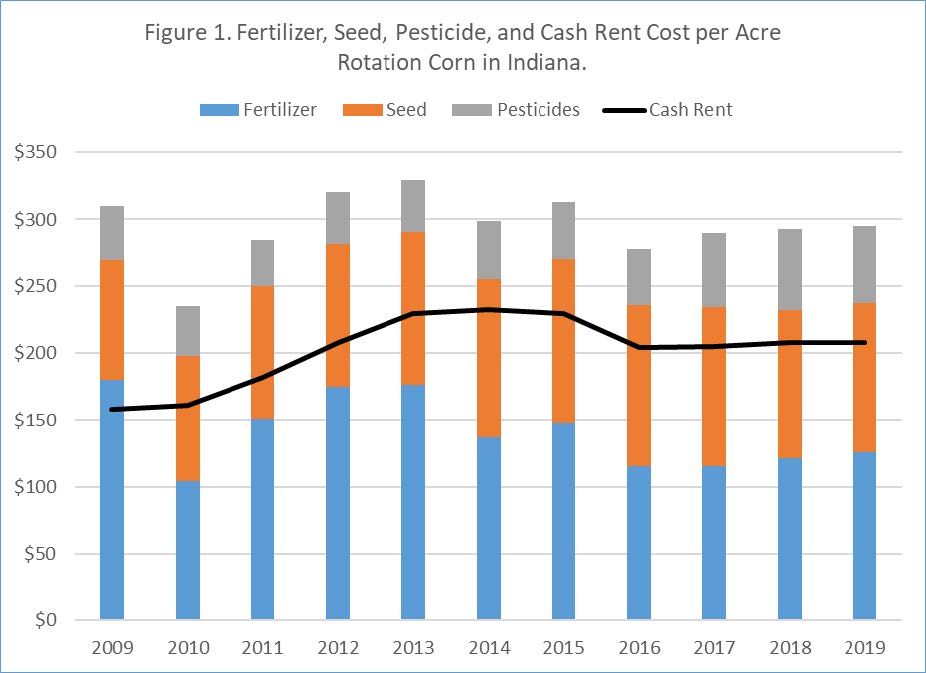
Figure 1 illustrates the trends in fertilizer, seed, pesticide, and cash rent costs for rotation corn on aver- age productivity soil from 2009 to 2019. Fertilizer cost peaked in 2013 at $176 per acre ($1.08 per bushel). In 2019, fertilizer cost per acre is projected to be $126 per acre ($0.72 per bushel). Cash rent per acre peaked in 2014 at $232 per acre ($1.42 per bush- el). At $208 per acre ($1.20 per bushel), projected cash rent is $24 per acre ($0.22 per bushel) lower than it was at the peak in 2014. Partially due to resistant weed problems, pesticide cost per acre in 2019 is expected to be higher than its level in 2013 and 2014, the peak cost years for fertilizer cost and cash rent.
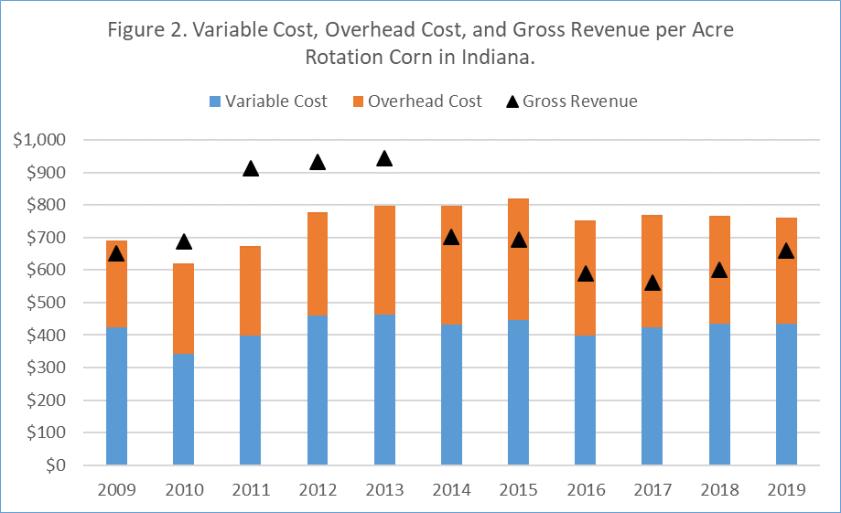
Gross revenue (market revenue plus government payments), variable cost, and overhead cost per acre for rotation corn on average productivity soil is illustrated in figure 2. Variable cost per acre peaked in 2013 at $462 per acre ($2.83 per bushel), and is projected to be $435 per acre ($2.50 per bushel) in 2019. Fixed cost (overhead cost) per acre peaked in 2015 at $375, and is projected to be $330 per acre in 2019. The breakeven price needed to cover variable and fixed costs varied from $4.77 to $4.98 per bushel from 2012 to 2015. In 2016 and 2017, the breakeven price declined to approximately $4.55 per bushel. In 2018, the breakeven price dropped to $4.45 per bushel. The projected breakeven price for 2019 is $4.40 per bushel. Gross revenue for rotation corn has declined from $945 per acre in 2013 to $661 per acre in 2019. The expected earnings per acre for rotation corn in 2019 is a loss of $104 per acre.
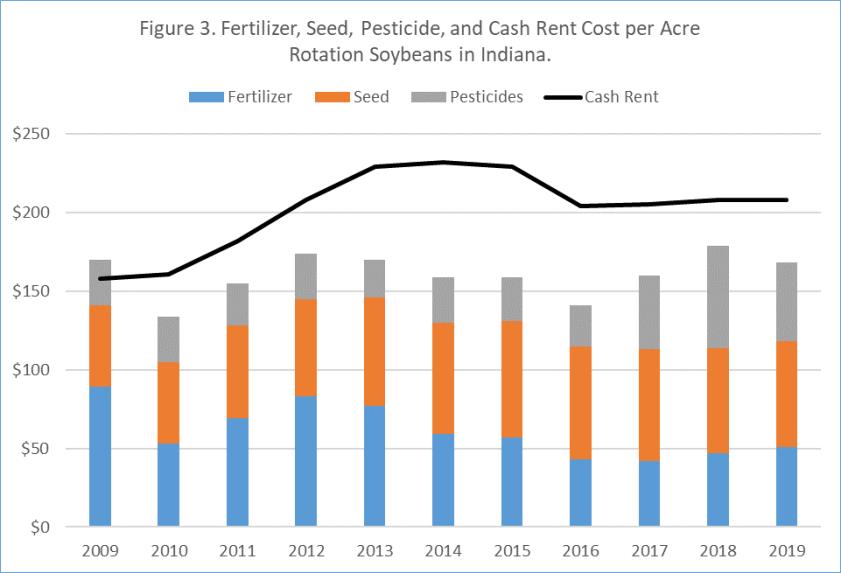
Figure 3 illustrates the trends in fertilizer, seed, pesticide, and cash rent costs for rotation soybeans from 2009 to 2019. Fertilizer cost and cash rent have declined since their peaks in 2013 and 2014.Resistant weed problems have put upward pressure on pesticide cost for rotation soybeans.
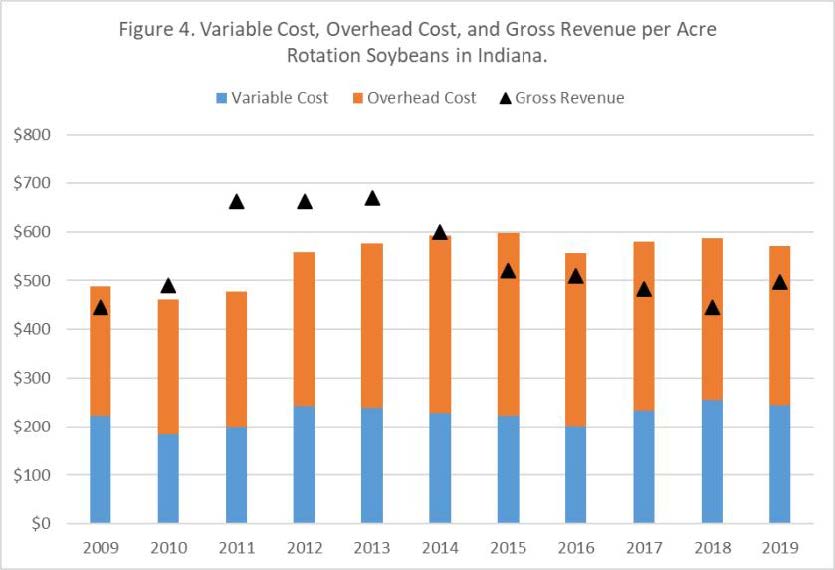
Gross revenue (market revenue plus government payments), variable cost, and overhead cost per acre for rotation soybeans on average productivity land is illustrated in figure 4. Primarily due to higher herbicide cost, variable cost per acre in 2019 is projected to be $244 ($4.52 per bushel), which is higher than the variable cost per acre in 2013 ($239 or $4.43 per bushel). Like corn, fixed cost per acre peaked in 2015 at $375, and is projected to be $330 per acre in 2019. The breakeven price needed to cover variable and fixed costs declined from $11.94 per bushel in 2015 to $10.63 in 2019. Gross revenue for rotation soybeans has declined from $670 per acre in 2013 to $497 per acre in 2019. The expected 2019 earnings for rotation soybeans is a loss of $77 per acre.
The breakeven prices for rotation corn and rotation soybeans discussed above were for average productivity land. For high productivity land, the breakeven prices for rotation corn and rotation soybeans are expected to be $4.03 and $9.86 per bushel, respectively. The breakeven prices for low productivity land are expected to be $4.88 and $12.02 per bushel for corn and soybeans, respectively. Thus, unless prices rise above $4.03 per bushel for corn and $9.86 per bushel for soybeans, earnings per acre will be negative for low, average, and high productivity levels.
In summary, margins will remain tight in 2019. Budgeted earnings per acre have been negative for corn since 2014 and for soybeans since 2015. Though smaller in 2019, the projected difference in margins between rotation corn and rotation soybeans still favors soybeans. The difference is small enough this year that this relationship could easily switch between now and next spring.
Tight margins increase the importance of carefully scrutinizing input and crop decisions. Producers are encouraged to create crop budgets and in general improve their record keeping. Lower crop margins will adversely impact a farm’s liquidity position and financial performance.
![]()
![]()
![]()
![]()
![]()
