2022 Purdue Crop Cost and Return Guide
January 13, 2022
PAER-2022-7
Michael Langemeier, Professor, Associate Director Purdue Center for Commercial Agriculture
![]()
![]()
![]()
![]()
![]()
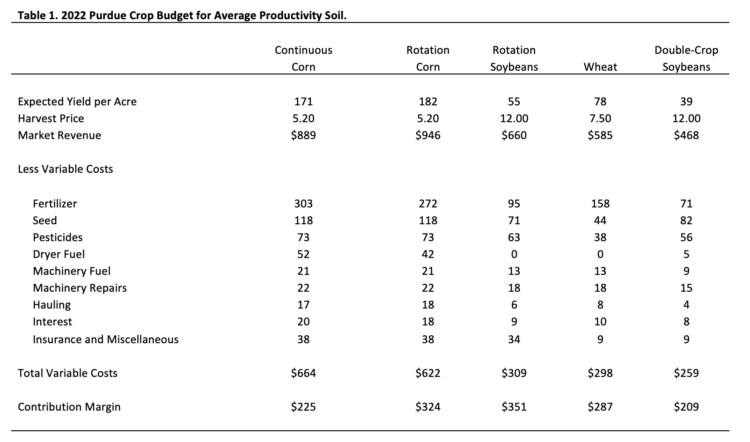
Table 1. 2022 Purdue Crop Budget for Average Productivity Soil.
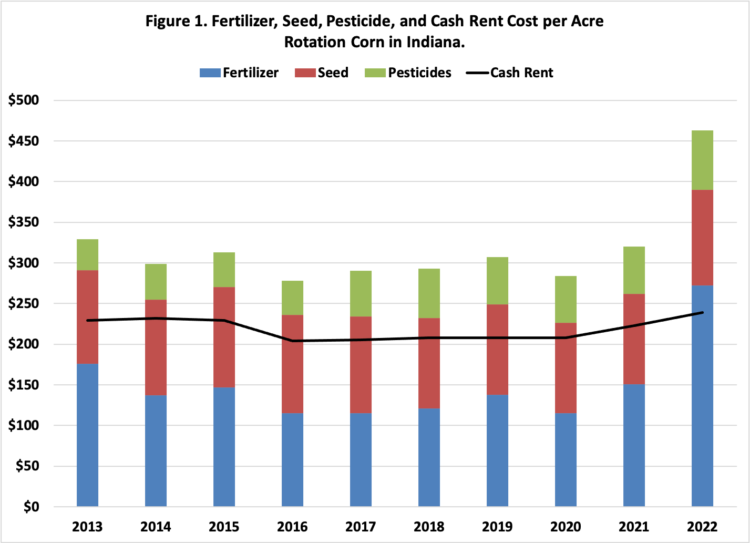
Figure 1. Fertilizer, Seed, Pesticide, and Cash Rent Cost per Acre
Rotation Corn in Indiana.
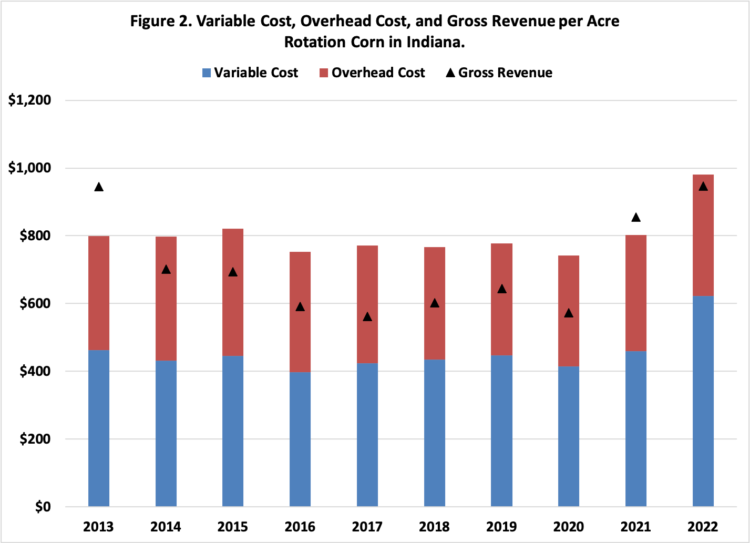
Figure 2. Variable Cost, Overhead Cost, and Gross Revenue per Acre
Rotation Corn in Indiana.
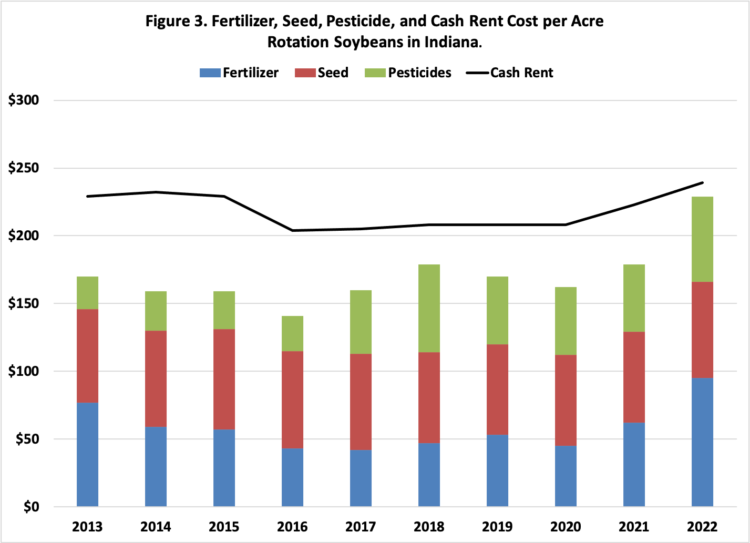
Figure 3. Fertilizer, Seed, Pesticide, and Cash Rent Cost per Acre
Rotation Soybeans in Indiana.
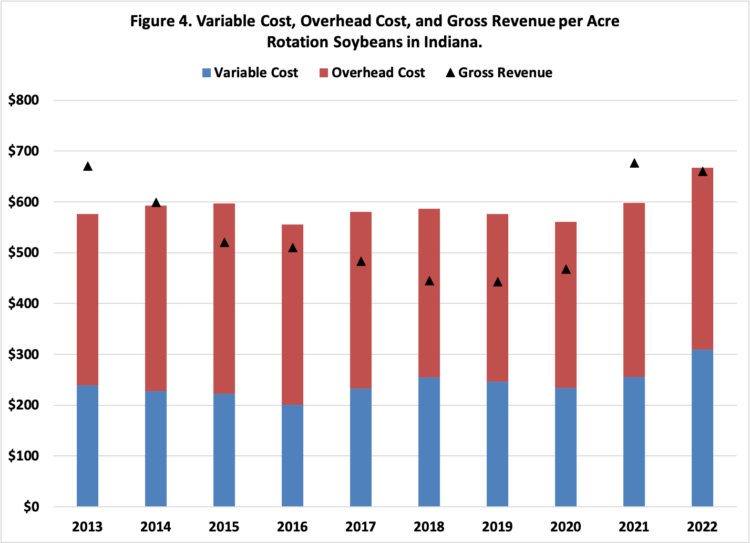
Figure 4. Variable Cost, Overhead Cost, and Gross Revenue per Acre
Rotation Soybeans in Indiana.
![]()
![]()
![]()
![]()
![]()