2023 Agricultural Credit Outlook
January 10, 2023
PAER-2023-07
Brady Brewer, Associate Professor & Todd H. Kuethe, Associate Professor, Schrader Chair in Farmland Economics
![]()
![]()
![]()
![]()
![]()
The agricultural economy in 2022 was marked by low interest rates, increasing land values, and higher farm profits. Overall, it was a good year for farmers balance sheets for both short-term and long-term assets. Liquidity and solvency were direct beneficiaries of the 2022 environment. This article examines the trends in three key parts of the agricultural credit markets: interest rates, the demand for loans, and non-performing loans. We examine data obtained from the two Federal Reserve banks that serve Indiana. As shown in Figure 1, 68 counties in northern and central Indiana are part of the Federal Reserve Bank of Chicago region, and the remaining 24 counties in southern Indiana are part of the Federal Reserve Bank of St. Louis.
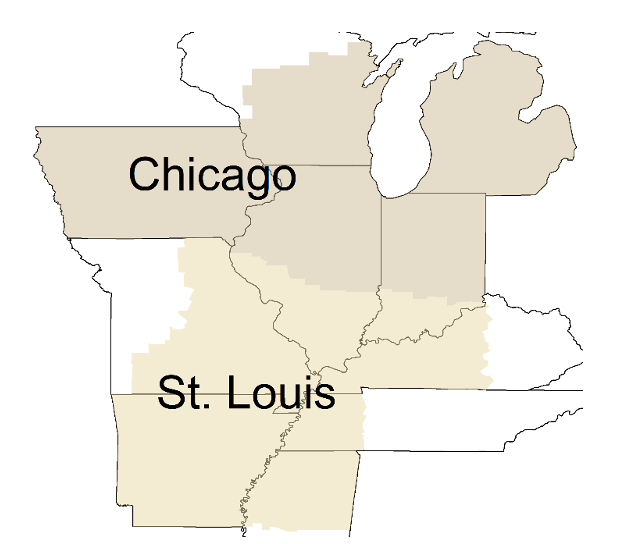
Figure 1: Chicago and St. Louis Federal Reserve Districts
Both Federal Reserve banks conduct quarterly surveys of agricultural bankers in their region. The surveys address important issues in farmland and agricultural credit markets. It is important to note that both Federal Reserve regions cover large areas with diverse agricultural sectors. Thus, local conditions may deviate from broad, regional trends. At the time of writing, data for the St. Louis Federal Reserve district were available through the third quarter of 2022 through the Federal Reserve Bank of Kansas City’s Agricultural Finance Updates, and data for the Chicago Federal Reserve district were available through the third quarter of 2022 through the bank’s AgLetter publication.
Interest Rates
Interest rates climbed through much of 2022. The Federal Open Market Committee (FOMC), a twelve-person committee consisting of members of the board of Governors from the Federal Reserve System and presidents from the eleven Reserve Banks, raised the Fed Funds Rate[1] seven consecutive meetings in 2022. Figure 2 plots the average interest rate on farm operating loans since the first quarter of 1991 for the Chicago Fed district and the second quarter of 2012 for the St. Louis Fed district. Farm operating loans are defined as those used primarily to finance current crop production expenses and the care and feeding of livestock (including poultry). Data for the St. Louis district does not go back as far as the data for the Chicago district does; however, the longer time period is being shown as it helps put perspective on the increases in interest rates that were experienced in 2022.
The latest data available for each of the two Federal Reserve’s that cover Indiana is from the 3rd quarter of 2022. Operating loan interest rates for the Chicago Fed district were 6% while operating loan interest rates for the St. Louis Fed district were 6.5%. The fourth quarter 2021 marked the lowest operating loan interest rates had been over the last 30 years. At the beginning of 2022, operating loan interest rates were 4.6% for the Chicago Fed district and 4.74% for the St. Louis Fed district. Interest rates increased 1.9 percentage points for the Chicago Fed district and 1.25 percentage points in the St. Louis Fed district. This is the highest interest rates the Chicago Fed district has seen since the 3rd quarter of 2008 and the highest the St. Louis Fed district has seen since the 3rd quarter of 2019.
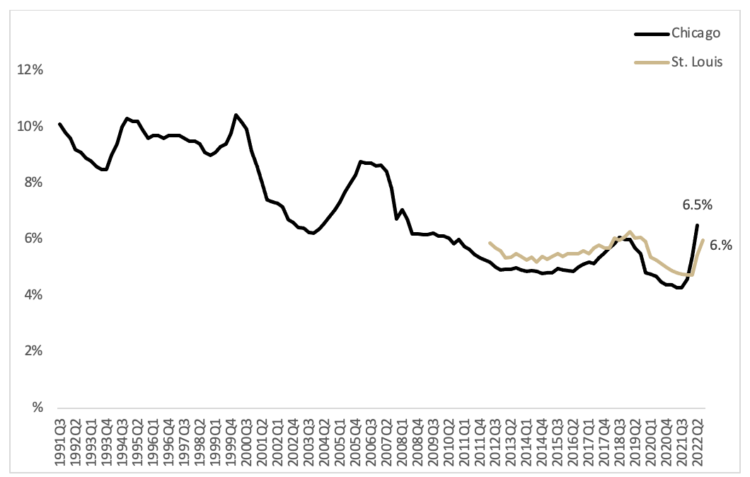
Figure 2 Average Fixed Interest Rate on Operating Loans, 1991Q1 – 2022Q3
Figure 3 plots the average fixed interest rates on long-term farm real estate loans. The most recent survey results suggest an average farm mortgage rate of 6.1% in the Chicago Fed district and 5.95% in the St. Louis Fed district. These interest rates are up 1.7 percentage points in the Chicago Fed district where they averaged 4.4% in the first quarter of 2022 and they are up 1.5 percentage points in the St. Louis Fed district where they averaged 4.45% in the first quarter of 2022. This is the highest farm real estate interest rate since the fourth quarter of 2009 in the Chicago Fed district the highest interest rate since the first quarter of 2019 in the St. Louis Fed district.
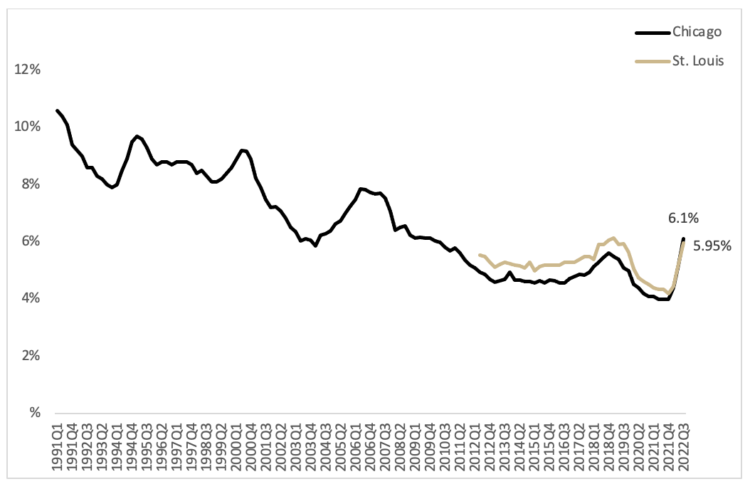
Figure 3 Average Fixed Interest Rate on Long Term Farm Real Estate Loans, 1991Q1 – 2022Q3
One key predictor of where interest rates will go is the Fed Funds rate. Every other FOMC meeting, the “Summary of Economic Conditions” is released. This summary represents the views on the certain economic indicators by the FOMC committee. In this summary, it is expected that the Fed Funds rate will increase another 100 basis points (1 percent) to a target range of 5.1% to 5.4%. If this happens, we could see interest rates rise another 100 basis points through the end of 2023.
Whether this continued increase in the Fed Funds comes to fruition will in large part rest on if the US economy continues to see inflation impacting consumers purchasing power. While it is unlikely that inflation will return to the Fed Reserves target of 2%, if it eases enough, we may see the FOMC put a pause, or at the very least slow down, future increases to the Fed Funds Rate.
Demand for Loans and Bank Condition
The Federal Reserve Bank surveys ask agricultural bankers to rate the demand for loans at their institution relative to a year earlier. Respondents report whether the demand for loans is “higher,” “lower,” or the “same.” These responses are summarized by a loan demand index, calculated as the share of lenders reporting “higher” minus those reporting “lower” plus 100. Thus, when the loan demand index is less than 100, the demand for agricultural loans is decreasing. Figure 4 shows that the demand for agricultural loans decreased in 2022 relative to 2021. However, this sentiment was not as strong as at the end of 2021 and the first part of 2022. While overall demand for loans decreased, less bankers reported the decrease than in 2021. Rising input prices were a significant factor in the increased demand for loans as key inputs such as fuel and fertilizer saw price increases. If this trend continues, this may indicate that farmers will need more loans in 2023 than they did in 2022.
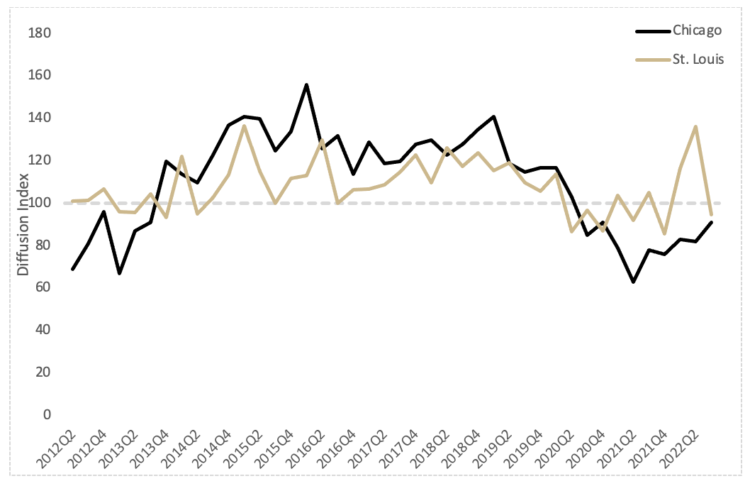
Figure 4 Demand for Agricultural Loans, 2012Q2-2022Q3
A new development for 2022 compared to previous years is that bankers are now reporting less funds available to loan out than last year. However, this, to date, is not an indication that banks are stressed, instead it suggests that there may be a tightening of deposits and other funds that have been available. This will be something to keep an eye on throughout 2023.
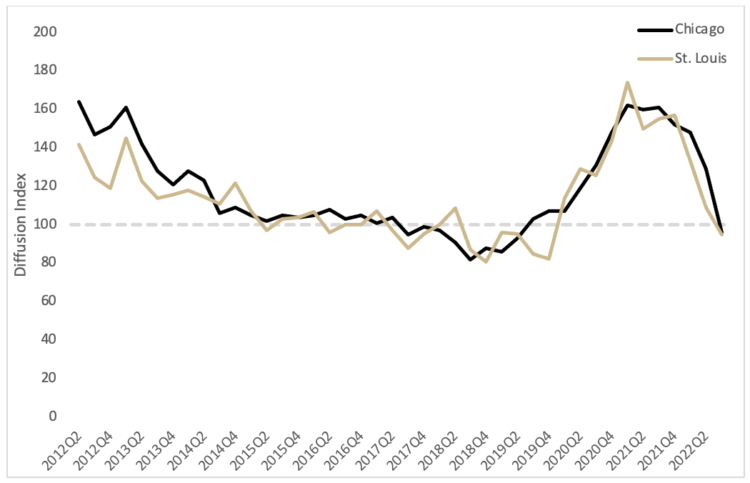
Figure 5 Availability of Funds at Agricultural Banks, 2012Q2 - 2022Q3
Non-Performing Loans
Farmers’ rate of loan repayment declined in 2022, a continuation of a trend that started in 2021. The index is similarly constructed based on lenders reported repayment rates relative to the same quarter of the previous year. Given that the loan repayment rate index for Chicago is above 100, the index suggests that farmers were able to pay off a smaller portion of their debt relative to a year ago. The St. Louis Fed index is exactly 100 for the 3rd quarter of 2022, indicating no change in repayment rates from a year prior. This suggests that repayment rates may be slowing across the region and should provide some caution for the agricultural finance sector.
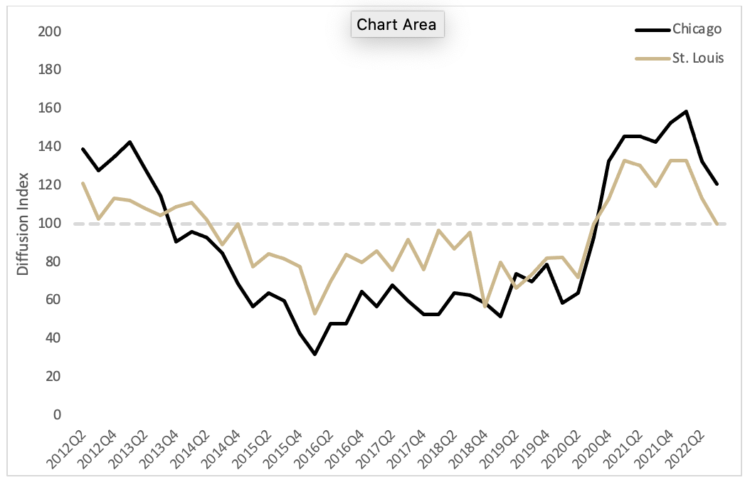
Figure 6 Loan Repayment Index, 2012Q2 – 2022Q3
Overall, the data shows a cautionary tale for the 2023 agricultural credit market. Farm incomes were up in 2022, which increased liquidity for much of the agricultural sector. Despite the increase in farm income, bankers reported lower rates of repayment from farmers they lend to. Additionally, demand for loans is on a trajectory such that farmers will have an increased demand for loans while bankers report less funds available to loan. Interest rates are also on an upward trajectory. If the Fed Funds Rate continues to increase over 2023 by 100 basis points, we can expect the interest rate the farmers pays to raise similarly. While these indicators may seem negative, it should be reiterated, that the data presented here looks at year over year changes and we are coming off of a two-year period with high farm incomes. Thus, even if the ag credit market takes a step back, or even two, it is still well positioned to serve the agricultural sector. Farmers need to aware that interest rates, and thus their cost of debt, is likely to continue increases. Being proactive in locking in interest rates may be beneficial to control how much is spent on interest.
References
Federal Open Market Committee (2022) “Summary of Economic Projections” Federal Reserve
Federal Reserve Bank of Kansas City (2022) “Ag Finance Updates” Third Quarter Federal Reserve District Ag Credit Surveys.
Oppedahl, D. (2022) “Farmland Values and Credit Conditions” AgLetter No. 1998, Federal Reserve Bank of Chicago.
[1] The Fed Funds Rate is the interest rate at which deposit granting institution (i.e. banks) trade federal funds with each other.
![]()
![]()
![]()
![]()
![]()