A Time of Change? Indiana’s Farmland Market in 2014
August 8, 2014
PAER-2014-7
Craig L. Dobbins, Professor & Kim Cook, Research Associate
![]()
![]()
![]()
![]()
![]()
The boom that has characterized crop agriculture for the past several years seems to be waning. Prospects for above normal yields and growing stocks have resulted in a downward trend in grain and soybean prices. The current speculation is about how low prices will go and what will be the new normal? USDA has forecast net farm income to be down about 27% in 2014. But, even with this decline the forecast net farm income will remain $8 billion above the previous 10-year average.
While income prospects associated with crop farming have declined other factors that influence the farmland market remain strong. Interest rates continue to remain favorable, the farmland demand may have softened but there continues to be a limited supply of farmland for sale, farmland continues to be an attractive investment, and buyers still seem to be in a strong cash position.
The June 2014 Purdue Farmland Value Survey1, indicates the statewide increase in farmland values ranged from 6.4% to 7.1%. This was only half as much as in 2013. For the state as a whole, average and poor quality land increased 7.1% while top quality land increased 6.4% (Table 1). In June of 2014, top, average, and poor quality farmland had a value of $9,765, $7,976, and $6,160 per acre respectively.

Table 1. Average estimated Indiana land value per acre (tillable, bare land), per bushel of corn yield, and percentage change by geographical area and land class, selected time periods, Purdue Land Value Survey, June 2014
Statewide the change in cash rents ranged from a decline of 0.7% to an increase of 2.9% (Table 2). Much less than the 9% to 10% increase reported in 2013. Top, average, and poor quality farmland had a cash rent of $292, $232, and $179 per acre, respectively.
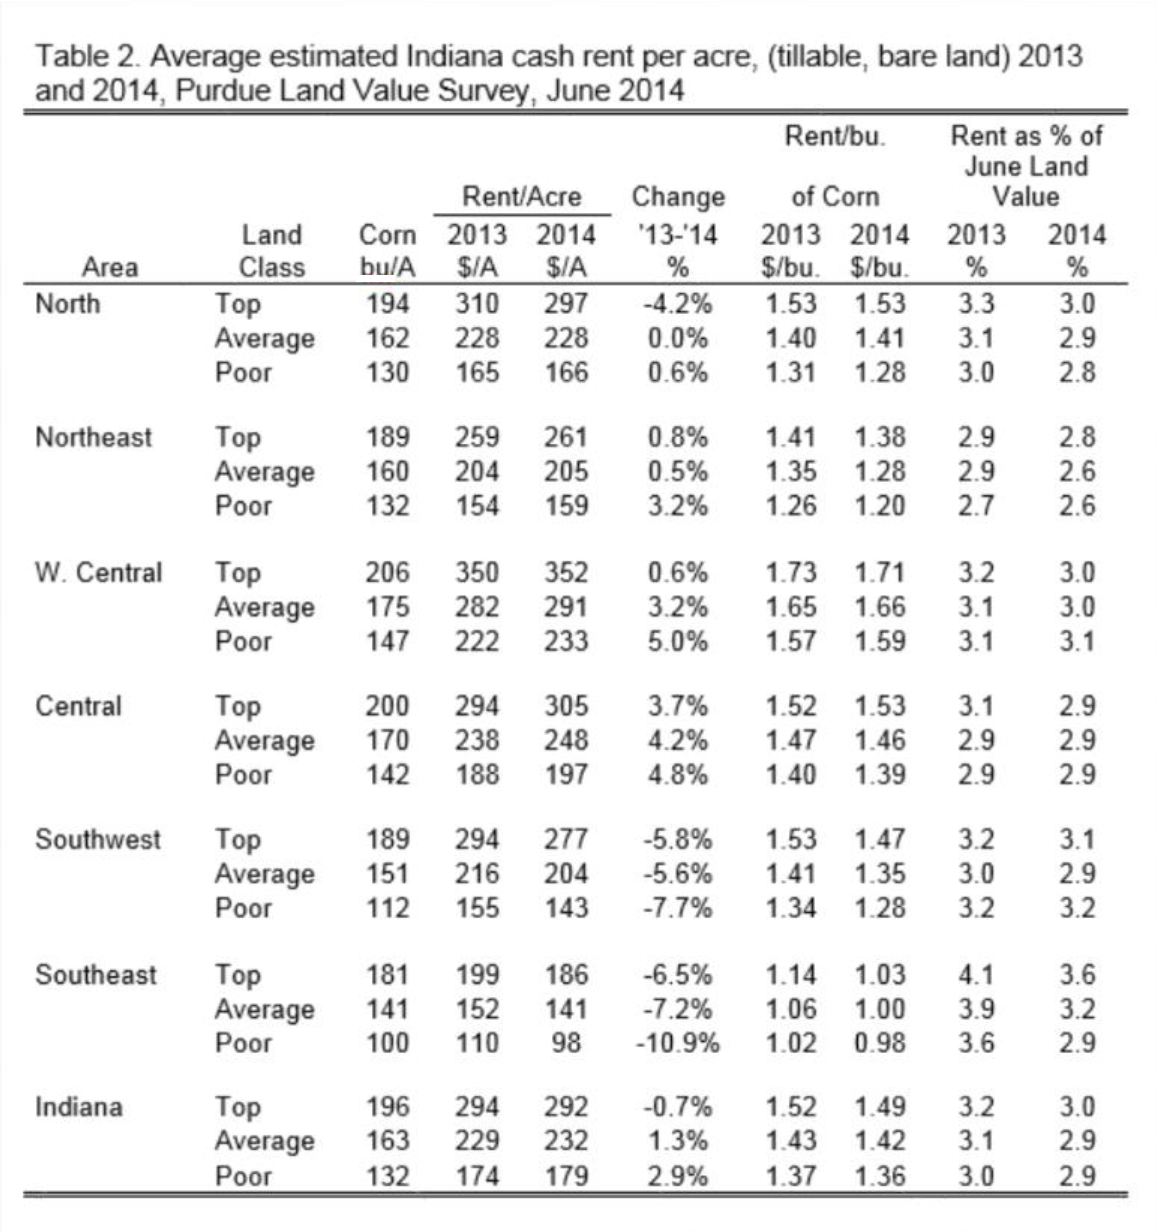
Table 2. Average estimated Indiana cash rent per acre, (tillable, bare land) 2013 and 2014, Purdue Land Value Survey, June 2014
To assess farmland productivity, survey respondents estimated long-term corn yields for poor, average, and top quality land. For the state, the average long-term corn yields for poor, average, and top quality land were 132, 163, and 196 bushels per acre, respectively.
The transitional land market that represents farmland moving out of agriculture, continues to move strongly higher. The survey indicated a 22.6% increase in its average value, increasing from $10,581 to 12,976 per acre. This is a specialized market with transitional land value strongly influenced by the planned use and location. The estimated value in this market has a very wide range. In June 2014, transitional land value estimates ranged from $1,600 to $35,000 per acre. Because of the wide variation in transitional land values, the median value2 may give a more meaningful picture than the arithmetic average. The median value of transitional land in June 2014 was $10,000 per acre, $500 per acre more than in 2013.
The June 2013 state-wide average value of rural recreational land, land used for hunting and other recreational activities, was $4,542 per acre, an increase of 19.9% when compared to June 2013. As with transitional land, there is a wide range of values for rural recreational land, again making the median value a more meaningful indictor than the arithmetic average. The median value for rural recreational land in June 2014 was $3,875 per acre, $725 more than in 2013, a 23% increase.
State-wide Rents
The increases in average state-wide cash rents were also moderate in 2014 when compared to the previous two years. The largest change in 2014 was for poor quality land, $5 per acre, or 2.9%. Rents for average quality land increased $3 (1.3%). Rent on top quality farmland decreased $2 or 0.7% per acre. The estimated cash rent was $292 per acre on top quality land, $232 per acre on average quality land, and $179 per acre on poor quality land (Table 2). These cash rent estimates represent gross rent. To arrive at a net return for the landowner, expenses such as real estate taxes, drainage assessments, insurance, and maintenance expenses would need to be subtracted. Per bushel of corn cash rent ranged from $1.36 to $1.49 per bushel.
For top quality farmland, cash rent as a percentage of farmland value was 3.0%. For average and poor quality farmland, cash rent as a percentage of farmland value was 2.9%. All three values declined when compared to 2013. These percentage values are the lowest in the 40- year history of the survey and continues the downward trend that started in 1986.
Area Land Values
Survey responses were organized into six geographic regions (Figure 1). As in the past, there are geographic differences. This year, regional farmland values increased in all areas except for the Southwest region. (Table 1). The percentage changes in the North, Northeast, West Central, Central, and Southeast were similar.
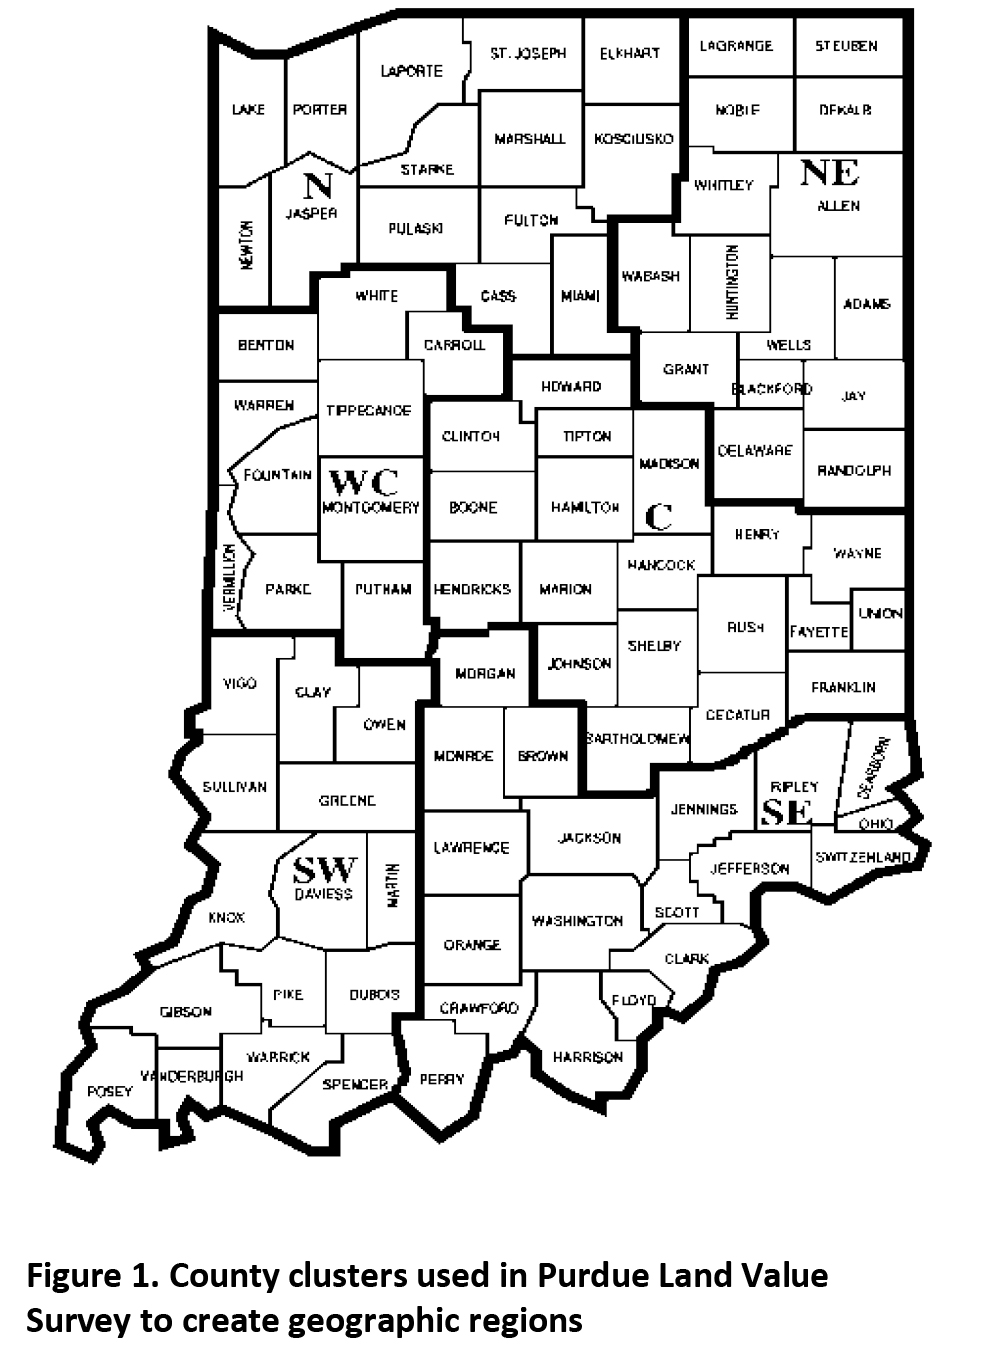
Figure 1. County clusters used in Purdue Land Value Survey to create geographic regions
The West Central region continues to have the highest per acre farmland values. The value for top, average, and poor quality farmland was $11,726, $9,616, and $7,611 per acre, respectively. The lowest farmland values are in the Southeast where top, average and poor quality farmland have values of $5,212, $4,368, and $3,350 per acre, respectively.
Land value per bushel of estimated long-term corn yield (land value divided by bushels) is the highest in the West Central region, ranging from $51.78 to $56.92 per bushel. The per bushel values for the North, Northeast, Central, and Southwest are quite similar, ranging from $40.29 to $52.64. The lowest per bushel values are in the Southeast, ranging from $28.80 to $33.50 per bushel.
Area Cash Rents
The largest percentage increase in cash rent was for poor quality land in Central Indiana, increasing 5.0% (Table 2). Across all three land qualities cash rent increases in the Northeast, West Central, and Central regions were similar, ranging from 0.5% to 5.0%. The strongest increases were in the Central region. The North region had a 4.2% decline in top quality land with average and poor quality land remaining steady. The Southwest and the Southeast regions saw reductions in cash rent ranging from 5.6% to 10.9%.
The highest per acre cash rent is $352 per acre for top quality land in the West Central region. Rents across land qualities in this region ranged from $233 to $352. This region has the highest cash rents for all land qualities. Cash rents continue to be the lowest in the Southeast, ranging from $98 to $186 per acre.
Differences in productivity have a strong influence on per acre rents. To adjust for productivity differences, cash rent per acre was divided by the estimated long- term corn yield. Rent per bushel of corn yield in the West Central region ranged from $1.59 to $1.71. Cash rent per bushel of corn yield in the North, Northeast, Central, and Southwest regions ranged from $1.20 to $1.53 per bushel. Per bushel cash rent in the Southeast ranged from $0.98 to $1.03 per bushel. Only one cash rent per bushel was less than $1.00 per bushel; this on poor farmland in the Southeast.
Range of Responses
Tables 1 and 2 provide information about the averages of the survey responses. Averages are helpful in establishing a general value for farmland and cash rent and the direction in which values and rents are moving across time. However, it is important to remember that an average is developed from a number of responses about perceived values and cash rents. In some cases, responses might be closely clustered around the average. In other cases, the responses may be widely dispersed because there is a wide difference in survey responses. It is possible to have the same, or nearly the same, average with either type of dispersion. Figure 2 illustrates these properties for farmland values. The top of the vertical lines is the average price plus one standard deviation. The bottom of the vertical lines indicates the average price minus one standard deviation. The square is the average. If farmland values are normally distributed, 66% of the respondents’ values will fall between the bottom and top value of the line.
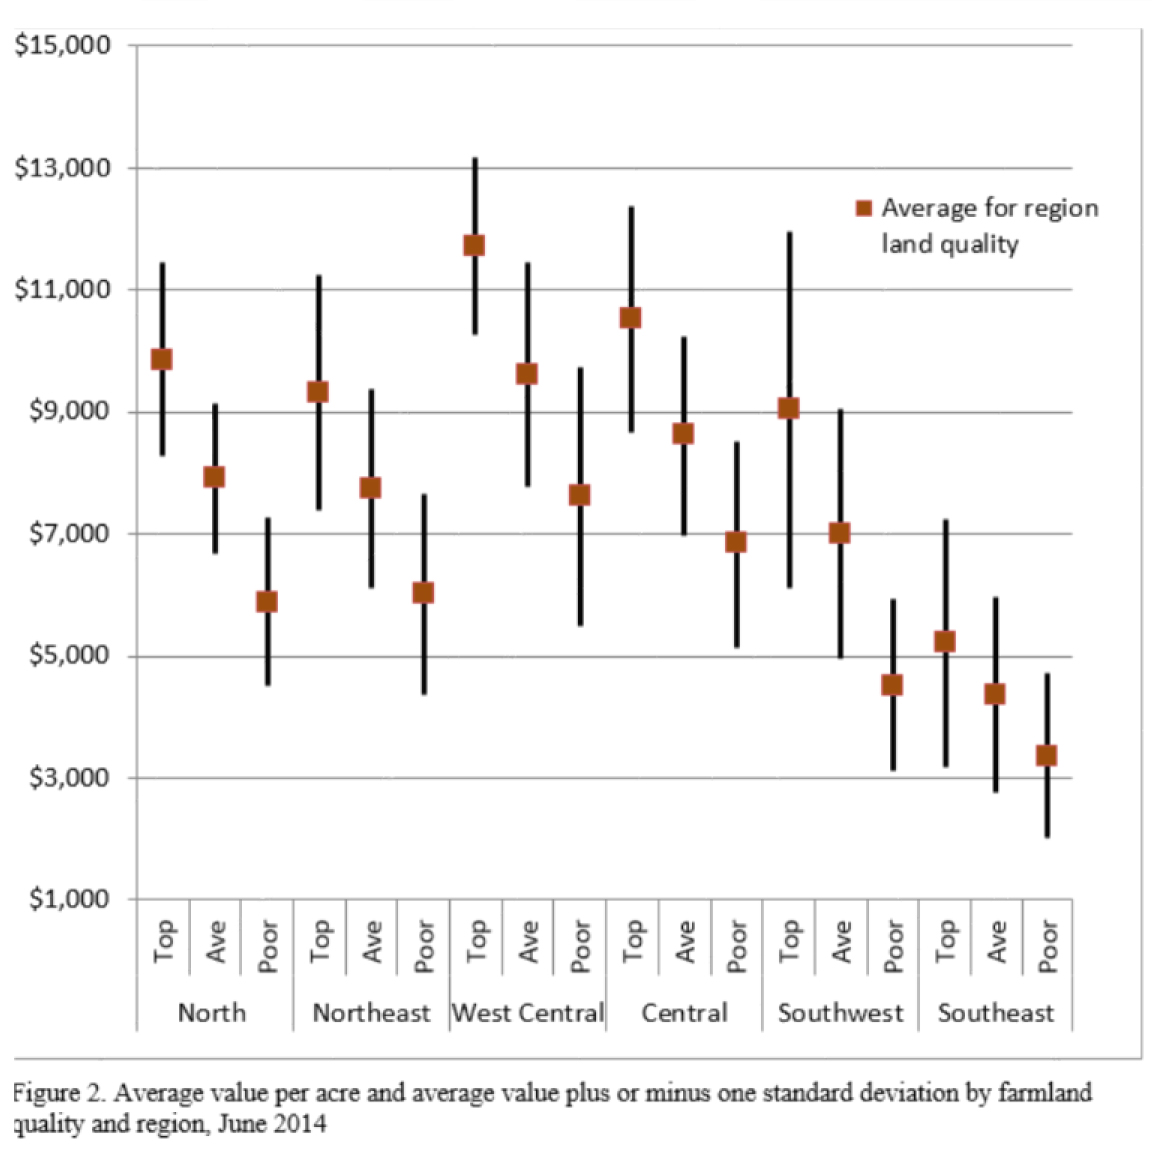
Figure 2. Average calue per acre and average value plus or minus one standard deviation by farmland quality and region, June 2014
Figure 3 illustrates the same information for cash rents. In both the case of farmland value and cash rent, the survey provides a general guide to values or rents but does not indicate a farmland value or cash rent for a specific farm. Arriving at a value or cash rent for a specific farm requires additional research or assistance from a professional.
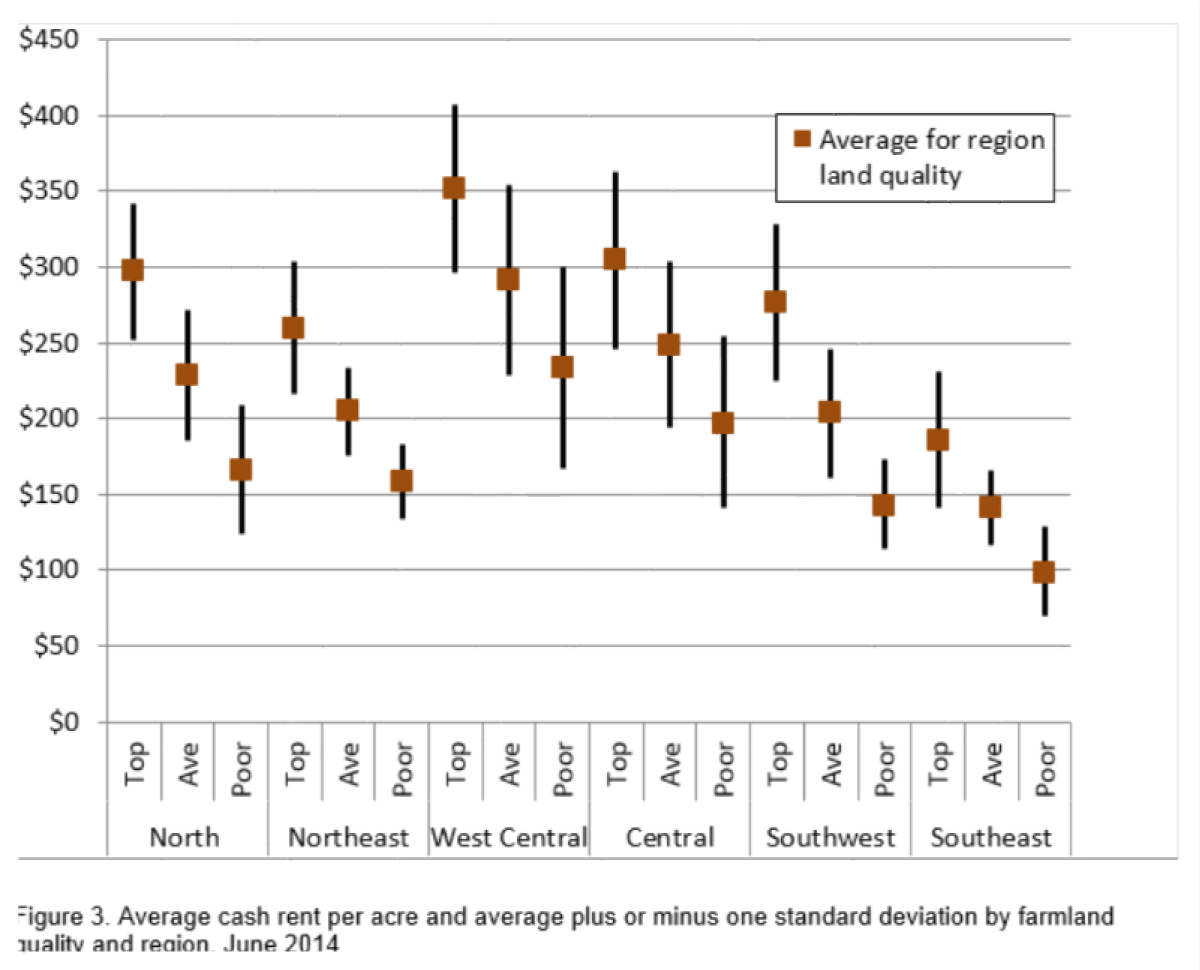
Figure 3. Average cash rent per acre and average plus or minus one standard deviation by farmland quality and region, June 2014
Rural Home Sites
Respondents were asked to estimate the value of rural home sites located on a blacktop or well-maintained gravel road with no accessible gas line or city utilities. These properties have a very wide range in value. Because of this wide range, median values (the value at the midpoint of the range) are used. The median value for five-acre home sites ranged from $8,500 per acre in the North region to $12,000 per acre in the Central region (Table 3). Estimated per acre median values of the larger tracts (10 acres) ranged from $8,750 per acre in the North region to $14,000 per acre in the West Central region. For 2014, the home site data indicate that for many of the regions the value of rural housing sites increased from June 2013 to June 2014.
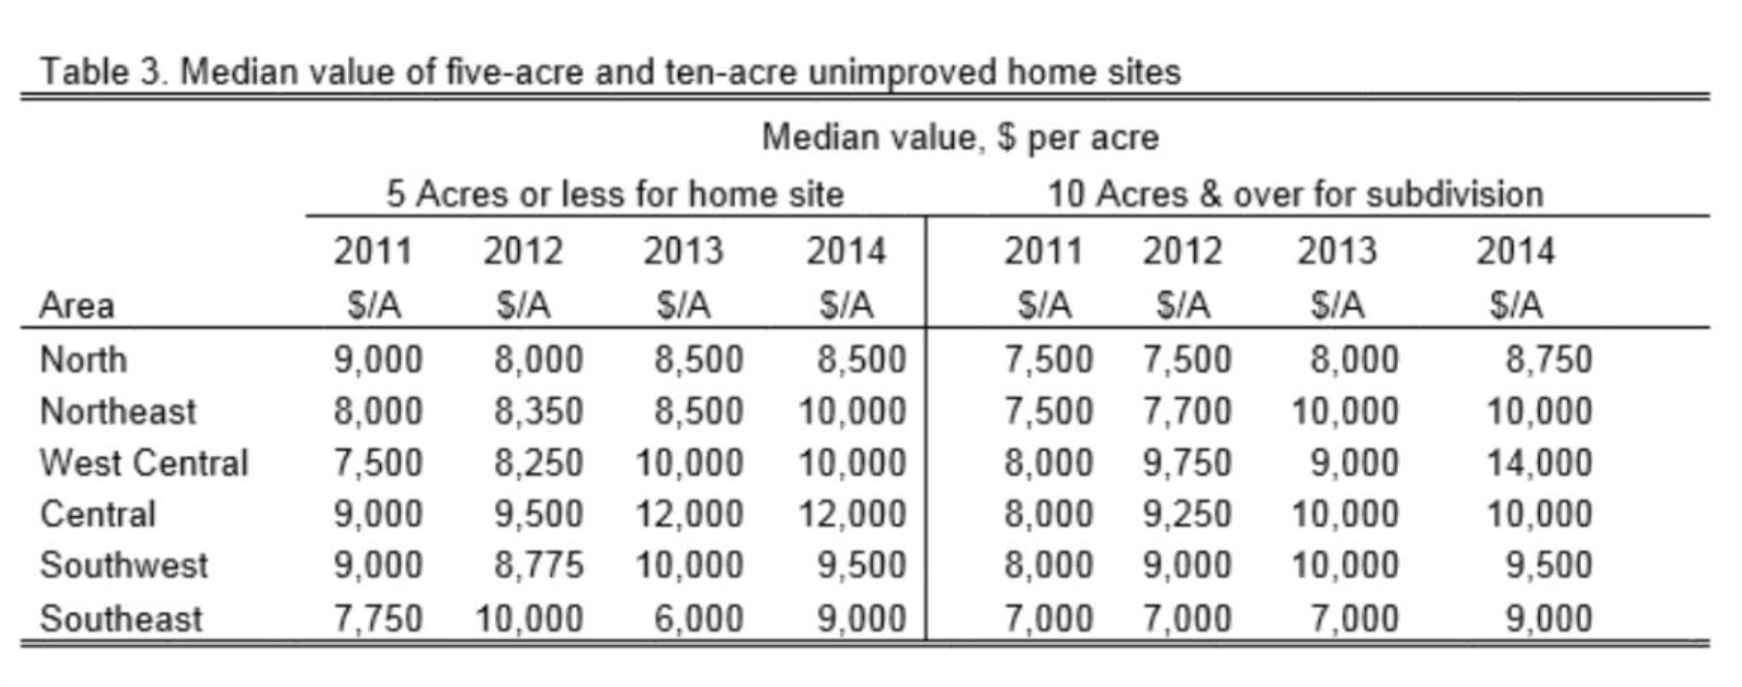
Table 3. Median value of five-acre and ten-acre unimproved home sites
Expected Grain Prices, Interest Rates, and Inflation
Current market conditions and expectations about the future have a strong influence on farmland values. To obtain information about their future expectations, survey respondents were asked to provide an estimate of the average corn and soybean price for the period 2014 to 2018. On average, survey participants expect corn prices to average $4.70 per bushel, a decline of $0.82 from their 2013 estimate (Table 4). The estimated five-year soybean price decreased $0.14 to $12.02 per bushel. If these prices are realized and current production costs for corn and soybeans do not change, the net return from soybean production will remain strong, but the return from corn production will be much smaller than the past four years. However, price expectations can quickly change. In addition to the change in corn price from 2013 to 2014, the change in five-year average price expectations for corn and soybeans from 2010 to 2011 also illustrate a major change in expectations. At the current time, the growing conditions for 2014, have raised concern about a large drop in corn and soybean price levels this fall. Where prices may be in 2015 and 2016 is even less clear.
Interest rates have important implications for real estate markets. As interest rates decline, the price of real estate tends to increase. There has been a general decline in interest rates for the past 30 years. Interest rates have reached a level where there seems to be little possibility of further declines. Signals from the Federal Reserve Bank indicate they plan to reduce the amount of monetary stimulus this Fall. If this occurs a rise in interest rates would be expected. Survey respondents’ expectations about the average long-term interest rate over the next five years indicates an expectation that interest rates will remain low. The 2014 expected interest rate was 10 basis points (0.1%) less than the estimate in 2013.
Inflation does not seem to be a worry. The expected inflation rate for the next five years is the same as reported last year. On average, survey respondents estimate annual inflation over the next five years will be 2.7%. Over the last five years, inflation expectations have only varied 0.6%.
Market Influences
Respondents’ expectations of corn and soybean prices are weaker, but expectations for other forces influencing farmland prices are still pointed in an upward direction. To identify the importance of the forces influencing the farmland market, survey respondents were asked to assess the influence of 11 different items. These items included: 1) current net farm income, 2) expected growth in returns to land, 3) crop price level and outlook, 4) livestock price level and outlook, 5) current and expected interest rates, 6) returns on competing investments, 7) outlook for U.S. agricultural export sales, 8) U.S. inflation rate, 9) current inventory of land for sale, 10) cash liquidity of buyers, and 11) current U.S. agricultural policy.
Respondents used a scale from -5 to +5 to indicate the effect of each item on farmland values. A negative influence is given a value from -1 to -5, with a -5 representing the strongest negative influence. A positive influence was indicated by assigning a value between 1 and 5 to the item, with 5 representing the strongest. An average for each item was calculated.
In order to provide a perspective on the changes in these influences, data from 2012, 2013, and 2014 are presented in Figure 4. The horizontal axis indicates the item from the list above. Given the decline in crop prices it comes as no surprise that current net farm income, the expected growth in returns, and crop price outlook have declined as positive forces in the farmland market. The crop price outlook, the third item, was just barely positive. However the outlook for livestock prices has seen a significant improvement.
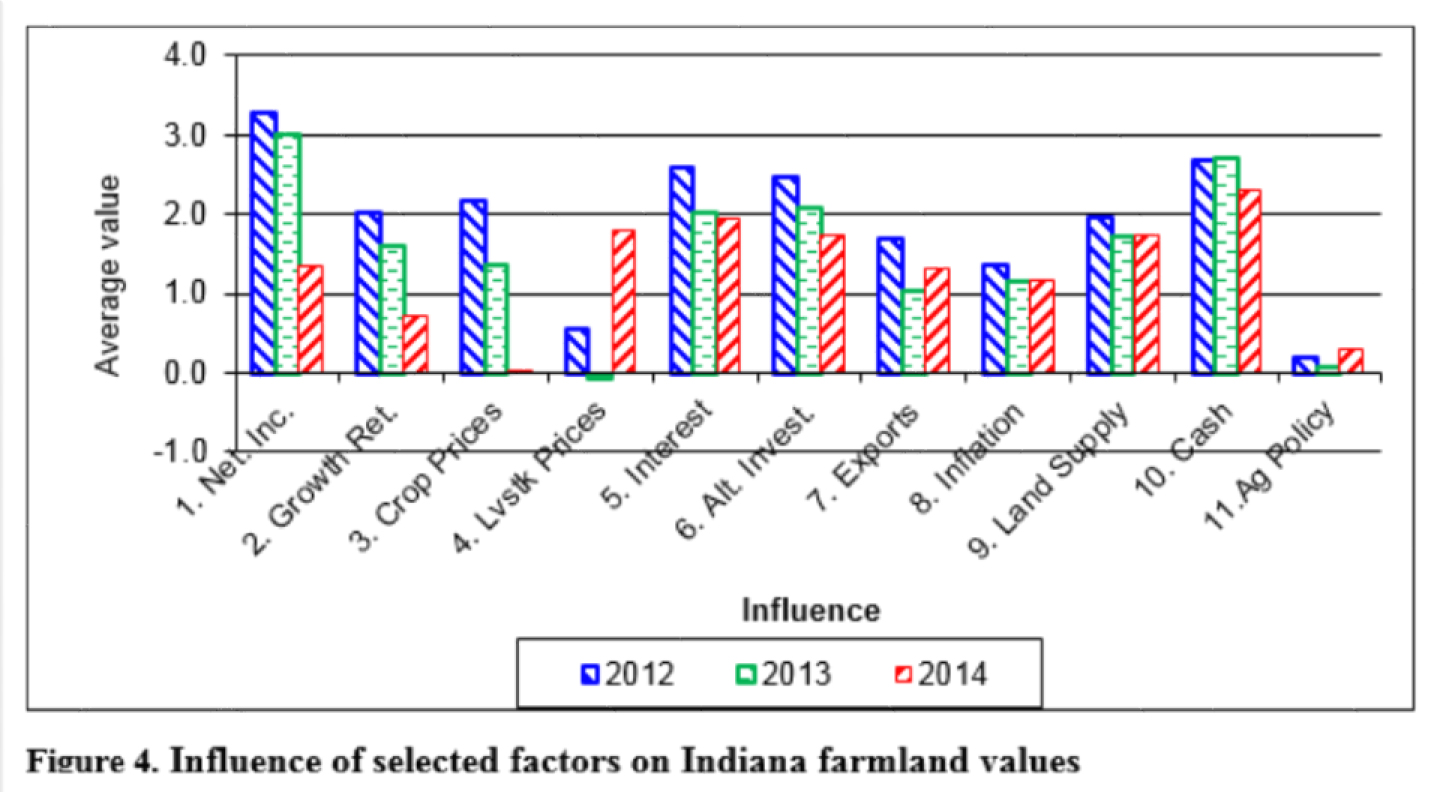
Figure 4. Influence of selected factors on Indiana farmland values
Interest rates, the return from alternative investments, supply of land on the market, and the cash position of buyers continue to be important positive influences in the farmland market. Current U.S. agricultural policy is perceived as having little influence on farmland prices. As the new Farm Bill is implemented and if commodity prices continue to decline, it seems likely that the importance of agricultural policy may increase.
Expected Future Land Values
In the short-run, survey respondents see the rise in farmland values stopping and being replaced by a modest decline. While the survey shows that farmland values were up for the June to June period, respondents reported a small decline for the period from December 2013 to June 2014. This means that the increase in farmland values occurred during the last half of 2013. During the first half of 2014 the general trend in farmland values has been slightly downward.
When asked to forecast farmland values in December 2014, Survey respondents expect the slow decline in values to continue. On a state-wide basis, Table 1 indicates that for the period from June to December 2014, survey respondents expect the farmland values to move slightly lower. Top farmland is expected to decline 0.9%, average land is expected to decline by 1.2% and poor land is expected to decline by 1.7%. While the differences across land quality are not large, these changes are consistent with the idea that higher quality land will be the best at holding its value. The pattern of adjustment is similar in most regions except in the Southeast region where small increases are expected.
Respondents also projected farmland values five years from now. Forty percent of the respondents expect farmland values to be higher. The average increase for this group was 13%. This translates into an average annual increase of 2.5%. Thirty-six percent of the respondents expect farmland values to decline. The average decline for this group was 12%, an annual decline of 2.5%. This leaves 23% of the respondents that do not expect any change in land values five years from now. Given the large increase in farmland values for the past several years, a period of steady values or a decline in value would not be surprising. From a historical perspective having a period of slow growth is also a possible outcome. Which path occurs will depend on how prices respond to the more equal balance between global supply and demand for grains and oil seeds.
Concluding Comment
Lower grain and soybean prices have significantly slowed the increase in farmland values and cash rents. In 2013 farmland values increased statewide by 14.7% to 19.1%. In 2014, this increase was 6.4% to 7.1%. However, the increase occurred from June to December 2013 and was followed by a modest decline from December 2013 to June 2014. Respondents indicate they expect the modest declines to continue through the remainder of 2014. These results indicate that the run-up in farmland values has either come to an end or will at least take a pause.
The grain and soybean price changes have affected cash rents in the same way. In 2013, state wide cash rents increased 9.4% to 10.9%. The 2014 survey found the change in statewide cash rents ranged from -0.7% to 2.9%. This is the first time since 2009 the survey has reported a decline in cash rent.
Based on futures market prices for 2015, 2016, & 2017 and the current costs of corn and soybean production (see 2014 Purdue Crop Cost & Return Guide) we are entering a period when crop farmers will be facing economic losses. This means there will not be sufficient income to provide a market return to all inputs. Farmers will be looking for ways to reduce their cost of production. The first resources that do not receive a market return are the economic charges for a farmers own labor and economic charges for machinery, buildings, and farmland. The cost of these items can be reduced by using fixed labor and machinery resources over more acres or delaying replacement. If these adjustments are not sufficient, then farmers will be looking to reduce the cost of seed, fertilizer, chemicals, and cash rent.
![]()
![]()
![]()
![]()
![]()