All Correlations Go to 1 in a Crisis: The Cattle Crush Spread during COVID-19 Crisis
April 20, 2021
PAER-2021-3
Authors: Eli Mefford, M.S. Student; Mindy Mallory, Associate Professor &
Clearing Corporation Charitable Foundation Endowed Chair of Food & Agricultural Marketing
![]()
![]()
![]()
![]()
![]()
The market adage “all correlations go to one in a crisis” refers to uniform financial market declines during times of extreme volatility. Essentially, unrelated assets may be traded as a group due to fears of the unknown. This appeared to be true in March of 2020. Faced with unprecedented uncertainty due to the COVID-19 pandemic, markets responded with sell offs across all asset classes, regardless of their susceptibility to the virus. Figure 2 shows the June contract for the E-Mini S&P 500 futures contract, which experienced dramatic falls throughout much of March. Similar drops were seen in agriculture futures exemplified by figure 3, showing the movements in the cattle crush spread. The cattle crush spread is a hedging tool composed of futures contracts for live cattle (LE), feeder cattle (GF) and corn (CZ) that measures the profitability of finishing beef calves.
The decline seen in cattle markets was popularly attributed to the shutdown of beef packing plants due to Covid outbreaks among their workers. The earliest plant shutdowns occurred at the end of March and continued through April (Reuters, 2020). Weekly cattle slaughter numbers reached a yearly low during the first week of May (Martinez et al., 2020). However, as seen in figure 3 many of the initial drops in the cattle crush spreads came in mid-March, coincident with declines in the S&P 500. Our research tests whether the cattle crush spread became correlated with broader equity markets during the COVID-19 stock market crash in March 2020. To this end we test for cointegration, a concept defining equilibrium between two or more price series. We examine the relationship of four cattle crush spreads that were trading at the time of the crisis and the June E-Mini S&P futures contract.
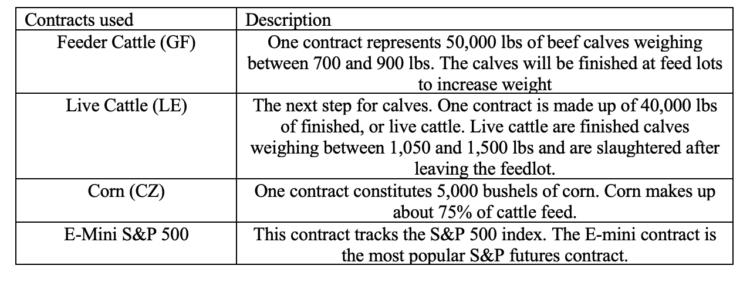
Figure 1: Description of Contracts used in Study
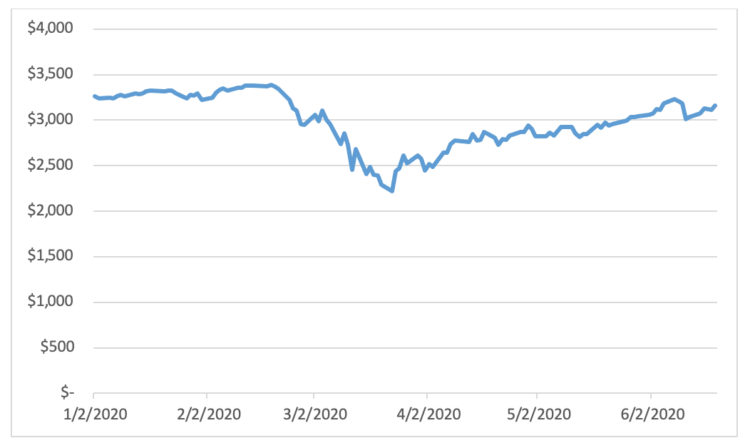
Figure 2: June S&P E-Mini Futures Contract, January to June
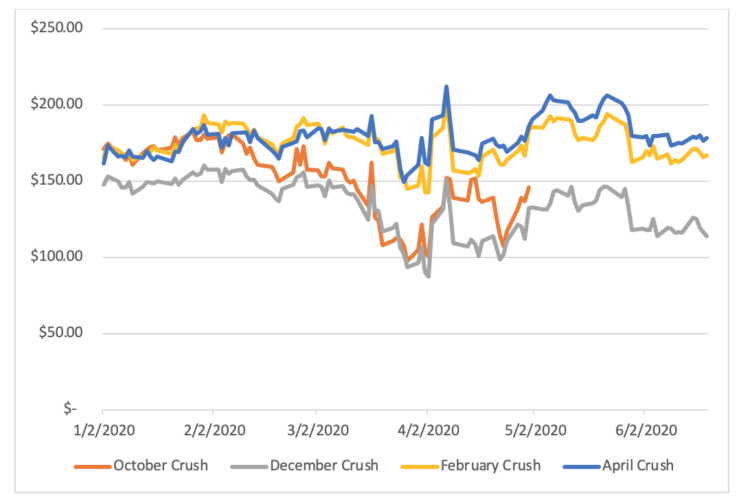
Figure 3: Cattle Crush Spreads, January to June
Visual Analysis of the Spread
Seen in figures 3 through 6, the spreads and their included contracts experience a slow decline before having an initial crash in late March, similar to the S&P 500. Packing plants began to shutdown during the beginning of April which coincides with the steep drop on April 2nd (Reuters, 2020). Figures 4 though 6 show how GF and LE futures quickly rebounded after this drop, while corn futures took until early summer before picking back up.
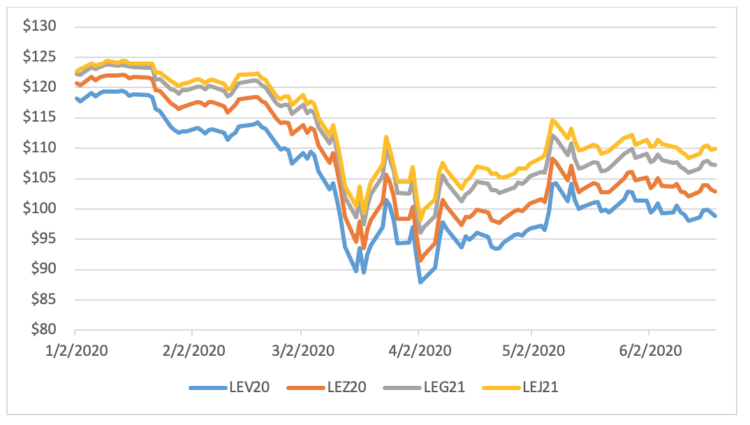
Figure 4: Live Cattle Contracts, January to June
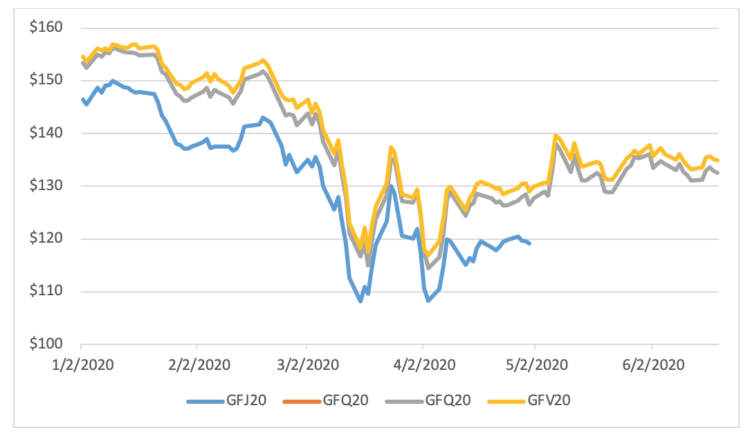
Figure 5: Feeder Cattle Contracts, January to June
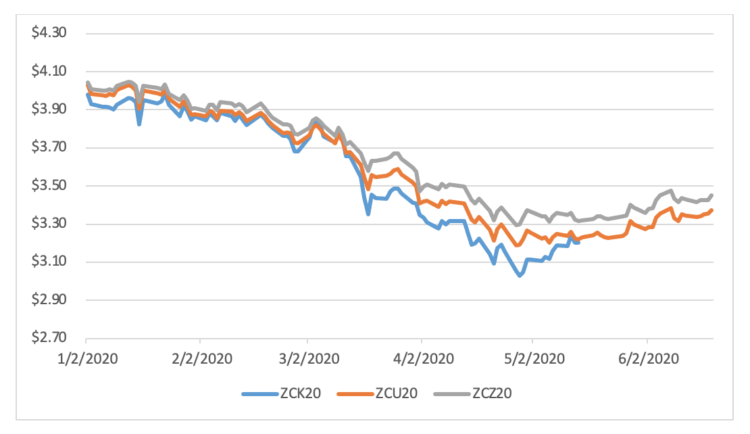
Figure 6: Corn Contracts, January to June
Shown in figures 4 through 6, cattle futures rose through the rest of the spring even with the occurrence of more packing plant shutdowns. This rise goes against the theory that plant shutdowns had large effects on the cattle crush spread. LE contracts are made up of cattle ready to be slaughtered and slaughter rates were declining during April so in turn LE futures prices should have been falling as there would be no market the ready to be slaughtered cattle (Martinez et al., 2020). At the same time feedlots who would be struggling to sell off their finished cattle would in turn slow down purchases of feeder calves so GF prices would also decline (Martinez et al., 2020). Despite the bearish situation cattle contracts rose steadily through April into May. Never again reaching their March or early April lows
Data and Methodology
The cattle crush spread tracks the key points in the cattle finishing process. The CME live cattle contract is composed of 40,000 pounds of finished calves ready for slaughter. The other cattle contract is the CME feeder cattle contract made up of 50,000 pounds of calves destined for feedlots. We chose GF contract expirations such that the GF contract expires between four and six months before the LE contract to allow for adequate time the feeders to reach finished weight. Corn futures contracts are included in the spread to account for feeding costs. Finishing rations are about 75% corn and is purchased closer to the GF contact expiration.
We use an 8-4-2 spread combination in our study. This represents eight LE contracts, four GF contracts and two CZ contracts. This combination can hedge approximately 266 animals placed at 750 lbs, marketed at 1,250 lbs and fed 10,678 bushels of corn. The spread acts a gross profit equation for feedlots with their output, LE, minus two of their main inputs, GF and CZ (Steiner). The total is then divided by 266 to give the result on a per calve basis.
Spread = ((Live Cattle $ * 8 * 400) – (Feeder Cattle $ * 4 * 500) – (Corn $ * 2 * 5000))/266
Since several expirations of the cattle spread were trading at the time of the March 2020 COVID-19 crisis, we refer to the spreads based on the expiration of their live cattle contract. The spreads we looked at were October 2020, December 2020, February 2021, and April 2021. These spreads were chosen because each constituent contract was trading during the date range we analyzed, which ran from January 1st, 2020 to June 19th, 2020.
The study time of January to June was divided into four sub areas for more detailed analysis and allowing the results to be compared between each of the time periods. Using a breakpoint test the time periods were set up as follows: January 1st to February 23rd, February 24th to March 18th, March 19th to April 29th and then April 30th to the end of our study on June 19th. The October spread includes the April feeder cattle contract which stops trading on April 30th, so we were unable to study cointegration in the last period for the October spread.
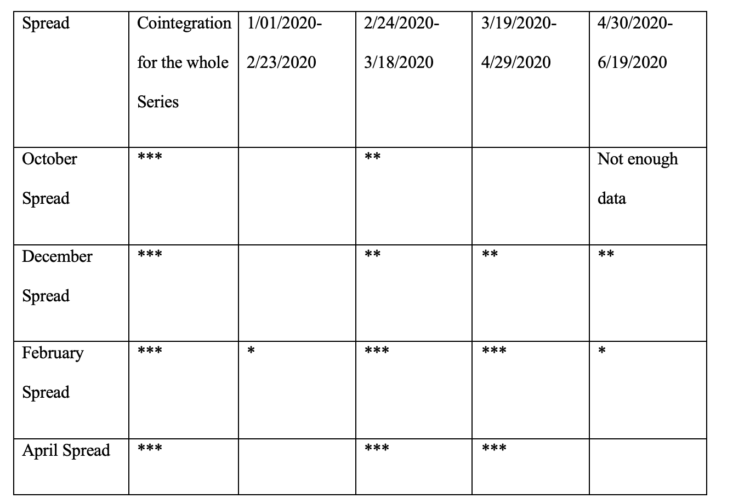
Figure 7: Cointergation Among Cattle Spread Constituents and S&P 500
Null = series is not cointegrated; * – Significant at the 10% level; ** – Significant at the 5% level; *** – Significant at the 1% level
Cointegreation Tests
All combinations of spreads and the S&P futures contract we look at are cointegrated to the 1% level over the whole time period of the study. Out of all the spreads, February is the only one to have evidence of cointegration during the January to February time frame. All four spreads are cointegrated to at least the 5% level during the time periods of February to March and three spreads are cointegrated from March to April. The December and February spreads continue to exhibit cointegration in the last time period of April to July.
Our analysis confirms that the cattle crush spreads and the June S&P 500 E-mini futures contract were cointegrated during the beginning of the Covid-19 pandemic. As it is unlikely that the S&P was being driven by cattle futures; it can be safe to conclude that the movements of the S&P had an impact on cattle futures. Despite the visual similarities and the cointegreation results there is no clear way to determine what exactly drove prices and it is probable that fears of production delays had a large role.
Discussion
Our analysis shows that the cattle crush spread became cointegrated with the S&P 500 futures duing the March 2020 COVID 19 crisis in U.S. equity markets. It appears this crisis-driven equilibrium relationship is an instance of the phenomenon, “All Correlations go to 1 in a Crisis”. The cattle crush spread is not typically related to the broader equity markets, rather dramatic swings in the spread can typically be attributed to a supply or demand factor directly related to cattle markets. The initial drop in the crush spread coincides with the equity market crash, which began a full month before the idling of capacity in beef slaughterhouses.
Citations:
Martinez, Charles C., Joshua G. Maples, and Justin Benavidez. 2020. “Beef Cattle Markets and COVID‐19.” Applied Economic Perspectives and Policy: aepp.13080.
Bradbury, Shelly. “More than 800 Greeley Meat Packing Plant Workers Call off as Coronavirus Is Confirmed among Employees.” Denver Post, 31 Mar. 2020.
Steiner, Len “THE CATTLE CRUSH AND REVERSE CRUSH: An Industry Hedging Tool And A Financial Investment Opportunity”. CME
Reuters Staff. “Factbox: Spread of coronavirus closes North American meat plants.” Reuters, 13 Apr 2020.
![]()
![]()
![]()
![]()
![]()