An Economic Comparison between Endophyte-infected Fescue and Other Forage Alternatives
January 12, 1998
PAER-1998-02
Patsy Schmitt, Graduate Student; Kenneth Foster, Associate Professor; Tim Baker, Professor; Kern Hendrix, Professor of Animal Science and Keith Johnson, Professor of Agronomy
![]()
![]()
![]()
![]()
![]()
Pasture forage productivity can significantly affect the profitability of beef cowcalf enterprises The principle feed for cow-calf enterprises is forage in the form of pasture and hay, and feed costs typically represent 40-50%of the annual costs of production for cow-calf operations. Recently, low cattle prices have challenged live-stock producers to increase the productivity of their operations. Improving the forage system is often a good way to do this, but should be treated and analyzed as an investment.
Much of Indiana’s pastures contain tall fescue. Tall fescue is a cool-season grass that has been used extensively because of its wide range of adaptation, greater resistance to drought, long grazing season, and ease of establishment. However, over 90% of tall fescue pastures are infected with the fungal endophyte, Acremonium coenophialum. Presence of the endophyte in tall fescue pastures produces a condition called “fescue toxicosis” which is characterized in beef cattle by decreased weight gains, low milk production, and low conception rates, a rough hair coat, and an inability to dissipate body heat. Schmidt and Osborn, and Paterson et al. have summarized the research that has been conducted thus far on the effects of endophyte-infected tall fescue on animal performance.
It is generally recognized that endophyte infected fescue pastures result in weaning weights about 50 pounds lower and cow conception rates about 20% lower when com-pared to cows grazing non-infected pastures (Fribourg et al.). Stuedemann et al. observed a significant negative linear relationship between average daily gain (ADG) and aver-age percent endophyte infestation among tall fescue treatments, observing that for each 10% increase in endophyte frequency, there was a 0.12 pound decrease in ADG. In the U.S. alone, the annual economic impact of the fescue problem has been estimated to be over $600 million (Hoveland).
The relationship between the fun-gal endophyte and tall fescue appears to be symbiotic. Thus, prior selection for higher yielding and hardier fescue plants has probably com-pounded the fescue toxicosis problem over time. Fortunately, recent efforts have led to the discovery of “low endophyte” varieties of tall fescue. These new varieties harbor the fun-gal endophyte in lower quantities yet have many of the desirable characteristics that have made tall fescue popular.
Research at the Southern Indiana Purdue Agricultural Center (SIPAC), Dubois, Indiana, has shown that interseeding a legume into an existing high endophyte fescue pasture or reestablishing a pasture with a low-endophyte fescue and legume forage (or an Orchardgrass and legume forage) improves cattle performance. However, the economic implications of investing in alternative forage systems have not been investigated.
This research addresses two related issues:
- What are the expected returns that can be earned from improved low-endophyte fescue forages once they have been established?
- How long will it take to recover the investment in an improved low-endophyte forage system?
Data Summary
Data from three alternative forage systems were evaluated in this study. These three systems were: 1) Kentucky-31 high-endophyte fescue interseeded with red and ladino clo-ver; 2) Martin low-endophyte fescue interseeded with red and ladino clover; and 3) Orchardgrass interseeded with birdsfoot trefoil. The infestation rates of the high endophyte tall fes-cue in the forage alternatives examined were 60% or more for the Kentucky-31 forage; 5% to 60% in the low-endophyte tall fescue pasture, Martin; and 5% or less in the Orchardgrass forage.
Data on each forage alternative was collected over 4 to 8 years (1987-1995) with approximately 10-30 cow-calf pairs grazing a specific forage system each year. SIPAC cattle breeds consist primarily of Angus x Hereford and Hereford x Angus crosses with some cows carrying one-fourth or one-half Simmental. It should also be noted that forage systems are well managed at SIPAC through periodic legume reseeding and soil fertilization.
Stocking rate, average weaning weight, average daily gain (ADG), and conception rate were calculated for each forage using the SIPAC cow and calf data (Table 1). Stocking rate was defined in terms of the average number of acres it took to support a cow-calf unit. The Martin and clover forage had the most efficient stocking rate with 1.2 acres per cow unit, followed by Kentucky-31 and clover at 1.5 acres per cow unit. The Orchardgrass and trefoil forage had the least efficient stocking rate requiring 1.6 acres per cow unit.
Average calf weaning weight and ADG were highest for the Orchard-grass forage at 550 pounds and 2.28 lbs per day, respectively. Orchard-grass performance was followed closely by that of Martin low-endophyte fescue with a 540-pound average weaning weight and an ADG of 2.17 lbs per day. In comparison, the Kentucky-31 forage generated a significantly lower calf weaning weight and ADG of 468 pounds and 1.80 lbs per day, respectively. Cow conception rate was highest for Martin at 85%, followed by Orchard-grass, and Kentucky 31 at 84%, and 74%, respectively.
Economic Analysis
An analysis of costs and returns was constructed for each forage to estimate average returns to labor, management, and overhead (RETURNS). Revenues were estimated from actual feeder calf, cull cow, and har-vested hay production. Costs consisted of direct costs (i.e. feed, veterinary, marketing, bull, and hay production) and indirect costs (replacement heifer, breeding stock investment, production inventory investment, pasture fertilization, and legume reseeding). Additional details of the methodologies used can be found in Schmitt.
In addition to the productivity measures discussed above, four key assumptions were used in this analysis to estimate RETURNS: 1) a feeder calf price of $78.00 per cwt. for 500-600 lb calves (1986-1995 average, annual price); 2) cull cow price of $44.51 per cwt. for 1,100 lb cows (1986-1995 average, annual price); 3) 1.3 replacement heifers retained for every culled cow in order to maintain a constant herd size; and 4) the stocking rates at SIPAC were a function of the forage system but not a function of soil conditions or management.
RETURNS calculated on a per acre basis are shown in Table 2. Martin generated the highest aver-age returns of $39.92 per acre, followed by Orchardgrass and Kentucky- 31 at $11.44 and -$46.41 per acre, respectively. The major difference between Martin and Orchardgrass stems from the difference in stocking rates.
Payback Period For Investment In Forage Systems
Producers with existing high endophyte pastures may choose to follow either of four strategies with respect to the above forage systems. These strategies are: 1) to liquidate their cattle enterprise; 2) stay with the status quo; 3) renovate the existing pasture; or 4) reestablish the pasture with a low-endophyte forage system. The first strategy may be correct in some extreme cases. However, over the longer run, cattle production is likely to be the most profitable use for the type of land often found in pasture throughout Indiana. The second strategy is clearly unprofitable as shown in Table 2. Therefore, the remaining question is whether the accumulated revenues, over time, from establishing a low-endophyte forage will exceed the establishment costs plus the foregone revenues from renovating the lower quality forage.
Net present value (NPV) analysis, which looks at the discounted revenues and expenses over a period of time, is useful for this analysis. Essentially, NPV allows comparison between alternative investments to be made in equivalent current dollar values even though the cash inflows and outflows may occur at different times in the future. In this study, NPV analysis was used to determine the payback period required to recover the investment costs of for-age reestablishment.
One renovated forage and two reestablished forage systems were evaluated in this study. The renovated forage system used a preexisting Kentucky-31, high-endophyte fescue pasture interseeded with red and ladino clover. The two reestablished forage systems were Martin low-endophyte fescue interseeded with red and ladino clover; and Orchardgrass interseeded with birdsfoot trefoil.
Pasture reestablishment is the replacement of a pasture with a new forage system. Herbicides are generally used to kill the existing pasture. At SIPAC, glyphosate (Round-up) was applied in the fall and following spring to kill the existing forage.
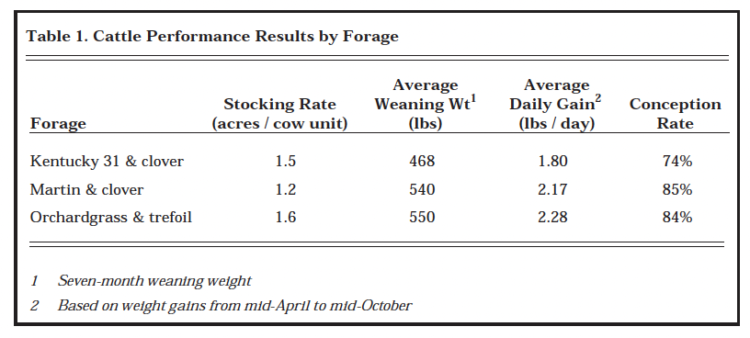
Table 1. Cattle Performance Results by Forage
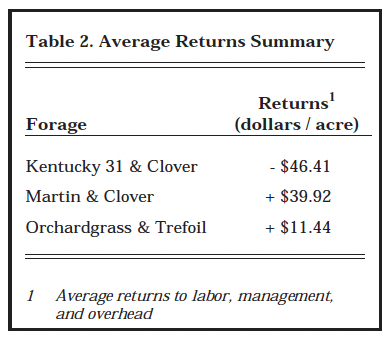
Table 2. Average Returns Summary
Herbicide 2,4-D was also applied in the spring and the new forage was seeded. Reestablishment costs for Martin and Orchardgrass were estimated to be $99.07 and $100.26 per acre, respectively (see Table 3 for the reestablishment budget for Martin).
Pasture renovation maintains the existing grass while interseeding a legume into the pasture. At SIPAC, birdsfoot trefoil (reseeded every third year) or the combination of red and ladino clover (reseeded every second year) were used. Average, annual renovation costs were estimated at$8.23 per acre per year.
The length of time needed to recover the establishment expenses (payback periods) for Martin and Orchardgrass were calculated next. The payback periods presented in Tables 4 through 9 represent the number of years that are required before the reestablished forage strategy begins to generate a positive net present value. Payback periods were calculated for a variety of scenarios because prices, interest rates, and animal performance can vary greatly across years, farms, and genetics. For example, the payback period for reestablishing a pasture with Martin was calculated to be 2.5 years using a 9% interest rate, a calf price of $78.00, a weaning weight of 540 pounds, and conception rate equal to 15% (Table 4).
Payback Periods For The Martin Forage System
The results of the NPV analysis on the Martin forage strategy are presented in Tables 4 through 6. Table 4 evaluates a change in calf prices. The average calf price during the study period was $78.00 per cwt. As calf prices increase, the payback period declines. In contrast, as calf prices decrease, the payback period increases. For example, the payback period for a $70 calf price was 13.9 years compared to 2.5 years for a $78 calf price (holding the interest rate constant at 9%).
Table 5 examines the effect of the weaning weight on the payback peri-od. The average weaning weight for Martin was 540 pounds. A 580 lb. weaning weight decreased the pay-back period to 1.6 years (using a 9%interest rate). However, reducing the weaning weight from 540 pounds to 460 pounds produced a negative net return for the Martin forage. There-fore, the investment can never be recouped (thus the symbol -), and it would not be profitable to reestablish a pasture with Martin if expected weaning weights were only 460 pounds.
Table 6 examines the effect of changing the conception rate. The average conception rate for Martin was 85%. Using a 9% interest rate, the payback periods for a 80%, 85%, and 90% conception rate were 5.1, 2.5, and 1.5 years, respectively.
Payback Periods For The Orchardgrass Forage System
Payback periods are presented in Tables 7 through 9 for the reestablished Orchardgrass forage. The smaller (per acre) average return for Orchardgrass increased the time required to recover the costs of reestablishing a pasture with Orchard-grass. For example, using a 9%interest rate and the average feeder calf price, weaning weight, and culling rate, the expected payback period for Orchardgrass was 9.5 years ver-sus 2.5 years for Martin.
The average calf price during the study period was $78 per cwt. If calf prices were increased to $82 and $86, payback periods would decline from 9.5 years to between two and four years (Table 7). On the other hand, decreasing calf prices to $70 and $74 per cwt. generated negative returns making reestablishment of Orchardgrass unprofitable.
Changes in calf weaning weight also affected the payback period
(Table 8). The average weaning weight was 550 pounds. Increasing the weaning weight to 580 pounds decreased the payback period by more than 50% to just 3.8 years
(using a 9% rate). However, reducing the weaning weight to 500 and 460 pounds resulted in negative NPV. That is, the sum of the discounted revenues did not exceed the costs of reestablishment. Therefore, it is not profitable to reestablish a pasture with Orchardgrass at 460 and 500 lb. weaning weights.
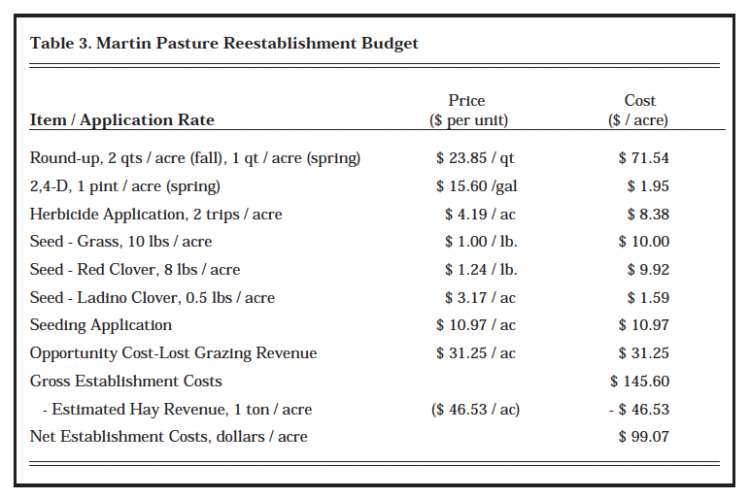
Table 3. Martin Pasture Reestablishment Budget
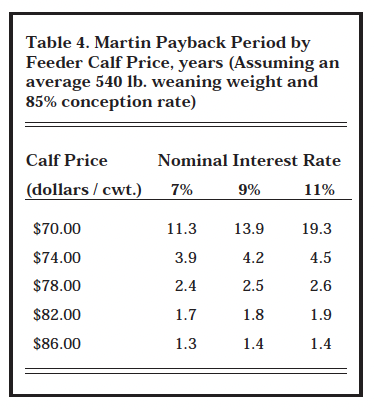
Table 4. Martin Payback Period by Feeder Calf Price, years (Assuming an average 540 lb. weaning weight and 85% conception rate)
The effect of changing the conception rate is presented in Table 9 for three interest rate assumptions. The payback period decreased from 9.5 to 2.5 years when the conception rate was increased from 84% to 90% (using 9% interest). However, when the conception rate was decreased to 80%, the average returns to the Orchardgrass forage were negative.
Summary
Average returns to labor, management, and overhead on a per acre basis were calculated for each forage. The Martin low-endophyte fescue and clover forage generated the high-est mean RETURNS of $39.92 per acre. Orchardgrass and Kentucky-31 followed with returns of $11.44 and -$46.41 per acre, respectively. These returns are dependent upon the stocking rate used for each forage.
Net present value (NPV) analysis looked at the benefit of establishing a new forage versus renovating an infected fescue pasture with clover. At a 9% interest rate, the payback period for reestablishing with Martin low-endophyte fescue and clover was 2.5 years. Reestablishing a pasture with Orchardgrass and birdsfoot trefoil resulted in an 9.5 year average payback period. The payback periods are sensitive to changes in interest rates, calf prices, weaning weights, and culling rates. Therefore, management of the beef enterprise and forage system will substantially affect the time required to recover the investment costs of reestablishing a pasture.
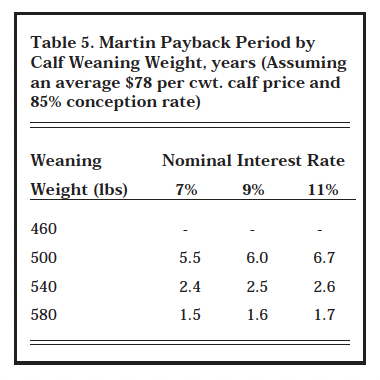
Table 5. Martin Payback Period by Weaning Weight, years (Assuming an average $78 per cwt. calf price and 85% conception rate)
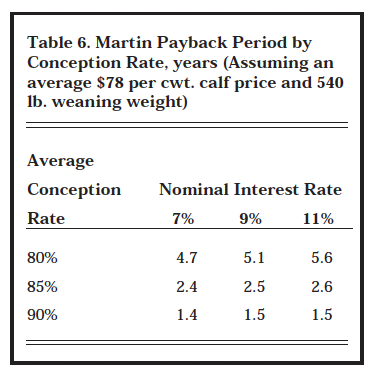
Table 6. Martin Payback Period by Conception Rate, years (Assuming an average $78 per cwt. calf price and 540 lb. weaning weight)
Two aspects of the grazing research merit continued attention. Both involve the longevity of the new pasture systems. First, there exists a potential for reinfestation by the high-endophyte fescue. This reinfestation may come from fence rows, animal born seeds, or improper eradication of the previous forage. Second, there is some anecdotal evidence that bunch grasses, such as Orchardgrass, have limited longevity. Continuing studies will help to quantify the productive stand life of Orchardgrass relative to that of tall fescue and to determine likelihood of significant high-endophyte fescue reinfestation.

Table 7. Orachardgrass Payback Period by Calf Price, years (Assuming an average 550 lb. weaning weight and 84% conception rate)
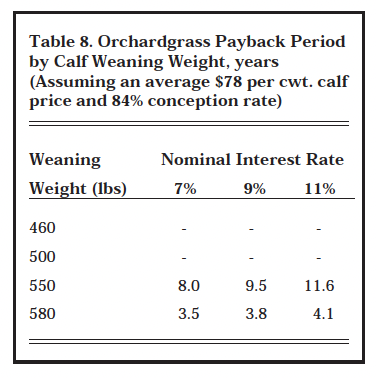
Table 8. Orchardgrass Payback Period by Calf Weaning Weight, years (Assuming an average $78 per cwt. calf price and 84% conception rate)
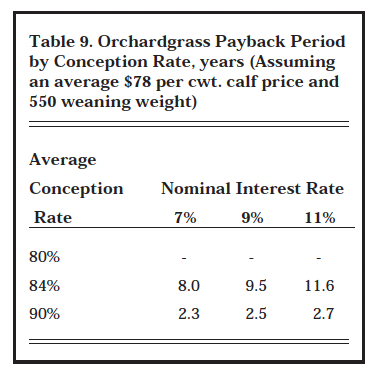
Table 9. Orchardgrass Payback Period by Conception Rate, years (Assuming an average $78 per cwt. calf price and 550 weaning weight)
List Of References
Fribourg, H.A., C.S. Hoveland, and K.D. Gwinn. “Tall Fescue and the Fungal Endophyte — A Review of Current Knowledge”. Tennessee Farm Home Science. 160(1991) 30-37.
Hoveland, C.S. “Importance and Economic Significance of Acremonium endophytes to Performance of Animals and Grass Plants”. Agriculture, Ecosystems and Environment. 44(1993) 3-12.
Paterson, J., C. Forcherio, B. Larson, M. Sam ford, and M. Kerley. “The Effects of Fescue Toxicosis on Beef Cattle Productivity”. Journal of Animal Science. 73(1995) 889-898.
Schmitt, P. “Economic Analysis of Low Endophyte Forage Grazing Systems for Beef Cow-Calf Enterprises,” M.S. Thesis, Department of Agricultural Economics, Purdue University, West Lafayette, IN, 1996.
Schmidt, S.P., and T.G. Osborn. “Effects of Endophyte-Infected Tall Fescue on Animal Performance”. Agriculture Ecosystems and Environment. 44(1993) 233-262.
Stuedemann, J.A., S.R. Wilkinson, D.P. Belesky, C.S. Hoveland, O.J. Devine, F.N. Thompson, H.C. McCampbell, W.E. Town-send, and H. Ciorida. “Effect of Level of Fungus and Nitrogen Fertilization Rate of Kentucky-31 Tall Fescue on Steer Performance”. Journal of Animal Science. 63(1986) 290-291.
![]()
![]()
![]()
![]()
![]()
