An Update on Farmland Assessment for Property Taxes
February 18, 2009
PAER-2009-1
Larry DeBoer, Professor and Specialist on Indiana Taxation*
![]()
![]()
![]()
![]()
![]()
Farmland property taxes are rising because the assessed values of farmland are rising. Assessed values are rising because the “base rate” of farmland is rising. And the base rate is rising because the formula that calculates the base rate includes measures of land rent, yields, commodity prices and interest rates. The first three are rising, the last is falling, and all of those changes increase the base rate.
In August the Purdue Agricultural Economics Report published my article about farmland assessments. Since then, we have new information. The Indiana Department of Local Government Finance (DLGF) has announced the base rate for taxes in 2010, and there is now enough data from 2008 to project the base rate for taxes in 2012.
Farmland assessments in Indiana start with a “base rate” per acre set by the DLGF. It’s the same for all farmland in the state. To assess any particular acre, this base rate is multiplied by a soil productivity factor, which measures the productivity of the soil for growing corn, and ranges from 0.5 to 1.28. Some acreage also is adjusted by an “influence factor,” which reduces the assessment for features like flooding or forest cover.
The productivity factor of a farmland parcel is unlikely to change, and neither is the influence factor. But the base rate changes every year, as part of the trending of assessed values. Increases in the base rate are the reason that farmland assessments are rising.
Figure 1 shows the history of the base rate since 1980. The years indicate the “pay year,” the base rate used for tax bills in that year. From before 1980 though taxes in 2002, the base rate was a negotiated number. It changed only in years of general reassessment. Agricultural interest groups (such as the Farm Bureau) would meet with officials from the State Board of Tax Commissioners, known as the Tax Board, the predecessor of the DLGF. They would hammer out a base rate. In 1980 they decided on $450 per acre. This figure was used for tax payments until 1990. For the 1990 reassessment, the base rate was increased to $495, and for the 1996 reassessment it was left at $495.
In December 1998 the Indiana Supreme Court declared Indiana’s assessment system unconstitutional and decided that assessments must be based on “objective measures of property wealth.” The decision also found that farmland assessments did not have to be based on selling prices, or market value. The Tax Board and later the DLGF developed the base rate capitalization formula to meet this requirement. The formula uses (a lot of) objective data, and capitalization formulas are a recognized method for measuring property value or wealth.
The base rate for 2003 taxes was set at $1,050, based on the average capitalized value for the four years 1996‑1999. This more than doubled the base rate, and it meant that farmland was one of the property types that saw big tax increases in that reassessment, along with older homes and rental property.
The court decision also implied the need for trending, annual adjustments of assessed values to keep them close to objective measures of property wealth, between statewide reassessments. Trending started for farmland for taxes in 2006, one year before it started for other real property. The capitalization formula dropped the base rate to $880 in 2006, based on an average of the values for 1999‑2002. The General Assembly held the base rate at that level for 2007 taxes. The capitalization formula was modified to use a six‑year average, and trending resumed for 2008 taxes.
Table 1 shows the figures that have been used in recent years to calculate the base rate. The numerator of the capitalization formula is calculated from net income figures, one based on land rents, one based on operating incomes calculated using yields, commodity prices, and costs. In the denominator is an interest rate based on real estate and operating loan interest rates. The August PAER article “What’s Happening to the Assessed Value of Farm Land?” described this formula in more detail.
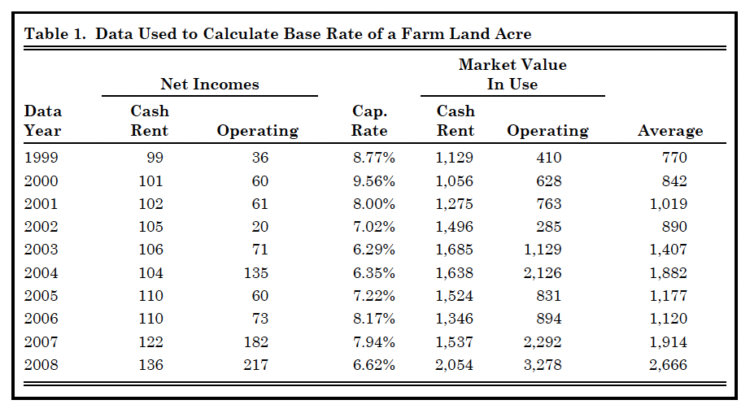
Table 1. Data Used to Calculate Base Rate of a Farm Land Acre
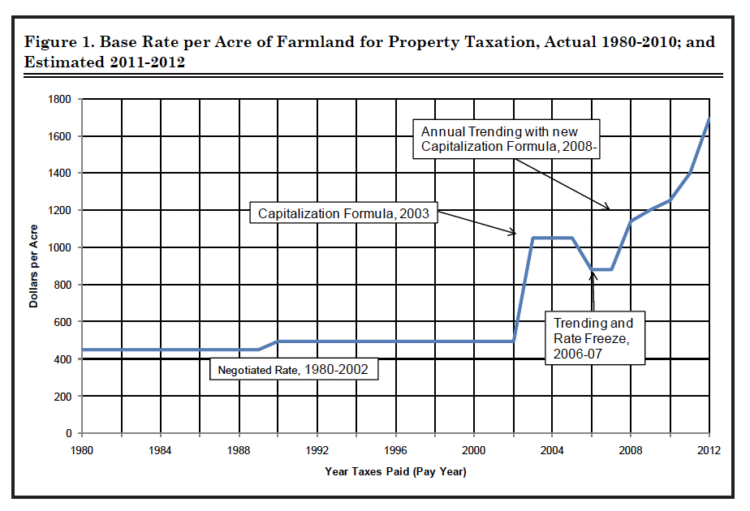
Figure 1. Base Rate per Acre of Farmland for Property Taxation, Actual 1980-2010; and Estimated 2011-2012
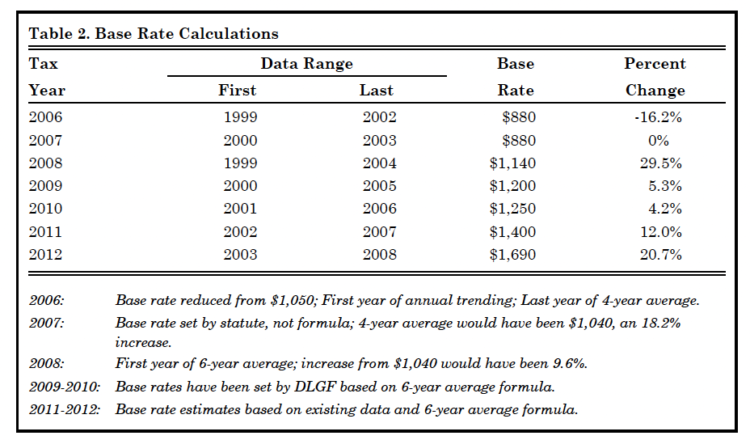
Table 2. Base Rate Calculations
The base rate for 2009 taxes is an average of the calculations from 2000 to 2005. The result is $1,200, shown in Table 2. The DLGF recently announced the base rate for 2010 taxes at $1,250, based on the calculations from 2001 to 2006. This 4.2% increase results because the average base rate calculation was $842 in 2000, the year that was dropped, and $1,120 in 2006, the year that was added. The 6‑year average increased as a result.
We already know all the data for 2007 which will be used to calculate the base rate for 2011 taxes. Plugging these numbers into the formula gives a 2007 figure of $1,914, much higher than the 2001 figure of $1,019 that will be dropped. This will increase the 6‑year average base rate 12% to $1,400. (Note that this is higher than the estimate made in the August PAER article, because the final data on government payments have become available.)
Likewise, most of the data needed for the calculation of the 2008 average are available. It is clear that the 2008 figure to be added to the base rate calculation for 2012 taxes will be much greater than the 2002 average that will be dropped. The 2008 figure is $2,666; the 2002 figure is only $890. The 6‑year average base rate for 2012 taxes is likely to rise 20.7% to $1,690.
The average calculations for 2007 and 2008 are so high because commodity prices were high in those years (see the appendix for the 2008 operating net income calculation). Costs are rising too, but not enough to offset the higher corn and soy‑ bean prices. The 2007 figure will be included in the base rate through the year 2016, the 2008 figure through the year 2017.
In 2008 the General Assembly passed a major property tax reform bill. Average homeowner tax bills dropped by one‑third in 2008 as a result of new credits, and this reduction will hold in the future. In 2009 and after property taxes will no longer be used to support the school general fund and county welfare funds. The state will take over fund‑ ing for these functions.
This would reduce tax rates for all property, except that homeowners have been granted a new 35% home‑ stead deduction, which will sub‑ stantially reduce total assessments. Since tax rates are calculated by dividing local levies by local assess‑ ments, the lower assessed value will increase tax rates. Further, prop‑ erty tax replacement credits will be eliminated in 2009, and this was a percentage reduction in tax bills for which farm land was eligible. This part of the property tax reform will not reduce most farm land tax bills.
The tax reform also created property tax caps. Tax bills for home‑ steads will be limited to 1.5%
of gross assessed value (before deductions) in 2009, and 1% in 2010 and after. Other residential property and farm land will be limited to 2.5% in 2009 and 2% in 2010. All other property, including farm buildings and equipment, will be limited to 3.5% in 2009 and 3% in 2010. When tax bills exceed the caps, the tax‑ payer gets a tax credit against his or her property tax bill.
Farm land does not receive many deductions, so these caps are effec‑ tively limits on tax rates. In 2010, if the tax rate exceeds 2% on a farm acre, the owner would receive a credit. It’s too soon to tell what tax rates will be after all the reforms, but it is likely that tax rates after credits in 2008 will be similar to tax rates after the reforms in 2010.
Most farm land is located in unincorporated areas, outside of cities and towns. In 2008 the tax rates after credits were under 2% in 83% of the unincorporated taxing districts. Tax rates on most farm land will be less than 2%. Thus, few farm land owners will benefit from the property tax caps.
This is good news for farmers, in that most of their tax bills won’t be high enough to hit the tax caps. But the General Assembly’s property tax relief debate in 2009 will focus on whether to add the caps to the state Constitution. This debate will have little to do with farm land property taxes.
Without doubt agricultural interests will work to revise the capitalization formula, to lessen the impact of higher commodity prices on farm land assessments. That might be a tough sell in the General Assembly, though, because in rural areas the tax base is mostly farm land and houses. If farm land assess‑ ments are lower, taxes will shift to homeowners. And higher taxes for homeowners are not on the General Assembly’s agenda.
Appendix
Calculation of the operating net income for 2008.
The big jumps in the base rate in 2011 and 2012 are mainly due to the big increase in the operating net incomes in 2007 and 2008, $182 per acre in 2011 and $217 per acre in 2012 (see Table 1). Here’s a version of how the 2008 figure is calculated, simplified from the method used by the Department of Local Government Finance.
- Corn yield: 160 bushels per acre, from the Indiana Agricultural Statistics Service and USDA.
- Corn price: $4.28 per bushel, the average of the November price, the calendar year average price, and the marketing year average price.
- Gross income: $685, (Corn price times yield).
- Variable costs: $380 per acre, from the Purdue Crop Guide.
- Average contribution margin, corn: $305 (gross income less variable costs).
- Beans yield: 44 bushels per acre, from IASS and USDA.
- Beans price: $10.42 per bushel based on the November, annual average and marketing year prices.
- Gross income: $458, (Bean price times yield).
- Variable costs: $132 per acre, from the Purdue Crop Guilde.
- Average contribution margin, beans: $326.
- Government payments: $13 per acre (author’s estimate based on trend changes).
- Total contribution margin: $322 per acre (corn margin plus beans margin plus government payments, divided by two).
- Minus overhead: $107 per acre (sum of machinery, handling, labor costs from the Purdue Crop Guide, and property taxes, estimated by the author based on trends and policy changes).
- Net return to land: $215 per acre (total contribution margin less overhead).
This is close to the $217 per acre figure in Table 1. The actual method used by DLGF is a more complex version of the method here. It rounds the numbers to the nearest dollar at different points in the calculation.
For more information
DeBoer, Larry. “Indiana’s 2008 Property Tax Reforms, Part 2” Purdue Agricultural Economics Report, August 2008 [www.agecon.purdue.edu/extension/pubs/paer/2008/august/paer0808.pdf].
DeBoer, Larry. “What’s Happening to the Assessed Value of Farm Land?” Purdue Agricultural Economics Report, August 2008 [www.agecon.purdue.edu/extension/pubs/paer/2008/august/paer0808.pdf].
DeBoer, Larry. “Indiana’s 2008 Property Tax Reforms, Part 1” Purdue Agricultural Economics Report, May 2008 [www.agecon.purdue.edu/extension/pubs/paer/2008/may/paer0508.pdf].
“Farmland Assessment for Property Taxes,” Indiana Local Government Information website, Revised January 2009 [http://www.agecon.purdue.edu/crd/Localgov/Topics/Essays/Prop_Tax_FarmLand_Asmt.htm].
![]()
![]()
![]()
![]()
![]()
