Are Land Values on the Rebound?
August 1, 1981
PAER-1981-1
Author: Craig L. Dobbins, Agricultural Economics
![]()
![]()
![]()
![]()
![]()
Note: The charts in this article were taken from physical copy scans – as the original documents no longer exist. These versions are very blurry – we apologize in advance for the quality.
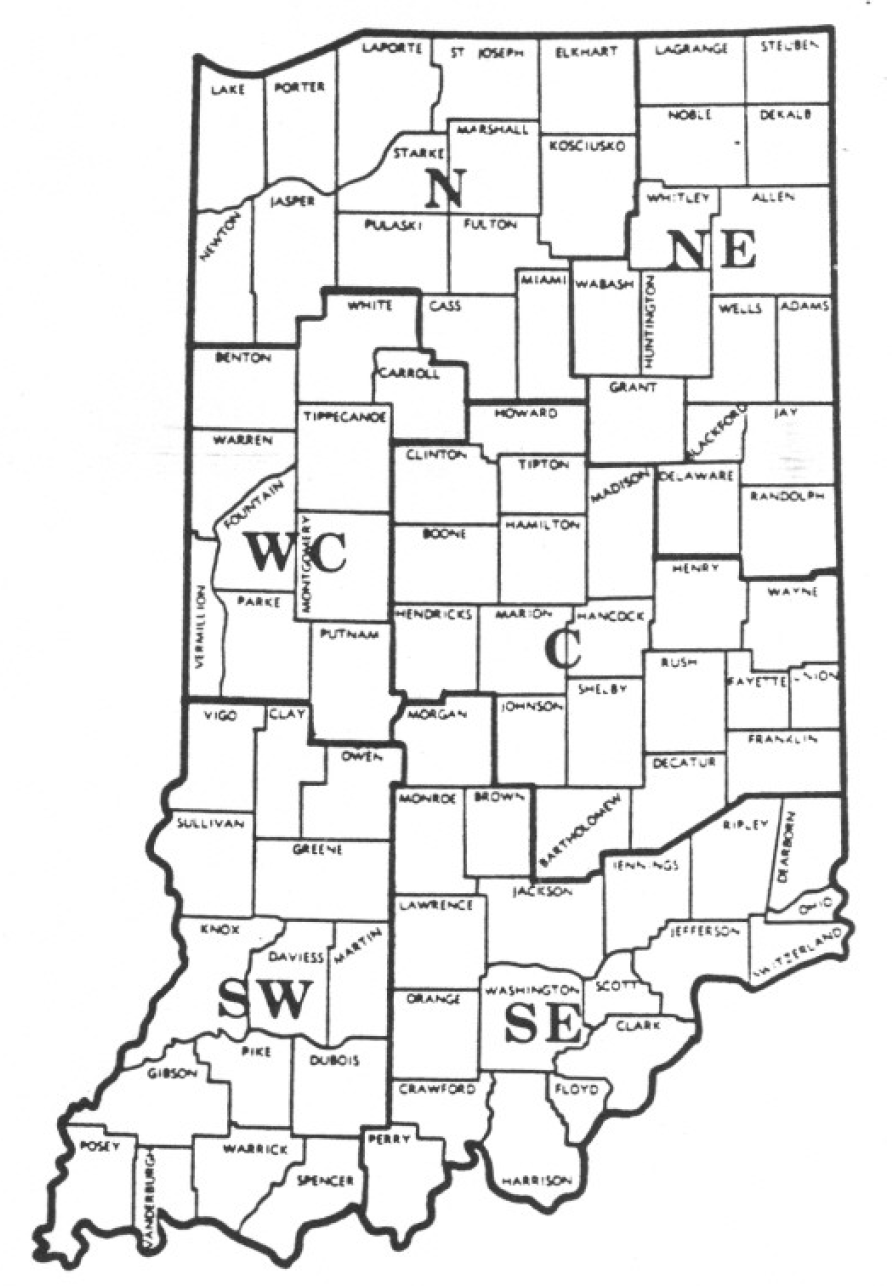
Figure I. Geographic areas used in the 1981 land value survey, Purdue University, July 1981.
If someone were needing data to support the idea that farming is a risky business, the events of the past year would provide just that. The: drought of 1980 was replaced by the floods or 1981. Interest rates have gone up and down like a yo-yo. Grain prices have improved since last summer, but many farmers have reduced yields. and costs have again increased in 1981. Hog prices, after being below production costs for almost 2 years, have improved but are still nothing to shout about. Thus, it comes as no surprise that the results of the Purdue Land Values Survey indicate only a 1.0% state-wide increase in the value of average bare land between December 1980 and June 1981. Perhaps the surprise is that there has not been a decline.
The 1981 Land Values Survey was made possible by the cooperation of 195 persons who are knowledgeable about land values and cash rents – operating and professional farm managers, appraisers, realtors, and agricultural lenders representing banks, PCA ‘s, the Federal Land Bank, FmHA and insurance companies. They reported on nearly all counties in Indiana, giving their estimates of cash rent and market value for top, average, and poor tillable bare land. They also estimated the corn yield which they were expecting over the next several years for each class of land. In addition to farmland, the value of transition land – land moving into nonfarm use such as factory locations. housing and shopping centers – was also estimated.
The state was divided into six areas (Figure I) based roughly on general soil associations. Within any area, land values in a specific county may vary considerably from the area average. Thus, in using estimates from the survey (especially dollar figures per acre) potential buyers and sellers should remember that nothing substitutes for good judgment and knowledge of one’s own local land market. The report figures are useful guidelines, but the value of a specific farm must still be adjusted for buildings, nontillable land, fertility, drainage, location, etc.
One of the purposes of the survey is to obtain information on the movements of land prices during the period from December to June. While the average state-wide value of land increased slightly, there were several regional differences in land value movements (Table 1). The southeast region exhibited the greatest relative strength in the land market. For several years, land values in this area have been stronger than in most other areas. The southwest region had also been a region in which land values have been strong. However, with the exception of average land, the relative strength of the land market in the southwest region seems to have declined.
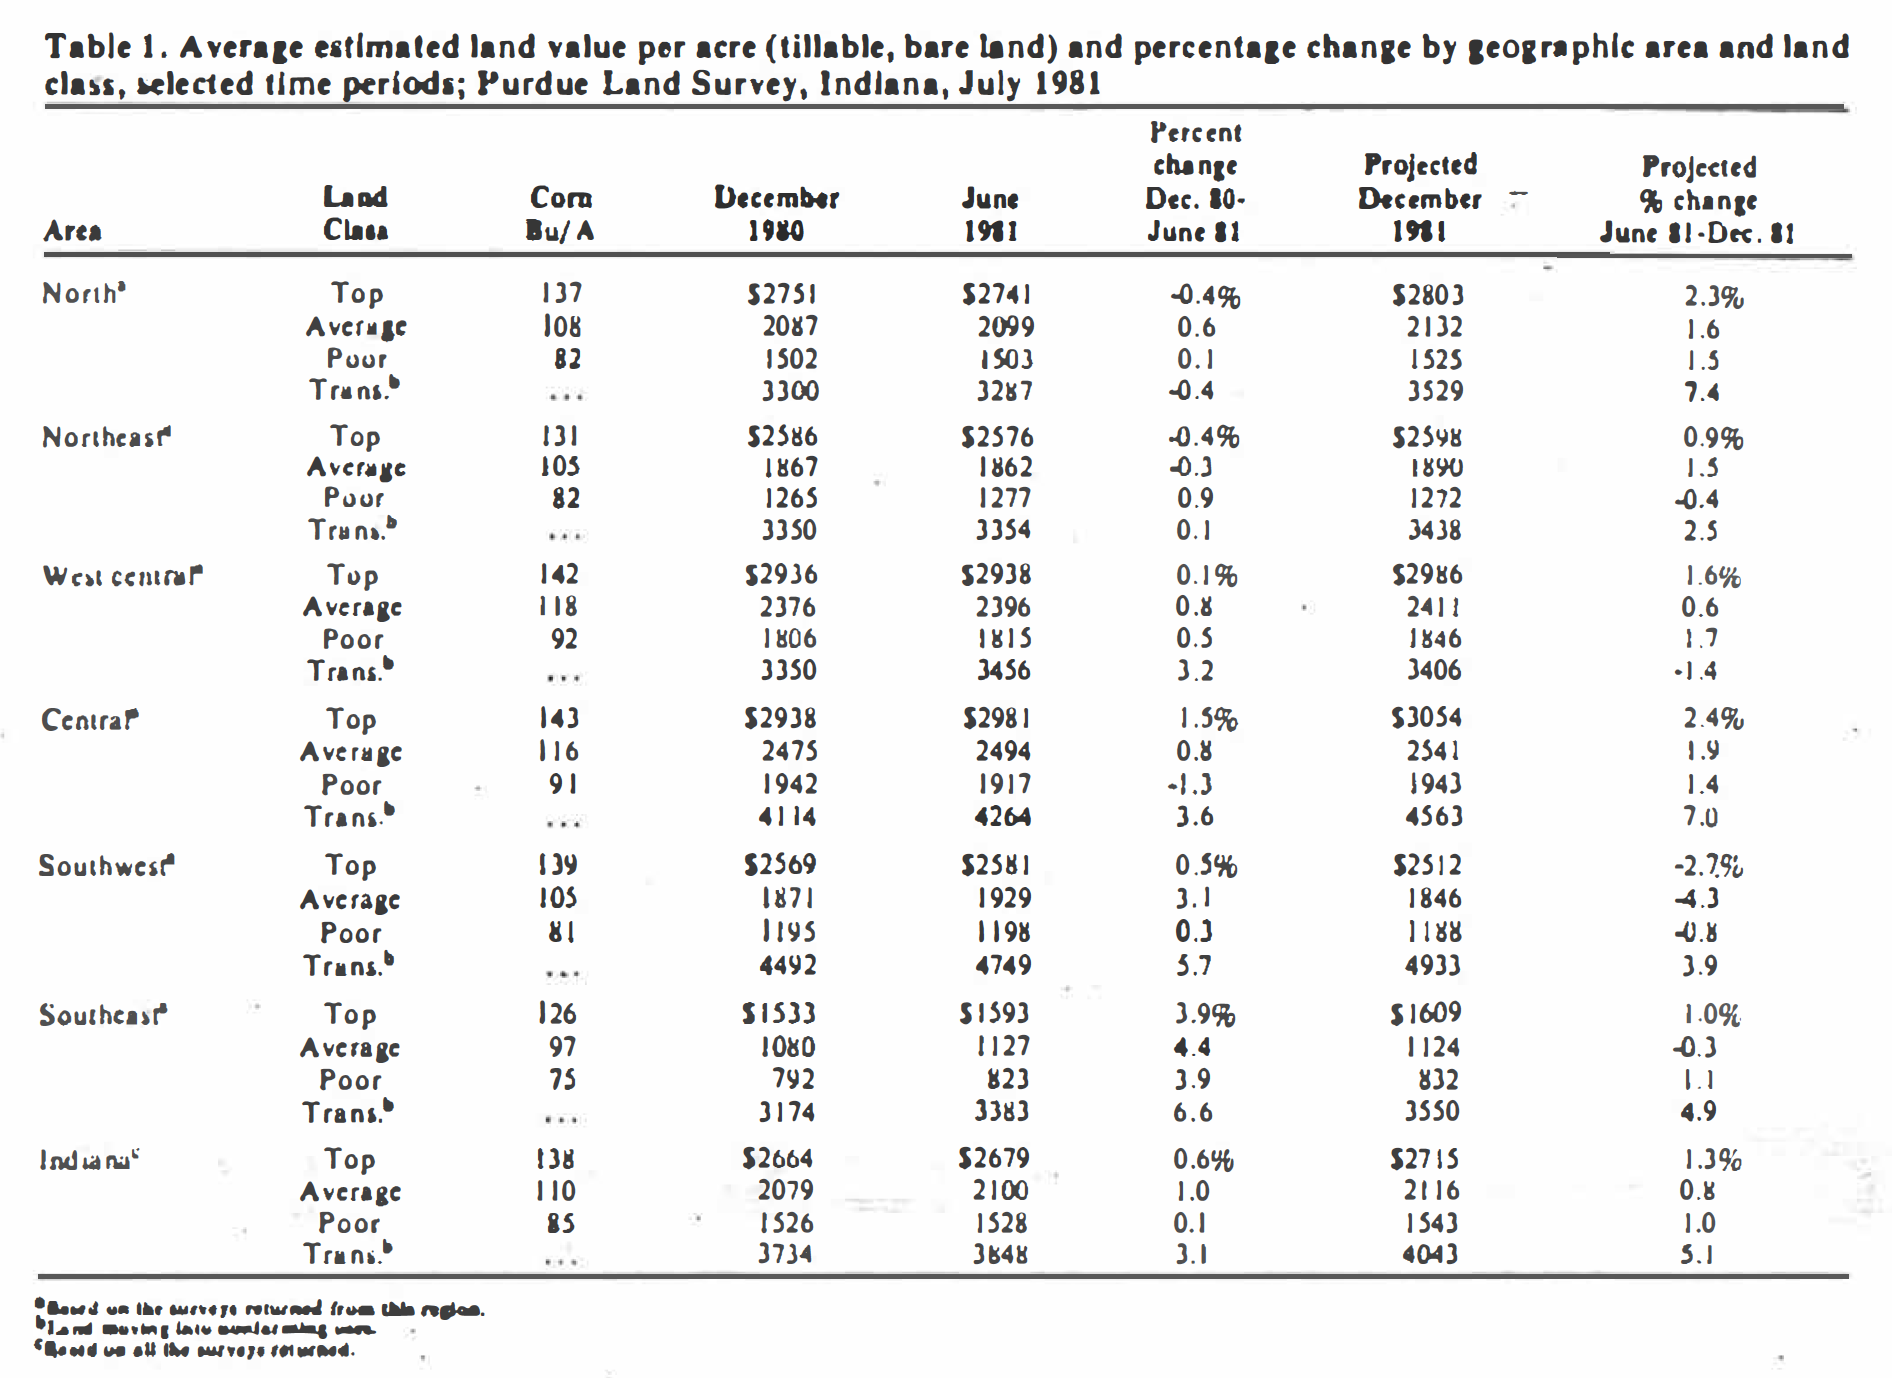
Table 1. Average estimated land value per acre (tillable, bare land) and percentage change by geographic area and land class, selected time periods; Purdue Land Survey, Indiana, July 1981
Land prices reported for the central region indicate that top and average land moved higher while poor land declined. Poor land increased in the west central region; however, the price of top land remained stable. For the northern two regions, there was little change in land values from December to June.
The movement in the price of transitional land, that moving into nonagricultural uses, is much more clear. In all regions except the north, the movement was upward. The greatest strength was in the southeast region, increasing 6.6 percent. State-wide the value of this land increased an average of 3.1 percent from December to June.
As in 1980, the highest priced land was again in the central region – $2,981 per acre for land with estimated corn yield of 143 bushels. The west central region had the second highest land values.
State-wide, farm land values in June of 1981 were about 10.0 percent higher than they were in June of 1980; average land increased the most, 11.2 percent from June 1980 to June 1981. Top land was 9.7 percent higher than a year ago, while poor land was up 9.1 percent. All three classes of land were up from a year ago in all regions except the Southeast (Table 2). In many cases, land values had increased enough to place them above the levels of December 1979 (a high point prior to the decline in land values). The major exception to this movement was in the southeast region. While land values show the greatest strength during the December 1980 to June 1981 period, land values reported for June 1981 had not yet reached the level reported the previous year.
In general, the rebound in land values occurred primarily during June and December 1980. Since that time, land values have remained relatively stable when compared to recent changes.
Land Value Per Unit of Production
A helpful “thumb rule” in comparing different qualities of crop land is the land value per bushel of average corn yield, or value per acre divided by estimated yield. Management quality will affect actual yield, so yield estimates should be based on typical management practices when using this “thumb rule.” After a decline in 1980, these values increased in 1981.
Land values per bushel of estimated yield were the highest in the central region (Table 3) for all land classes.
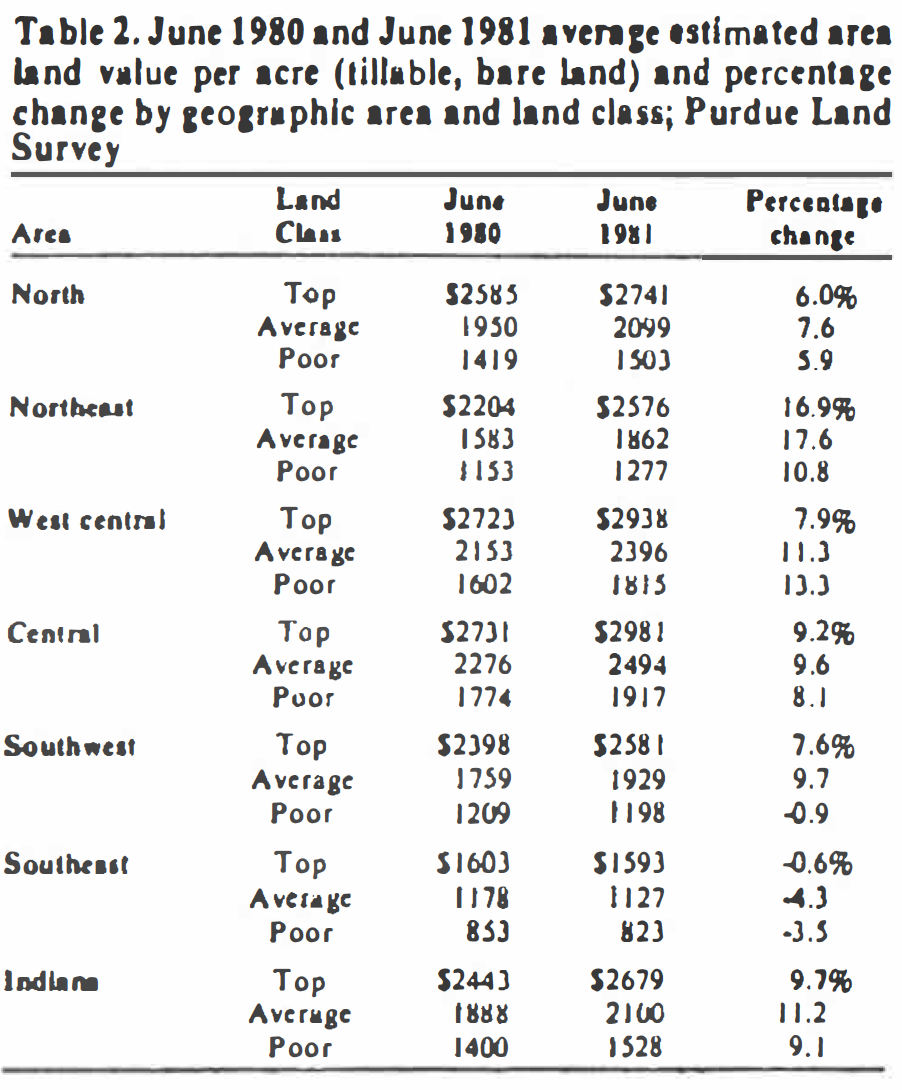
Table 2. June 1980 and June 1981 average estimated area land value per acre (tillable, bare land) and percentage change by geographic area and land class, Purdue Land Survey
The cost per bushel of yield across the regions varied the least for the top Iand, ranging from $20.84 per bushel for the central region to $12.64 per bushel for the southeast (a difference of $8.20 per bushel). The cost of top land for the north, northeast, west central and central were all within $1.18 per bushel of each other. The range across the regions in cost of poor land was slightly larger than for average land, differing by $10.09 per bushel for poor land compared to $9.88 per bushel for average land.
The highest per bushel figure, $21.50 was for average, not top land in the central area. This was the same relative relationship reported in 1980. In all other areas. land value per bushel declined as land quality varied from top to poor.
The decline in land value along with a decline in yield is reasonable since some costs such as machinery and labor do not generally change in proportion to yield when moving from one class of land to another. Thus. with top land in the central area valued at $20.84 per bushel and average land at $21.50. the top land is a better buy. It is not clear which quality land is the better buy where the market value per bushel is higher on the better land. In these cases. a careful analysis is needed to detect which land is the better buy. 1
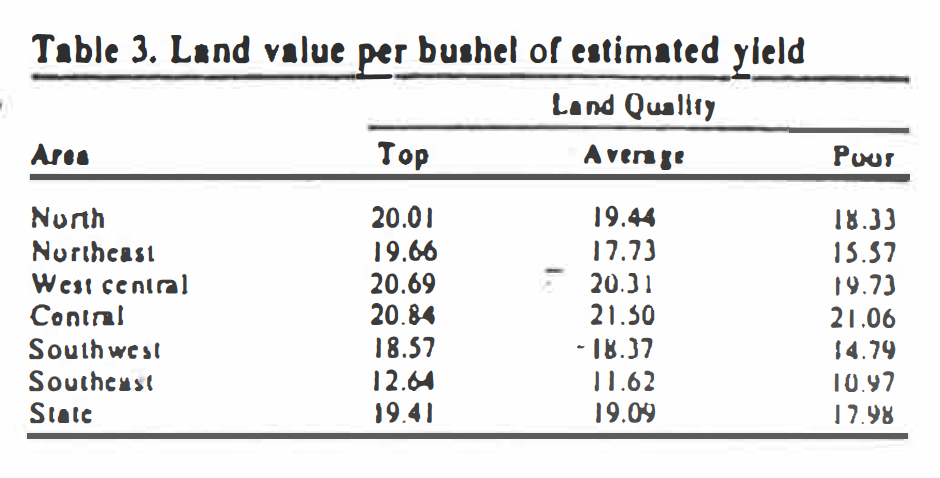
Table 3. Land value per bushel of estimated yield
Cash Rents
Per acre cash rents for bare land were up 9.3 percent from 1980 levels for average land on a state-wide basis (Table 4). The increase in cash rent on a state-wide basis or top land was 11.4 percent. while the increase for poor land was 8.3 percent. Cash rents for all land classes declined in the southeast region and for poor land in the southwest region. The cash rent in other regions all showed an increase from 1980 levels. The largest increase in cash rents occurred in the northeast region.
Cash rents per bushel of estimated yield were above S1.00 per bushel in the major grain producing areas- the central and west central regions. Rents for the top land in the north and northeast were S1.02 to $1.01 respectively, per bushel of expected yield. Rents for top and average land in the two southern regions ranged from S0.70 to S0.78 per bushel.
As with the purchase of farm land, the profitability of renting needs to be assessed carefully. A higher rent per bushel can logically be paid for higher yielding land since fixed costs can be spread over more bushels. But, a reasonable rent will depend upon the individual situation and can only be determined with careful analysis. 2
Cash rent as a percentage of June land value tended to be higher than last year in all regions except the southwest and southeast. Cash rent as a percentage of land value was very similar for the different land classes. And, from region to region there was little change in this relationship, averaging 5.1 percent for each land class.
Farm operators wanting to expand the size of their crop enterprise, but who are short of capital should consider the fact that in many cues they ran cash rent more than 2.5 acres for the interest cost of buying one acre.
Outlook
While data of past movements in land values and cash rents are interesting to look at and discuss, a more important determinant in the land market is the expected future values of various economic factors. Survey respondents expect:
- Slight increase in land values by December 1981 (Table 1).
- A 24.8% increase in land values over the next 5 years, or about a 4.5% annual compound rate, slightly less than last year’s 5-year estimate of 27% (1 4.9% annual compound rate).
- A 5-year average on-farm price of $3.75 per bushel for corn and $8.34 per bushel for beans. Last year their 5-year estimates for corn and beans were $3.01 and $7.15, respectively.
As has been the case in several years, the remainder of the growing season again is critical in assessing the shortterm outlook for Indiana farmers. At this time (midAugust}, crops in many areas of Indiana are several days behind their normal stage of growth, with concern about an early frost. Crop conditions in other areas of the Corn Belt have been more favorable, dampening the prospects for substantially improved crop prices. As a result, the short-term profit prospects do not provide much strength to Indiana’s land market. Over much of the state, land values are expected to remain stable or even decline in the short-term.
Over the longer-run, world demand for farm products is increasing, new markets may open up for U.S. products. The battle against inflation continues to be waged but will not be easily won and the “inflationary hedge” part of the demand for land will continue. However, if interest rates remain high, the cash flows will continue to make a land purchase difficult for many.
Careful analysis is called for whether buying or selling land. If the cash flow requirements can be handled and additional land appears to have a reasonable profit potential, then a land purchase makes sense.
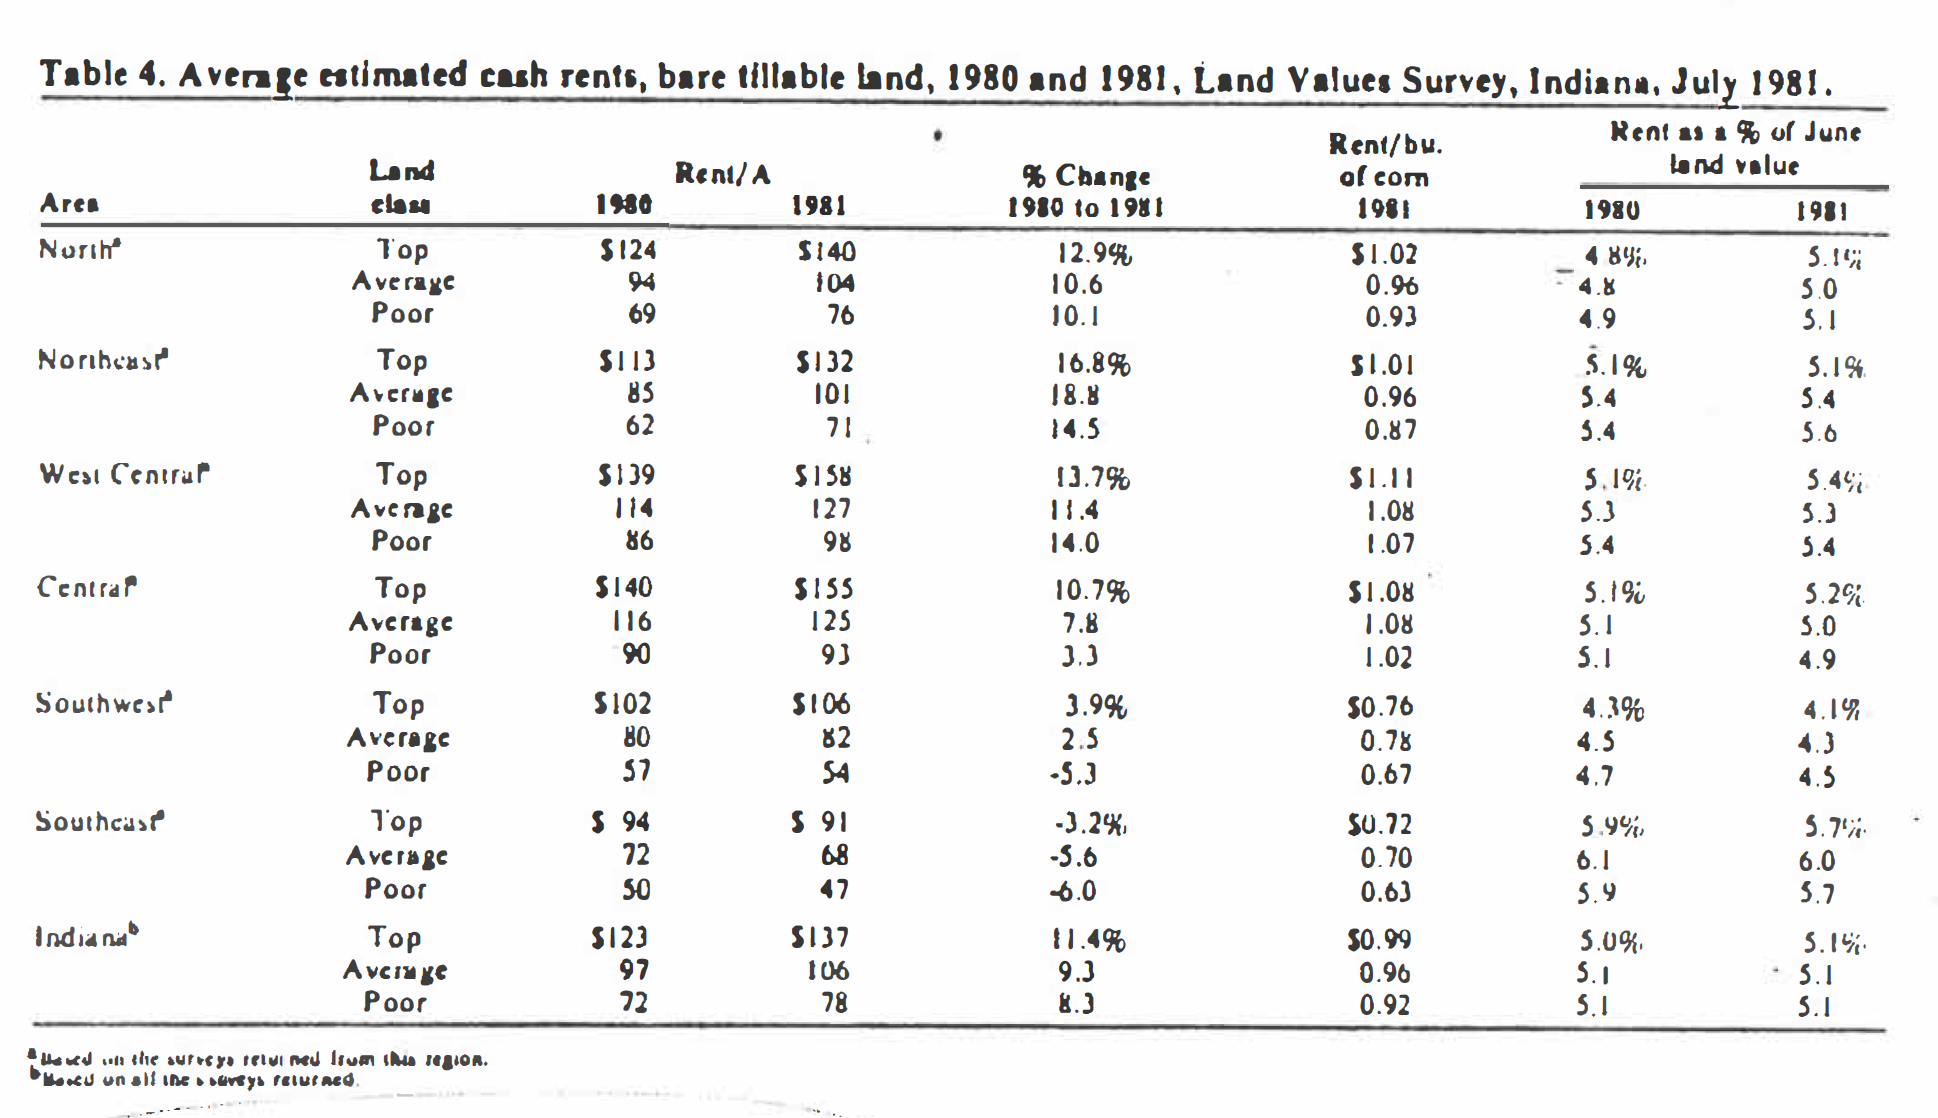
Table 4: Average estimated cash rents, bare tillable land, 1980 and 1981, Land Values Survey, Indiana, July 1981
1 For help in analyzing land purchases ask your Indiana County Extension Agent about the “Maximum Bid Price for Land,” a FACTS computer program.
2 Farm operators may also want to compare cash rent leases with other leases. Ask your Indiana County Extension Agent about “Cropland Lease Comparison,” a FACTS computer program designed to aid such comparisons.
![]()
![]()
![]()
![]()
![]()
