Beginning to Evaluate Choices in the Farm Bill
April 13, 2014
PAER-2014-2
Roman Keeney, Associate Professor
![]()
![]()
![]()
![]()
![]()
The 2014 Agricultural Act was signed into law on February 7, 2014. Farmers will need to make an important set of decisions about which program alternatives they will elect. Many of the specific program details and rules still need to be determined by the United States Department of Agriculture. The sign-up period will probably be in the fall, so farmers should have plenty of time to learn about the program and to evaluate their choices. Those choices will be locked in place throughout the full five year bill which covers the 2014 to 2018 crops.
The way in which farmers may receive payments for commodity programs has changed. Direct, countercyclical, and ACRE payments are gone and are replaced with three program alternatives that farmers will choose among:
- Price Loss Coverage (PLC): Is a price protection program that triggers payments when market year average prices fall below target levels now called “reference prices”
- Agricultural Risk Coverage County (ARC-C): Is a revenue protection program that triggers payments when the county revenue per acre falls below a benchmark revenue guarantee per acre set for the county
- Agricultural Risk Coverage Individual (ARC-I): Is a revenue protection program that triggers payments when there is a revenue per acre shortfall on the individual farm that falls below a benchmark revenue guarantee per acre for that farm
- There are some additional points that need to be considered as well: Famers electing PLC or ARC-C can enroll a farm commodity-by-commodity. This means a farmer could enroll corn in ARC-C and soybeans in PLC as an example. If the ARC-I is chosen, then all base acres of crops on that farm must be in ARC-I.
- Base acreage can be reallocated to be in the same proportion as the actual planted crops during 2009 to 2012. This will be an elective as each farm can stay with the current base, or reallocate
- Those electing PLC can update their FSA yield base to 90% of that farm’s yields from 2008 through 2012. It is likely that most electing PLC will also want to update their yields
- Those electing PLC will also be eligible for some additional crop insurance coverage known as Supplemental Coverage Option (SCO), but not starting until the 2015 crop
The calculation of PLC and both types of ARC payments will be familiar to farmers who have participated in the counter-cyclical payment (CCP) and average crop revenue election (ACRE) programs. PLC is a price protection program that makes payments when the U.S. average farm price falls below set references prices. ARC, on the other hand is a revenue protection program that uses five year Olympic moving average prices and yields to calculate benchmark revenues per acre. Table 1 outlines some of the differences in the program features.
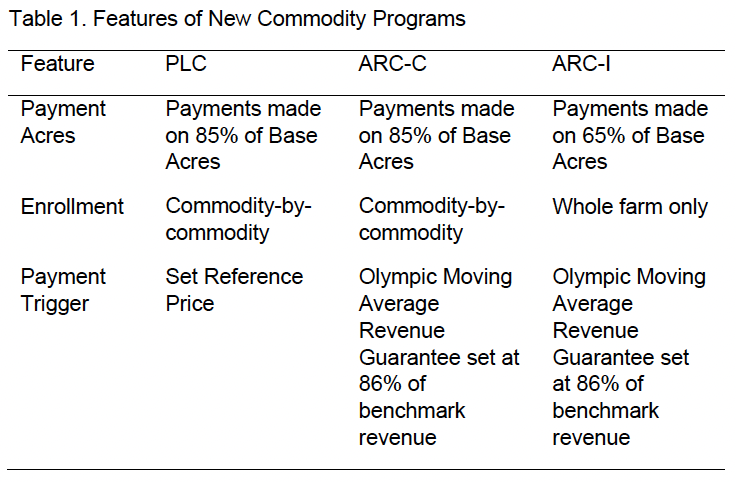
Table 1. Features of New Commodity Programs
How to Calculate PLC Payments
Farmers are anxious to do calculations for their farms. What are the payment calculations? What data will they need? How can they compare the results of different programs? Those questions will be answered keeping in mind that the exact calculations and details will not be confirmed until USDA releases final rules later this year.
The most notable adjustment in the PLC program relative to its predecessor CCP is the across the board increase in reference prices to better reflect the market prices for commodities and input costs that have emerged in more recent years. Both corn and soybean reference prices are some 40% higher than the former CCP target prices, with a corn reference price of $3.70 per bushel (formerly $2.63 in CCP) and a soybean reference price of $8.40 per bushel (formerly $6.00 in CCP). Wheat, represents one of the smallest increases over the most recent CCP rate increasing from $4.17 to $5.50, up 31%.
Our example calculation of a PLC payment uses corn as the crop and a set of assumptions designed to illustrate differences in the PLC and ARC programs. The PLC program represents an updated version of the counter-cyclical program that has been available to farmers for the past twelve years. The PLC calculation uses the historic FSA acreage base for the farm and the historic FSA yield base for that farm. The reference price for corn is $3.70 per bushel. If the national market year average price received for corn drops below $3.70 for any crop year, then a PLC payment will be made. The steps for calculating a payment are shown in Table 2 and assumes a national market year average price of $3.50; assumes the farmer updated payment yields to 90% of the 2008-2012 actual proven yield which is 162 bushels per acre; and the farm has a 100 acre FSA corn base.
The first step is to compare the national market year average price to the reference price to determine whether the crop is eligible for payments in that year. If the national market year average price is lower, the payment rate per bushel is equal to the difference and is then paid on 85% of the farms base acres using the FSA base yield for the farm.
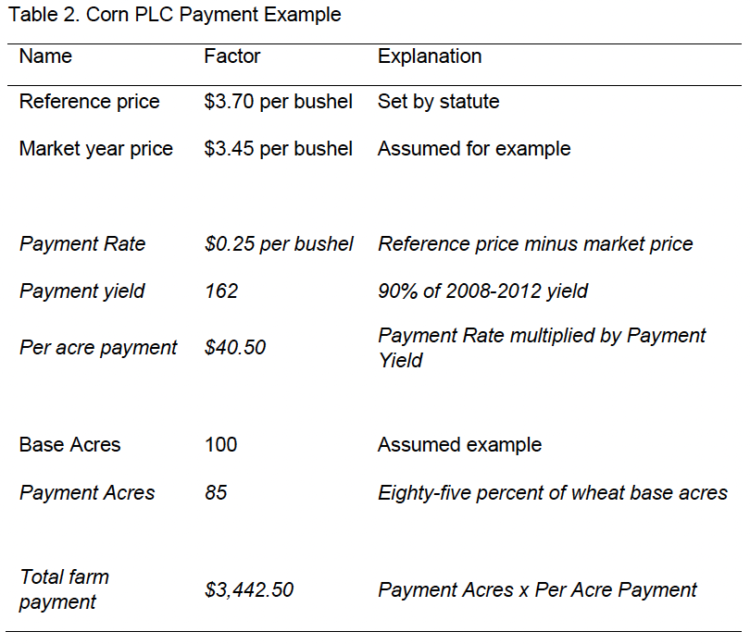
Table 2. Corn PLC Payment Example
Calculating ARC-C Payments
The ARC program results from a more complex calculation similar to the former ACRE program that was heavily criticized for its lack of transparency. The main criticisms of the ACRE program was the double trigger requirement where both the state, and the individual farm, had to experience a revenue shortfall. That has shifted to a single trigger either at the county level for ARC-C or the farm level for ARC-I.
The first step in the ARC-County calculation is to calculate the benchmark revenue per acre for each crop as shown for corn in Table 3. The most recent five years prices and yields are shown. The Olympic average means that the high and low years are eliminated (as shown by the strikethroughs) and the remaining three are averaged. The benchmark revenue per acre is calculated as the Olympic price times the county Olympic yield. In this example $5.30 * 171 = $906.30 per acre is the benchmark revenue.
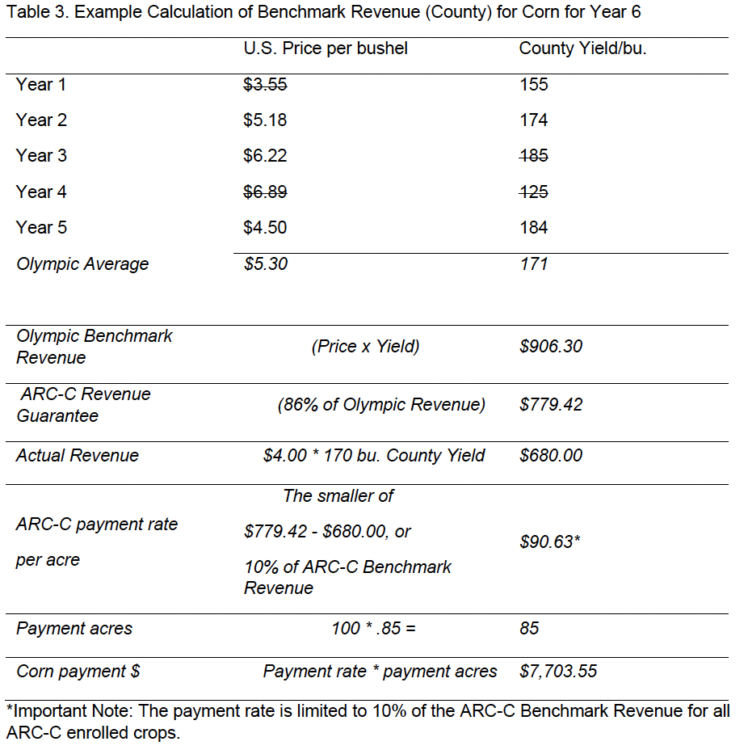
Table 3. Example Calculation of Benchmark Revenue (County) for Corn for Year 6
The new farm bill begins protection at 86%. Thus the revenue guarantee per acre is 86% of the benchmark or .86 * $906.30 = $779.42 per acre. An ARC-C payment is triggered when the actual revenue for that crop year drops below the revenue guarantee per acre. What would the actual revenue per acre be if the U.S. average price was $4.00 and the county yield was 170 bushels per acre? The actual revenue would be $4.00 * 170 = $680.00 per acre.
The ARC-C payment rate would be $779.42 – $680 = $99.42 per acre—However, the payment rate is limited to 10% of the county benchmark guarantee. In this case, 10% of $906.30 is
$90.63 per acre. The payment rate is made on 85% of the 100 FSA base acres in this example which is on 85 acres. The farm would receive corn payments of $90.63 per acre * 85 acres = $7,703.55.
Calculations for the ARC-Individual program is somewhat more complicated and requires the farm to go into ARC-I on all crops. That explanation will be covered in a later article.
How should farmers approach analyzing this complex program? The first step is to evaluate potential payments in the two basic alternatives of PLC and ARC-C shown here. Then, ARC-I calculations can be done for the whole farm and compared to see if the increased payments from using the farm’s individual information is enough to offset the additional 20% of acres that become ineligible for payments.
Comparing the Safety Nets in PLC versus ARC-C
After farmers learn more about these programs they will begin to evaluate the advantages and disadvantages of each using data from their own farms.
Given recent years of high prices that are used in the ARC payment calculations, it is likely that ARC payments will begin at higher price levels than the relatively low reference price for corn, soybeans and wheat (at least for the next few years). Farmers will likely see this as an advantage for ARC. One of the disadvantages for ARC is that per acre payments are limited to 10% of the benchmark revenue per acre. This means that as prices fall, the maximum payments are reached and then ARC provides no more protection with further price declines. On the other hand, PLC payments continue to grow until prices move down to the very low loan levels.
These relationships are shown in Figure 2 for the corn PLC and ARC-C examples used here. The lines combine the market price for corn and the government payment additions to revenue under each program to calculate an “effective” price received (dividing payment receipts by actual yield). In the PLC program a U.S. corn price of $3.45 would translate to an effective price of $3.64 per bushel. The ARC effective price would be $3.85. This result will tend to hold for as long as the 5 year Olympic prices are well above the references prices as is the case now due to high prices seen over the past five years. Five year Olympic average prices for corn and soybeans are some 40% higher than the PLC reference price and with wheat showing a nearly 20% increase over the PLC reference price.
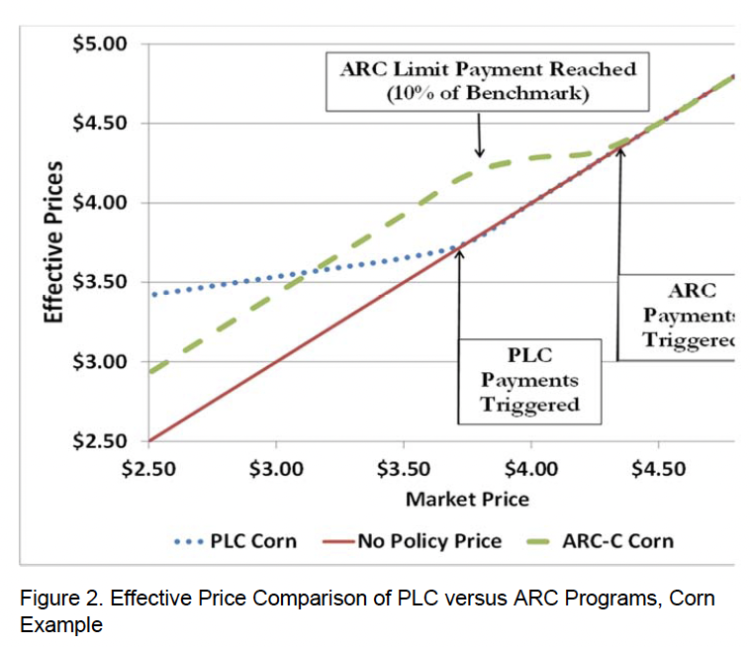
Figure 2. Effective Price Comparison of PLC versus ARC Programs, Corn Example
ARC payments hit the 10% limit when actual revenues fall below 76% of the benchmark and no more ARC payments are made. This point is marked on the graphic. If prices continue to fall, then PLC can become the superior program at low enough prices. Figure 2 compares the PLC and ARC program over an extended range of market prices showing the effective market price when accounting for payment revenues. This graph is offered as an example of the pattern of protection that exists in comparing the PLC and ARC-C for a single commodity. The gap that exists and length of price space over which ARC-C has larger payments than PLC will depend on specific county or individual farm yield information that sets the target revenue.
These evaluations point out that another factor that will be important in making the program decision will be the individual farmer’s five year price outlook. The more optimistic they are about the price of a crop, the more likely they are to favor ARC. If a farmer believes low, or very low prices could occur, they may look more favorably toward PLC.
Producers will also need to think about their own financial ability to withstand low revenues that could result from low, or extremely low prices. In addition they will want to consider how their government program choice intersects with their crop insurance program to help them manage financial risk.
Enrollment Decisions
Farmers will be faced with a complex set of decisions that begins with comparison of the PLC and ARC County program on a crop-by-crop basis. Both of these programs allow for enrollment on a commodity basis so that for any FSA farm, the operator may make use of both the PLC and ARC county program for different crops. Then, they will need to compare those outcomes on a commodity-by-commodity basis to the whole farm choice that exists in the ARC Individual program which uses individual farm yields. Benchmarks and actual revenues in ARC-I use a different calculation than the county ARC and is based on a weighted crop revenue per acre for all crops on that farm. In addition the ARC-I program only pays on 65% of the farm base acres rather than 85% in ARC-C. Farmers who do not elect a program option in 2014 will automatically have all base acreage enrolled in the PLC program by default and have no eligibility for payments on 2014 crops.
Farmers will also need to examine whether to stay with their historic acreage bases or reallocate their acres to a more recent time period. Once a farm is enrolled in a program it is locked into that choice for the life of the farm bill through the 2018 crop. Those who chose PLC have an additional consideration to purchase Supplemental Coverage Option (SCO) which is a shallow loss insurance program with premiums subsidized at a 65% rate. This SCO offering is not available until the 2015 crop and is only offered for crops enrolled in PLC. The effect of the SCO will be to limit the difference in payout between the ARC-C and PLC for the range of prices where ARC-C generates higher payments.
Farmers will also need to consider a host of other factors in their decision including their outlook for prices over the next five years, and how their government program choice integrates with their crop insurance program and how these programs combine to provide a financial safety net.
Recent indications are that USDA will not be prepared to accept enrollments until at least September of 2014. This means that farmers will be able to make their decision with considerable information already in-hand about the status of the 2014 crop and will have ample time this summer to study the alternatives and implications. Decision tools will likely emerge from USDA and Land Grant Universities. Farmers will also want to pay close attention to official updates from USDA-FSA about establishing yields in the program, making update decisions and declarations on yields and bases, as well as information regarding the signup period.
Marketing Year Prices:
The U.S. marketing year average price will be one of the factors determining the revenue guarantees under the ARC program choices in the new farm bill. The marketing year for corn and soybeans is from September 1 through August 30 of the following year. Here are those prices for the last 10 years. Keep in mind that 2013/14 are preliminary at this point.
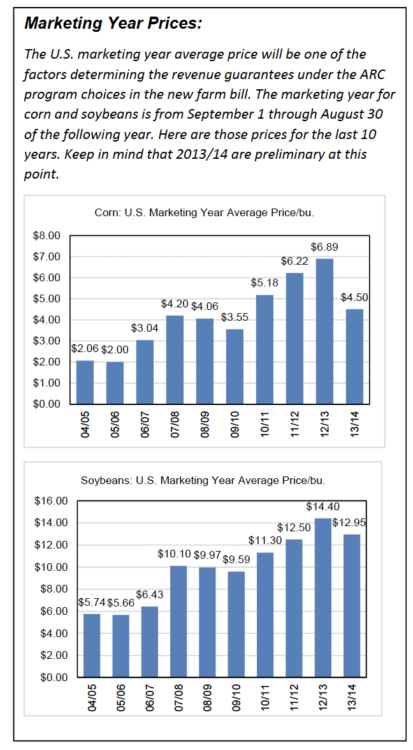
Figure 3 and 4: Corn and Soybeans: U.S. Marketing Year Average Price/bu.
Note: The information presented here is the best available at this time. USDA-FSA is still working on the final rulings, then they must decide on the exact data to be used for each farm, and also develop the calculations for the way payments will be made. We have used our “best judgment” of the way the program will work, and therefore could have some inaccuracies relative to the final. Decision makers will need to review evaluations of their farms after USDA sets the final guidelines.
![]()
![]()
![]()
![]()
![]()