Can I Repay? Managing Farm Debt Repayment Capacity
July 13, 2000
PAER-2000-07
![]()
![]()
![]()
![]()
![]()
Low prices have some farmers wondering whether they will be able to meet their needs for cash for family living and taxes, debt repayment, and reinvestment. Repayment problems can happen to the best of farmers, because they aren’t always the result of a lack of profitability. Lenders are increasingly asking their farm customers for documentation of repayment or debt servicing capacity. The need to be able to measure and manage repayment capacity seems clear.
However, an alternative available to farmers is to rely on their lenders’ expertise to make them aware of repayment capacity problems and to help them solve such problems. Obviously, most lenders are very knowledgeable about measuring repayment capacity, know what kinds of documentation they prefer, and have their own strategies for working out repayment capacity problems (see accompanying text box). We do not recommend this approach. Depending solely on your lender to monitor your repayment capacity may result in less timeliness in anticipating repayment problems, less flexibility in making adjustments, and less predictable results.
It isn’t that the documentation required by the lender won’t benefit the farmer, because it can. But the farmer has a variety of tools and techniques available for managing repayment capacity that go beyond the budgeting and financial performance measures that are typically at the heart of the loan documentation process. These alternatives, which we will call “operational strategies,” can give the farmer greater control, be more reliable, facilitate more timely management intervention, and be easier to use. Also, budgeting and financial measures are far more powerful management tools when they are used as part of the day-to-day decision making on the farm than when they are used solely for loan documentation.
Working with Farm Lenders to Document Repayment Capacity
The key issue in repayment capacity analysis for the farm lender is to obtain the best evidence that sufficient cash will be available to make scheduled principal and interest payments. The lender may use one or more of several different measures/tools for documenting repayment capacity. These may include particular measures of financial position and performance or actual and projected financial statements. Increasingly, lenders will include cash flow budgets or projections in their requests for loan documentation. Lenders are interested in both actual repayment capacity, that is, the ability to repay during the current or just completed year, and future repayment capacity. Lenders recognize the predictive value of past performance, but they know that past performance doesn’t necessarily guarantee future repayment capacity. Things change. As a result, estimates of future income, expenses, and other cash flows are often a key element of repayment capacity documentation.
Farmers and lenders alike must be very conscious of uncertainty about the future when assessing estimated future repayment capacity. Because of this uncertainty, a range of possible outcomes may be more useful than a single (point) estimate of future repayment capacity. Uncertainty about the future and estimated future performance increases the value of communication between lender and farmer. Assumptions about key determinants of receipts, expenditures, and other cash flows should be discussed in detail with your lender. The potential impact of these assumptions on the likely variability of results should be explicitly considered in this communication process. Because of uncertainty, lenders will want to see a margin where the repayment capacity projected for next year exceeds the amount actually needed to repay scheduled debts. This excess repayment capacity provides an important buffer against the risks associated with farming.
Operational Strategies for Managing Repayment Capacity
The basic premise of operational strategies for managing repayment capacity is to set limits on either the amount of funds borrowed or on the operating decisions of the business. In essence, these limits are intended to guarantee that adequate cash is available to repay the debt obligations. These strategies can take many forms. The following are a few examples.
- Buy crop insurance and forward contract or hedge product prices, so as to reduce the chances of a cash flow shortage from low yields or poor prices.
- Maintain cash reserves equal to a specified percentage of existing debt obligations. This is a strategy of maintaining a reserve that can be dipped into to make payments if current operations come up short.
- Maintain a debt repayment mar-gin by only borrowing a specified percentage of the purchase price of capital items. With this strategy, a larger proportion of capital expenditures is financed with past earnings, thereby reducing the demands placed on future earning.
- Borrow the purchase price of feeder livestock only if adequate feed inventories are available, rather than borrowing for both livestock and feed purchases.
- Assign the milk check, a procedure whereby a percentage of all proceeds are allocated by the processor or coop to make payments on a debt. This is a strategy that controls spending by ensuring that milk proceeds are used to make payments on existing obligations before you have any opportunity to use the proceeds for discretionary spending.
- Forecast revenues for the upcoming year, and then establish a spending limit for each of the major types of operating expenses that is well below expected revenues.
Again, the objective of these operational strategies is to create operating procedures that increase the likelihood that cash will be available to make the loan payments.
Repayment Capacity Ratios and Measures
Worksheet 1 provides guidance for computing five of the financial measures and ratios commonly used to assess and document repayment capacity. These are the current ratio, working capital, the term debt cover-age ratio, term debt repayment capacity, and term debt repayment margin. Technically, the current ratio and working capital are not measures of repayment capacity, but instead are measures of liquidity (the ability to meet financial obligations as they come due). These liquidity measures are included here because of their widespread usage as indicators of short-term repayment capacity. All of these measures can be figured after the fact using actual performance data from farm financial statements. They can also be computed using forecasted financial statements for upcoming operating periods. These measures should always be based on accrual-adjusted financial information.
The current ratio indicates the dollars of current assets that are available on the balance sheet date for every dollar of current liabilities on that date. The current ratio is indicative of the farm’s ability to pay current obligations, and thus it is generally classified as a measure of current liquidity. Working capital is determined as the absolute dollar amount by which current assets exceed current liabilities. It reflects the margin or cushion in short-term capacity to meet current obligations as they come due.
The current ratio and working capital measures are stock concepts. That is, they take stock of the cur-rent assets and liabilities on the balance sheet date. As a result, their usefulness as indicators of repayment capacity is limited to the very near term. The money that must flow out of the business during a year in order to meet obligations may far exceed the working capital on the beginning balance sheet date.
More direct and explicit measures of repayment capacity (see accompanying text box for definition) include the term debt coverage ratio, term debt repayment capacity, and term debt repayment margin. The term debt coverage ratio indicates the accrual-adjusted net income (not cash flow) from the farm business that is available annually for scheduled principal and interest payments on term debt. Term debt repayment capacity is an absolute measure of the dollar amount of income avail-able for servicing term debt. The term debt repayment margin measures how much of the term debt repayment capacity remains after the scheduled principal and interest payments have been made.
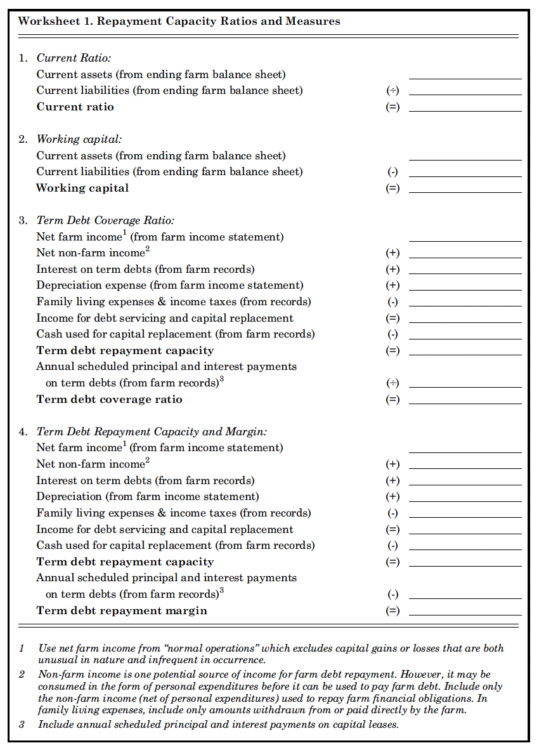
Worksheet 1. Repayment Capacity Ratios and Measures
Unlike liquidity measures, repayment capacity measures take into account both the stock of working capital and the expected flows of money that will go in and out of the business during the year subsequent to the balance sheet date. The revenue and expense flows used when computing repayment capacity measures should be measured on an accrual-adjusted basis. That is, they should reflect changes in current assets, such as inventories, and current liabilities, such as accrued rent or interest. Their use-fulness is thus increased by connecting the flow of funds during the year to the stock of working capital on hand on the balance sheet dates. For that reason, repayment capacity measures provide invaluable information about whether or not a farm is, or is expected to be, profitable enough to meet its financial obligations over the course of an accounting period.
A term debt coverage ratio greater than one indicates that there is more net income being generated than is required for term debt repayment. The larger the ratio, the greater the ability of the farm to weather an income decline. A ratio less than one indicates a lack of repayment capacity. Similar information is provided by the term debt repayment margin. Using this measure, positive values indicate sufficient income for repayment, and negative values indicate repayment difficulties.
Computing Repayment Capacity –An Example
It may be helpful to illustrate repayment capacity computations with an example involving the term debt coverage ratio. The starting point in this computation is accrual-adjusted net farm income. If your accounting system can not generate an accurate accrual-adjusted measure of net farm income, obtain a copy of Purdue University Cooperative Extension Service publication EC-712, “Measuring & Analyzing Farm Financial Performance.” It contains worksheets that facilitate computing accrual-adjusted net farm income from cash record information.
In our example, B&B Farms has determined that actual accrual-adjusted net farm income in 1999 was $29,000. Bob and Ben estimate that their net farm income will increase to $43,000 in 2000. They have separate personal accounts, and they don’t rely on non-farm income sources to pay farm financial obligations directly, even though they have non-farm income. Each of the two partners in the farm operation withdraws $35,000 per year from the farm. Their total family living expenditures including taxes were $39,000 and $36,000, respectively, in 1999, but these amounts can be ignored because only$35,000 per partner represents a financial obligation of the farm operation. Farm interest expense in 1999 was $40,000 and is estimated at approximately $42,000 for 2000. Depreciation expense was $30,000 in 1999 and will increase to $42,000 in 2000 based on planned capital purchases. B&B Farms has a small balance of $15,000 on their 1999 operating loan that the farm was unable to repay and that they plan to roll over into their 2000 operating loan. Scheduled principal payments on term debts in 1999 were $37,000 and will be $37,000 again in 2000 given their current plans. The farm made no capital purchases in 1999. B&B plans to purchase a sprayer in March of 2000. The estimated cost of the sprayer is $12,000. Of this amount, $9,000 will be financed with three equal annual payments starting in March 2001. The following exhibit summarizes this information in the form outlined in Worksheet 1 for both the just completed year and next year.
Exhibit 1 shows that the actual term debt coverage ratio for B&B farms was 83% in 1999; it is projected to improve to 95% for the year 2000. Generally, a term debt cover-age ratio of less than 125% is cause for concern. The bare minimum that will be acceptable, even to lenders of last resort, is normally 110%. The unpaid operating loan balance from 1999 has been added to scheduled term debt payments in 2000, because unpaid carryover debt is by definition term debt in 2000. The estimated interest expense on the $15,000 carryover debt was added to the term debt interest expense in 2000. In addition, the estimated interest expense that will accrue on the sprayer note in 2000 has been added to the estimated interest expense on term debt for 2000. We would recommend that B&B Farms consider refinancing the 1999 operating debt carried over to 2000 with a separate term note, rather than rolling it into the operating loan for 2000. It is obvious that the refinanced amount won’t be paid in full, if the 2000 year outcome is consistent with expectations.
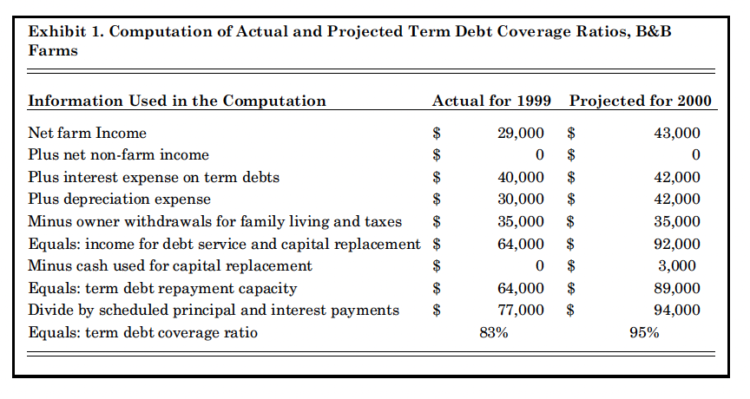
Exhibit 1. Computation of Actual and Projected Term Debt Coverage Ratios, B&B Farms
Classification of Farm Debts
Correctly classifying farm loans into their current (due this year) or noncurrent components (due in later years) is a key step in producing accurate liquidity and repayment capacity measures. If a term debt is incorrectly classified as a current liability, it may be overlooked altogether in the computation of repayment capacity measures. The oversight will result in overstated measures of repayment capacity and understated measures of liquidity. Only the amount the borrower is expected to pay during the current year on each loan should be classified as a current liability. Any remaining principal balance should be classified as a noncurrent liability, and the estimated future annual payments on that balance should be taken into account in the computation of repayment capacity measures.
Cash Flow Budgeting*
The repayment capacity measures described in the previous section still may not tell us everything we need to know to manage repayment capacity and avoid get-ting caught short of cash. The problem is that repayment capacity measures tell us about the total amount of repayment capacity for an accounting period, but they don’t tell us anything about the timing of cash inflows and outflows during that accounting period. Periodic cash flow budgets can be used to determine both the timing and the amount of financial obligations that can be met by a farm business, and therefore cash flow budgeting provides another extremely useful tool for managing repayment capacity.
A cash flow budget is an estimate of all planned or expected cash receipts and cash expenditures during a certain time period. Estimates may include non-farm income and expenditures. Estimates are made monthly, bi-monthly, quarterly, or annually depending on the desired amount of detail, the seasonality of cash flows, and how the information will be used. For loan documentation, an annual summary may be sufficient. But, for planning and control purposes, the year should be divided into shorter time periods, because longer periods may obscure exactly when during the year that cash will run short and why that shortage occurred. Tables 1 and 1a illustrate an annual cash flow bud-get that has been divided into six bi-monthly periods for budgeting and reporting purposes.
Cash flow budgets are quite different in another way from the financial measures discussed earlier. Cash flow budgeting looks only at money movement, not at profitability. The only stock amount that is almost always reported in a cash flow projection is the stock of cash. Some-times the stock of liabilities is summarized in the cash flow projection, but not always. So cash flow projections show very little, or at most a very incomplete picture, about the financial position of a business and how that financial position changes as the money flows in and out. It is possible to increase cash inflows at the expense of assets, for example through the liquidation of inventory, in a way that is not readily apparent from a cash flow projection. Net cash income from farming can usually be determined from a cash flow projection; but it is frequently quite different than accrual-adjusted net farm income and should never be considered a reliable measure of periodic net farm income. An annual cash flow projection is therefore useless as a tool for assessing farm profitability or farm financial efficiency. Furthermore, it is quite possible to cash flow for one or more accounting periods even though a farm currently shows no actual repayment capacity whatso-ever. A multi-year cash flow may help to identify farms that have strong current cash flows, but weak profitability. But neither periodic nor multi-year cash flow budgeting are substitutes for accrual-adjusted measures of profitability and financial position. Instead, financial analysis and cash flow budgeting should be recognized as being complementary management activities.
The interpretation of a cash flow budget hinges on how cash inflows and outflows affects the cash balance at the end of each period, which is reported on the last line in Table 1a. If cash is short, then additional operating borrowing may be necessary in order to cover the shortfall. Alternatively, other adjustments can be made that affect the timing and amounts of cash inflows and out-flows. If a cash flow budget projects a cash deficit for the upcoming year, that is a very good sign that significant adjustments may be needed in planned operating, investing, and financing activities. Plans should be changed before the year starts in order to prevent the cash shortfall. Some farmers operate with a line of credit from their lender with a maxi-mum borrowing limit. The cash flow budget can be used to test if the need for operating capital will exceed this limit and, if so, when the line of credit will be exceeded.
Illustrative types of seasonal adjustments that can be made when projected net cash flow is positive for the whole year but negative for some periods include the following.
- Shift the timing of certain planned sales.
- Shift the timing of certain planned expenditures.
- Increase short-term borrowing in periods with negative cash flow with repayment projected in periods with positive cash flow. Don’t forget to add the estimated interest charges on the additional borrowing to projected interest payments.
- Delay the due date of fixed debt payments to periods with positive net cash flow.
If total projected net cash flow for the year is negative, the following annual adjustments can be made.
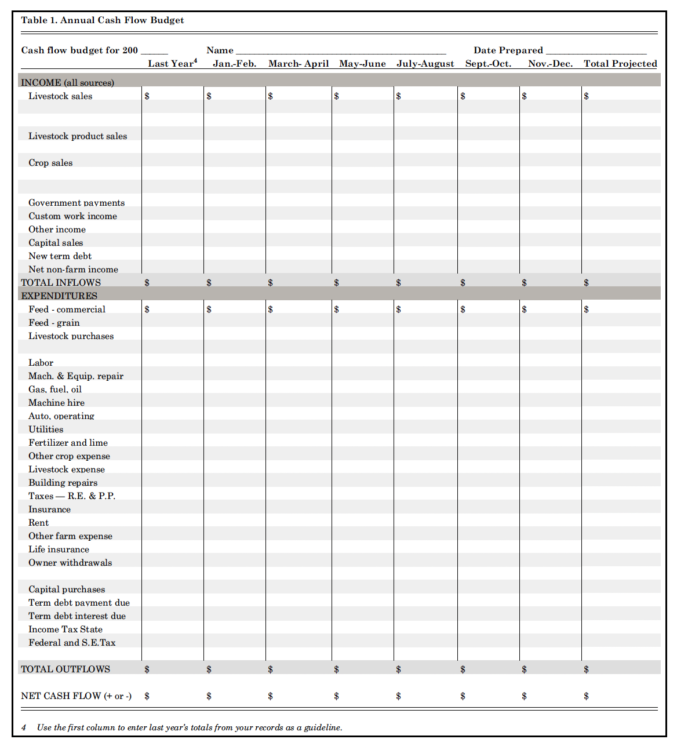
Table 1. Annual Cash Flow Budget
- Sell more current assets (crops and livestock). Be careful here, though, reducing inventories may solve the cash flow squeeze this year, but result in even more severe problems next year.
- Finance capital expenditures with credit, or postpone them until another year.
- Try to reduce the size of intermediate and long-term debt payments by lengthening the repayment period or adding a balloon payment at the end.
- Convert carry-over short-term debt to intermediate or long-term debt by refinancing.
- Reduce non-farm expenditures or increase non-farm income.
- Sell intermediate or long-term assets.
Review your cash flow budget from time to time during the year. Prices and costs may have been different from your estimates, or pro-duction plans may have changed. Better yet, prepare a cash flow summary of your actual cash flows as you proceed through the year. Com-pare these directly to your budgeted cash flows. This type of systematic comparison of planned results to actual results is called a “control activity.” This will help you anticipate changes in your needs for cash and credit during the year that weren’t adequately reflected in the budget and it will result in greater management control over business finances.
A cash flow budget can also be very helpful in evaluating major capital investments or changes in the farm business. Examples are purchasing land, building new hog facilities, or expanding a beef cow herd. Often it will be necessary to develop multi-year budgets: one for a typical business year after the investment or change in the business is complete and one for each of the intermediate or transition year(s). Oftentimes, there is a lag of several months to several years between when the initial expenditures associated with a capital investment are made and when the full income potential of the new asset is realized.
Developing a cash flow budget for the first time is never easy. The account totals from last year’s records provide a good beginning point. Notice that Table 1 provides a column just for those totals. Those numbers provide the best evidence you may have of a reasonable estimate for next year for some of the revenue and expense categories. On the other hand, many of the values for revenues and expenses should be estimated based on your plans for the new year. Additional information about the development of a cash flow budget is available in Purdue Extension publication EC-616, “The Projected Cash Flow Statement.”
Because of the large amount of detailed information contained in a monthly or multi-year cash flow, a computerized cash flow generator should be considered as an alternative to making all the calculations by hand. A computer program can pro-vide a framework for making the necessary computations. A computer can also ease the number-crunching chores. In particular, it is much easier to make needed adjustments to the cash flow in a computerized environment. Computerized cash flow generators generally have routines for estimating loan payments and scheduling loans. The best programs include tools for budgeting expenses that typically change from year to year, estimate changes in balance sheet accounts likely to be affected by cash inflows and outflows, such as inventories, and provide monitoring worksheets to facilitate the comparison of the projected cash flows with actual cash flows. The FINFLO pro-gram in FINPACK is a prime example of a computer software program designed for developing monthly budgets for a single-year or multi-year cash flow budgets.
How Much Total Farm Debt Can I Repay?
One question often asked by farmers is, “How far in debt can I safely go?” The answer to this question will be different for each farmer and will depend on the extent of their preference for risk, their management ability, and a whole host of other considerations. Maintaining a proportionately large amount of equity has been a time-honored technique for managing the ups and downs of farming over the long haul. Debt levels in agriculture have on the whole been lower than they might other-wise have been if debt had been viewed in a different manner and other tools for managing risk had predominated. But it is possible to approximate an answer to the question of a safe debt load for an individual farm using actual measured (or estimated future) repayment capacity.
Answering the question first requires rephrasing the question
“How far in debt can I safely go?” to read “How much debt can I repay?” The maximum amount of debt that can be repaid with a farm’s measured repayment capacity is the maximum safe debt load for the farm.
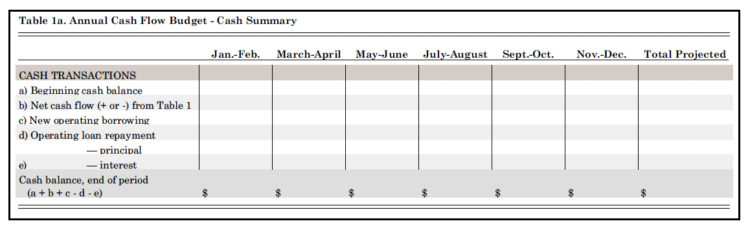
Table 1a. Annual Cash Flow Budget – Cash Summary
If we assume an even total (principal plus interest) debt payment schedule, the amount of term debt that can be supported with a given amount of repayment capacity can be estimated using a table of amortization factors such as Table 2. In essence, an amortization factor indicates the annual cash requirement associated with repaying a dol-lar of farm debt. If we borrow money today and plan to repay a specified constant amount of principal and interest each year, we can set up an amortized (equal payment) loan with the lender. The amortization factor indicates the repayment requirements for both principal and interest for each dollar of debt. For example, at 8-percent interest, a loan of $1,000 repaid over 10 years would require an annual payment of
$148.53 ($1,000 × .14853). Thus, $1,000 of annual repayment capacity will pay the principal plus interest on a 10-year loan of $6,710 (1,000 ÷ 0.1490, from Table 2). If the $1,000 of annual repayment capacity is expected to recur every year for the next 20 years, it could service a maximum of $9,818.36 ($1,000 ÷ .10185). Thus, extending the length or term of the loan increases the amount of debt that can be supported with a specified amount of annual repayment capacity. Amortization factors for shorter repayment periods and higher interest rates result in reduced amounts of debt that can be repaid.
The maximum safe debt load computation requires that term debt repayment capacity be divided by the appropriate amortization factor from Table 2 for the specified interest rate and term of the note. Let’s assume that line item 4 in Worksheet 1 was used to compute term debt repayment capacity for White River Farms and the actual computed repayment capacity for 1999 was $85,000 per year. If the average actual repayment term for the farm’s liabilities was 9 years and the actual weighted average interest cost of farm debt was 9%, the implied maximum safe debt load for White River Farms is$509,592 ($85,000 ÷ .16680).
The absolute dollar amount of a farm’s repayment capacity will vary from year to year. One wouldn’t be wise to estimate the maximum safe debt load based on a farm’s highest net income in the last 10 years. Net farm income may also include income from sources that are only temporary and aren’t likely to recur. These should be excluded when estimating the maximum safe debt load. Interest cost will also vary over time. It may be more conservative to use an estimate of the average expected future interest cost of farm loans. The average maturity of farm loans may also vary over time. It may be more conservative to use expected future repayment periods rather the current average maturity when estimating the maximum safe debt load for a farm business.
How Much Additional Debt Can the Farm Afford?
A farmer may also be interested in how much he or she can afford to borrow in addition to the farm’s existing liabilities. A related question is how any additional debt financing should be structured. That is, how much cash down payment can I afford and how long should the loan repayment period be? In this situation, the computation should be based on the farm’s term debt repayment capacity margin rather than term debt repayment capacity. Only the term debt repayment margin is available to service additional/new debts.
For example, Jon Corngrower’s farm had an actual term debt repayment margin of $21,000 in 1999. This appears to indicate that he has some capacity to take on additional debt. He wants to trade tractors before spring fieldwork starts in earnest. The cash difference on the trade he is considering will be $59,000. He knows he has already earned the $21,000, so he can safely spend it. The maximum amount of cash available for a down payment is$21,000, because any cash paid in excess of that amount will have to be financed in one way or another. Jon decides to set aside $11,000 to pay income and self-employment taxes for 1999 and will make a cash down-payment of $10,000.
Let’s assume that Jon’s 1999 term debt repayment margin of $21,000 is indicative of what he can expect over the next few years while he will be paying for the tractor. Thus, the annual payments on the tractor loan should be well below $21,000. He needs to leave at least some of the
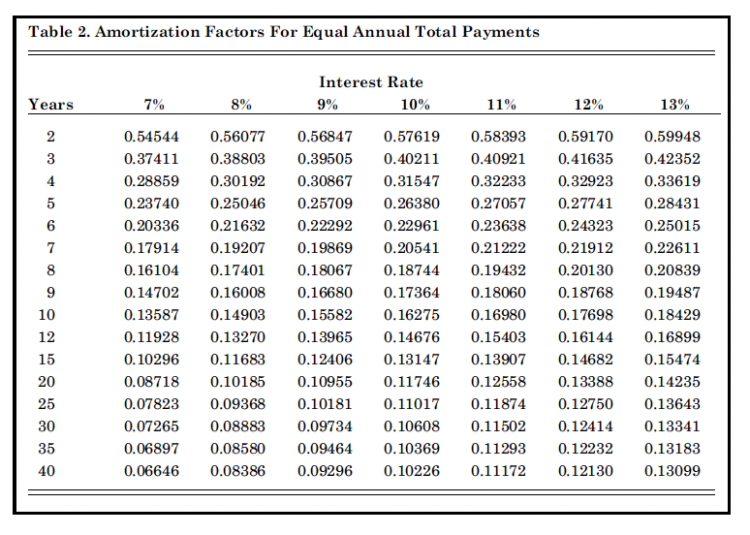
Table 2. Amortization Factors For Equal Annual Total Payments
$21,000 expected annual term debt repayment margin as a buffer against income variability. If he could find a seven-year loan at a 9-percent interest rate, the annual loan payment on the $49,000 loan would be $9,735.81 ($49,000 × .19869), which is within the margin of $21,000. But even this relatively long repayment period for the tractor is going to leave the farm with annual payments for the next seven years that will take a big bite out of the farm’s expected repayment margin.
Estimating How Much of the Cash on Hand Is Available for Investment or Additional Repayment?
A question that is very much related to the previous discussion is how much of the cash that is actually on hand at any given time is really available for owner withdrawals or capital purchases. Farm businesses typically have significant amounts of cash on hand at one time or another that sometimes appears to be avail-able for capital investments or owner withdrawals, but that in fact are already committed to other uses later in the year. At such times the farmer may be very tempted to repay existing debts early or make additional capital investments. A detailed cash flow budget that has been adjusted to reflect actual inflows and outflows year-to-date is one tool that can be used to deter-mine whether what appears to be some extra cash on hand is really surplus. Another way that is easier is to estimate the term debt repayment margin.
For example, let’s assume that Jon Corngrower decides to add wheat to his crop mix in 2000. Assume that on August 1 he sells his wheat crop, which turns out to be larger and higher priced than he expected, for $40,000. He had sub-mitted a forecasted income statement for 2000 as part of his documentation for his 2000 crop loan showing the estimated value of the wheat at $33,000. He had just about convinced himself to use $32,000 of the $40,000 from the wheat sale to pay cash for a new pickup truck. He hadn’t included the truck purchase in his planned capital purchases in his loan documentation, so he decided to revisit his forecasted income statement for 2000. After adjusting estimated revenues for the$7,000-increase in wheat revenues, he estimated the farm’s term debt repayment margin for 2000 using Worksheet 1. The updated estimate of term debt repayment margin with-out figuring in the new truck is
$27,000. At most, only $27,000 of the $40,000 of money on hand from the wheat sale is really uncommitted and actually available for additional investments, debt retirement, or owner withdrawals. A prudent manager in this situation would not pay$32,000 cash for the truck.
Final Comments
Repayment capacity deserves careful attention and is eminently manage-able. Repayment capacity is an important determinant of the ability to obtain farm financing. As such, one important aspect of managing repayment capacity involves working effectively with lenders by providing the evidence they need to document repayment ability. But managing repayment capacity should start on the farm and not in the lender’s office. There are different ways to manage repayment capacity. Some of the alternatives that we called “operational strategies” may be easier to use and more effective for some farmers than those normally associated with loan documentation.
Repayment management requires measuring and monitoring repayment capacity. The measures may be based on actual historical financial information or on estimated future financial information. Liquidity measures, such as the current ratio and working capital, are sometimes used as indicators of repayment capacity. Because of their exclusive focus on the stock of current financial assets and liabilities, they are only short-term indicators of repayment capacity at best. They should be used in combination with true repayment capacity measures, like the term debt repayment margin or the term debt coverage ratio, or with cash flow projections in order to avoid a very short-sighted perspective.
Repayment capacity measures tell us whether farm income was or will be adequate to service scheduled debt payments, as well as to provide adequately for family living expenses, taxes, and reinvestment in the farm operation. The starting point for measuring repayment capacity is determining accrual-adjusted net farm income. Repayment capacity measures do not show whether the timing of cash inflows and outflows will cause repayment shortfalls during the year. A periodic cash flow budget is a particularly useful tool for managing both the amount and timing of repayments during a particular year. However, a cash flow budget can not be used to measure farm profitability. Ultimately, scheduled farm debts, farm family living expenses, income and self-employment taxes, and farm reinvestment must be paid from net farm income (possibly with some help from non-farm income) rather than from cash flows. For that reason, a thorough manager should compute repayment capacity measures, like the term debt coverage ratio or the term debt repayment margin, in addition to using a cash flow budget. A multi-year cash flow budget, like repayment capacity measures, is recommended for planning capital investments in a farm operation.
A knowledge of repayment capacity and how it can be estimated can be used to answer questions that tend to crop up frequently in farm decision making. Questions about how much additional debt a farm can afford to incur and how to structure the financing for capital purchases are perfect examples.
* Adapted from Edwards, William,
“Developing a Cash Flow Budget,” Ag Decision Maker, C13-15, July 1995, and Edwards, William, “Analyzing a Cash Flow Statement,” Ag Decision Maker, C3-16, May 1995.
![]()
![]()
![]()
![]()
![]()
