Can Indiana Farmers Make Money Producing Catfish?
August 16, 1993
PAER-1993-12
Nancy Scott, Former Graduate Research Assistant; John E. Kadlec, Professor; Jean R. Riepe, Research Associate; and LaDon Swann, Aquaculture Extension Specialist, Department of Animal Sciences
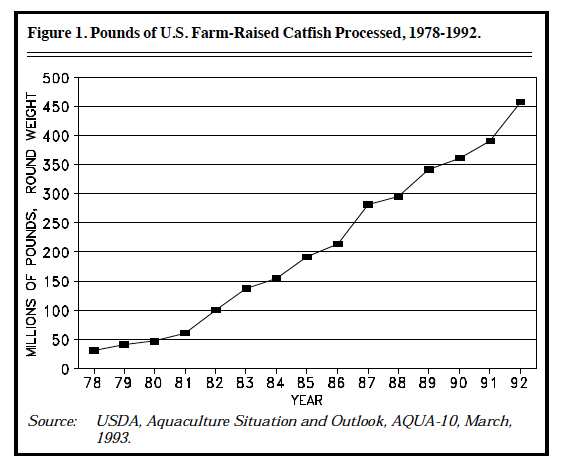
The production and consumption of catfish have increase substantially during the past 15 years (Figure 1). Farm-raised catfish represent the fourth most valuable seafood species when comparing value of domestic production — behind salmon, shrimp, and crab. In 1992, 457.4 mil-lion pounds of live-weight farm-raised catfish were processed, com-pared with only 30.2 million pounds in 1978.

Figure 1. Pounds of U.S. Farm-Raised Catfish Processed, 1978-1992
Catfish has become more widely accepted by consumers. Farm-raised catfish, fed primarily a diet of corn and soybean meal, is a mild-flavored fish that can be prepared many ways. Catfish is high in protein, vitamins, and minerals but contains lit-tle saturated fat. In light of increased consumer demand for catfish and interest by Indiana farmers, the purpose of this study was to answer the question “Is catfish pro-duction likely to be profitable for Indiana farmers?”

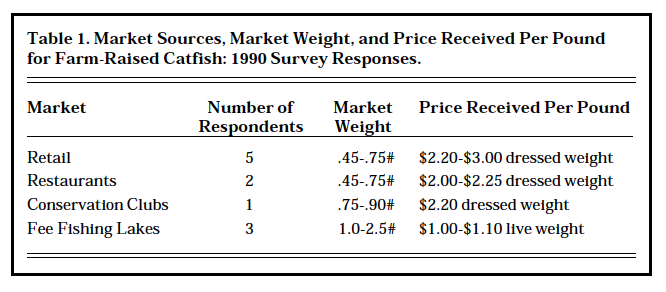
Table 1. Market Sources, Market Weight, and Price Received Per Pound for Farm-Raised Catfish: 1990 Survey Responses
To answer this question, the profitability of catfish production in Indiana was evaluated for three pro-duction systems: constructed ponds, cages in existing ponds, and indoor recirculating systems. Surveys of 13 fish producers, along with previous studies, were used to estimate costs and returns for the three production systems. Profit potential for catfish production in Indiana was evaluated, and Indiana costs of production were compared to those in Mississippi.
Accurate estimates of costs are difficult in a new industry such as catfish production in Indiana. In an undeveloped industry the few farms, input suppliers, and markets in the state are probably not attaining economies of size nor peak managerial efficiency. Hence, cost estimates tend to be higher than they would be in a fully developed industry, and few marketing alternatives exist to provide an accurate view of revenues. If the catfish industry grows in Indiana, costs will likely decline. Nevertheless, even with these short-comings in mind, the catfish industry can benefit from the results of this study.
Indiana Catfish Markets and Prices
The producers surveyed reported selling fish to several different markets, including retail customers, fee-fishing operations, live-haulers, and restaurants. Prices received were highly dependent upon the market in which the fish were sold (Table 1). The markets available to Indiana producers fall into three general categories: retail sales to local markets, fee-fishing lakes and live haulers, and wholesale markets.
Retail Sales to Local Markets: Local markets are usually located within a 50-mile radius of the pro-duction site. Some farmers have developed a specialized local market and receive premium prices. These farmers have established a reputation for reliability and for delivering a high-quality product. Seven of the surveyed producers sold their fish directly to local customers. The fish were sold either live or dressed and were purchased at the farm or delivered. Several producers harvested fish in the fall, at which time they processed and froze them. The fish were then sold out of the freezers during the winter.
Two producers supplied fish to restaurants. The fish were usually processed by the farmer and delivered weekly. Fish were harvested when they reached .75-1.5 pounds live weight and typically yielded .45 -.75 pounds dressed weight and were sold for $2.00-$2.25 per pound. One producer established a yearly market by selling fish to Conservation and Lions Clubs for fish frys. These fish were typically sold at dressed weights of .75 – .9 pounds for $2.20 per pound. Most retail customers are repeat customers, and advertising is frequently by word of mouth.
Fee-Fishing Lakes and Live Haulers: Three of the producers sold direct to fee-fishing lakes or to live haulers who resold to fee-fishing lakes. Fee-fishing operators often paid above wholesale prices for fish. Live haulers also often paid favor-able prices to obtain good quality fish; however, they usually purchase fish only during a four to five month period from May to September. Some producers like to provide fish for fee-fishing lakes because the requirements for sorting and grading are not strict.
Wholesale Markets: None of the catfish producers surveyed sold fish to wholesale processing markets. Prices paid by wholesale markets generally are much lower than those paid by retail or live-haul markets. As an example, from 1985 to 1991, prices averaged about 70 cents per live pound, with yearly averages from 62 to 75 cents per pound.
Costs and Returns for Three Catfish Production Systems
Costs of catfish production vary by system of production. The following is a discussion of production methods and costs of production for each of the three systems.
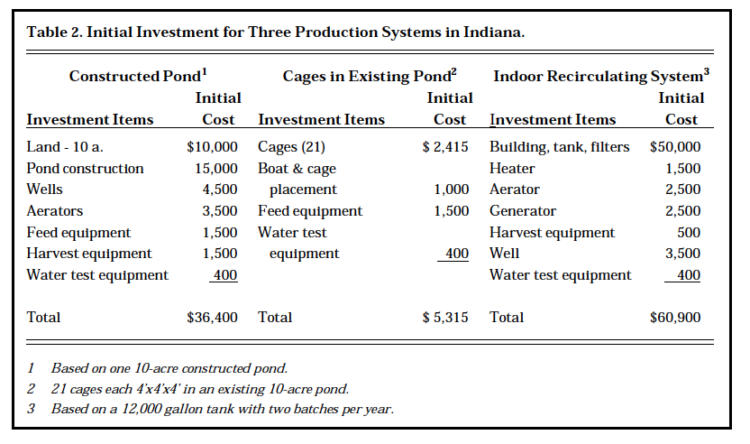
Ponds Constructed for Fish Production: For optimum operating efficiency, fish production ponds should be designed specifically for aquaculture. Ponds most suitable for aquaculture should be rectangular, four to six feet deep, have a smooth floor, and be easily drained and refilled. The investment for ponds constructed specifically for catfish production generally ranges from $2000 to $3000 per acre. The cost of pond excavation represents about 50 percent of this investment. Investments for pond production in Indi-ana are presented in Table 2, and an annualized budget is shown in Table 3. Assumptions included: one 10-acre pond; 16,850 fingerlings were stocked in the spring, with 16,000 fish harvested about six months later in the fall; these fish were fed twice per day an average daily total of 205 pounds of feed; and fish were harvested in late September at an average weight of 1.25 pounds each.

Table 2. Initial Investment for Three Production Systems in Indiana
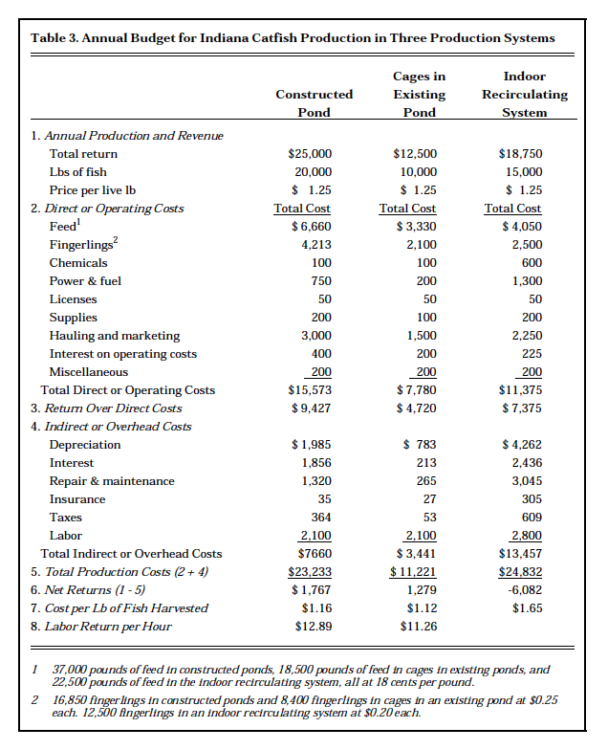
The cost of fish produced in the constructed pond was $1.16 per pound. Assuming a price of $1.25 per live pound, net returns would be 9 cents per pound or $1,767 per 10-acre pond. Return per hour of labor would be $12.89.
Climatic conditions is an important factor increasing cost for pond systems in Indiana. The optimum water temperature range for catfish growth (75˚ – 90˚F) is reached only four to six months of the year. Annual ownership costs associated with investments account for about one-fourth of the total cost. Fixed costs cannot be spread over as much production as would be possible in geographic areas that have optimum-growth temperatures for a greater number of months.
Cages in Existing Ponds: Many ponds in Indiana have been designed for watershed conservation, irrigation, livestock watering, or for recreational purposes. These ponds usually cannot easily be drained, and they may contain structures such as stumps or felled trees which make fish harvesting difficult. In Indiana, existing ponds are prevalent along the interstate highways since many were created as sources of fill dirt. Cage production enables many existing ponds to be used effectively for aquaculture. The cage encloses a number of fish in a con-fined area, thus making harvest much easier than in an open pond. The fish are either dipped out of the enclosure, or the enclosure itself is removed.
Cage culture is an attractive type of production system because mini-mal pond investment is needed. The only investment required is for cages, harvesting equipment, feeding equipment, and occasionally for pond improvement. The cost of cages for producers surveyed ranged from$50 to $75 each when constructed by the producers and $115 per cage when purchased. Typical cage dimensions were 4’ x 4’ x 4’. The length of the growing season is approximately six months starting in April.

Table 3. Annual Budget for Indiana Catfish Production in Three Production Systems
The cage culture budget in this study was based on a 21-cage unit with an existing 10-acre pond (Tables 2 and 3). Assumptions were: 8,400 fingerlings 6 to 8 inches long were stocked in April; 5 percent death loss; 8,000 fish harvested in the fall; and they were fed an aver-age of 103 lbs. of feed per day. Cost per pound of fish produced was $1.12 per live pound. With a $1.25 selling price, the net return was $1,279 for the pond or $61 per cage. The return to labor and management was $11.26 per hour. Cage culture enables some producers to utilize previously unused resources to increase their income.
Indoor Recirculating Systems: Indoor recirculating systems allow year-round fish production. Some producers stock fish continuously, while others raise one batch at a time. Of the producers interviewed who had used recirculating systems, only one was presently raising catfish. Several had raised catfish in the past, but had switched to other species. The major economic draw-backs to an indoor recirculating system are the high initial investment and the high annual operating costs, especially for heating the tanks. The investment expense can be reduced if existing buildings can be con-verted. For the five producers surveyed, the total initial investment ranged from $50,000 to $150,000 for a complete indoor recirculating system (Table 2).
The budget for an indoor recirculating system was based on practices used by producers interviewed and on a 12,000 gallon tank. Two batches of fish were produced per year. Assumptions included: 12,500 fingerlings 4 to 6 inches long were stocked for both batches; death loss was 4 percent; 12,000 fish were harvested; and they were fed twice per day an average daily total of 63 pounds of feed. Fish were harvested at about 1.25 pounds.
Production costs and returns for the indoor recirculating systems are presented in Table 3. The cost of pro-duction per pound was $1.65, and the net loss was $6,087 with the $1.25 selling price. While production efficiencies rival those found in the southern states, the additional investment expenses for facilities boost the total cost per pound of production above the $1.25 price received per pound. This conclusion is supported by research at North Carolina State University which showed “that catfish cannot be eco-nomically produced in recirculating systems” (Losordo, Easley, and Westerman).
Cost Comparison Between Indiana and Mississippi
Costs between $0.60 and $0.68 per pound are incurred by the most efficient producers to raise catfish in ponds in Mississippi (Keenum and Waldrop). Economies of scale are important in catfish production. Of the farm sizes compared in Keenum and Waldrop’s research, a 643-acre farm consisting of 32 ponds, each 20 acres in size, with three additional acres for buildings and operations, was determined to be the most cost efficient. The cost estimates derived in their study represent the average of the upper ten percent of the producers in terms of efficiency and productivity. The industry average productivity is substantially less than that of the group represented in this study.
The methods of calculating costs for the Keenum and Waldrop study were similar to those used in this study. However, the Mississippi cost estimates are for the most efficient farms, while the Indiana figures are for typical farms.
Following are comparisons of individual resource costs in the two studies. Feed was the single highest cost item of production, at $0.245 per pound of fish produced in Mississippi. In Indiana, feed costs were $0.33, $0.33,and $0.27 per pound of fish, respectively, for constructed ponds, cage culture, and indoor recirculating systems. Fingerling costs were consider-ably less in Mississippi than in Indiana. Mississippi producers paid an average of 7.5 cents each for a six-inch fingerling. Indiana producers paid 20 cents each for 4- to 6-inch fingerlings and 25 cents each for 6- to 8-inch fingerlings. Owner-ship costs (depreciation, interest, insurance, taxes) in the Mississippi study averaged $0.103 per pound of fish harvested. In Indiana, owner-ship costs were: $.28 per pound for constructed ponds, $0.13 per pound for cages in existing ponds, and
$0.71 per pound for indoor recirculating systems. Much of this substantial difference can be attributed to the lower stocking densities in Indi-ana as well as the slower growth of fish due to climatic conditions.
Summary and Conclusion
Indiana farmers can profitably produce catfish if they have special “niche” markets and if they produce fish in ponds. Indiana producers who do not have these special advantages are unlikely to make money raising catfish.
In Indiana, the average production costs per pound were lowest for cage culture and greatest for production in an indoor recirculating system. Production costs by system were $1.12 per live pound for cage culture in existing ponds, $1.16 per pound for con-structed ponds, and $1.65 per pound for indoor recirculating systems. The average price paid to producers surveyed was $1.25 per pound. This is more than $0.50 above wholesale price because the catfish were sold to special niche markets. The production systems showing a profit in Indiana were cage culture and con-structed ponds. However, Indiana production units are relatively small, and the catfish industry is not highly developed. Economies might be gained from increased size of pro-duction units and the establishment of more supply and marketing firms.
Costs of producing catfish are significantly higher in Indiana than in Mississippi because the growing season is shorter for pond production, the land is not as well suited for con-structing ponds for large volume pro-duction as in the Mississippi Delta, and input costs are higher due to the immaturity of the aquaculture industry in Indiana. However, catfish production can be profitable for Indiana producers using pond production who have “niche markets” such as local restaurants.
For more information on aquaculture production costs
and budgets, call Jean Riepe
(317) 494-4301.
References
- Keenum, Marke E. and John E. Waldrop. “Economic Analysis of Farm-Raised Catfish Production in Mississippi,” Technical Bulletin 155, Mississippi Agricultural and Forestry Extension Station, July 1988.
Losordo, T.M., J.E. Easley, and P.W. Westerman. “The Preliminary Results of a Feasibility Study of Fish Production in Recirculating Aquaculture Systems.” Paper presented at the 1989 International Winter Meeting of the American Society of Agricultural Engineers. New Orleans, Louisiana, December 12-15, 1989.
