Cash Rent for Land
October 1, 1975
PAER-1975-2
Author: J. H. Atkinson, Professor, Agricultural Economics


Cash renting of farm land in Indiana has been increasing for a decade or more. Recent increases in prices of land, farm products and production inputs have prompted many questions about land rental rates.
Cash Renting Can Improve Management
Well-financed tenants who are good managers may increase profits by taking over all the management decisions. They may increase production on a particular tract, often by using more inputs like fertilizer, herbicides and better seed. More importantly, they may increase net returns to the entire business when it consists of several tracts of land owned by different people. If these tracts are share-rented, the tenant is under pressure from all landowners to maximize returns on each tract. But in a cash rent situation, the tenant has the flexibility to make decisions which will maximize returns to the entire business.
Disagreements about how the land ought to be managed can be avoided by cash leasing. In some situations, the land owner wants to be relieved of the management responsibility and risk which goes with share leasing and may thus find cash leasing an attractive alternative.
Determining Rental Rates
Rental rates for a given tract of land can be estimated by looking at the going rate for similar land or by using a rule of thumb percentage of land value. This article will present survey information on rental rates.
Estimates of the landowner’s return under a share lease are also useful in reaching a decision on whether to cash rent or not, or in establishing a cash rent figure.
As a rule, the landowner should not expect to earn as high a net return under a cash as under a share lease. This is true for several reasons: (1) part of the cash rent is usually paid in advance; (2) the landowner does not have to furnish capital for operating expenses; (3) there is less management for the owner; and (4) the landowner assumes no production or price risk. However, there are cases in which cash rent may provide as much net return as an existing share leasing arrangement. The operator may simply be willing to pay more in order to manage more efficiently, or a change from a poor share tenant to a good cash tenant may mean a higher return from cash rent.
But unless these special situations exist, the landowner can calculate a “cash rent equivalent” from expected share lease returns as follows:
Landowner’s share of crops $_______
Less costs except interest, tax and upkeep on land $_______
Gross rent $_______
To convert to a cash rent equivalent, the gross rent expected from a share lease should be reduced to reflect lower risk, advance payments and less management associated with cash rent. For example, if the gross rent expected under a share lease is $120 per acre, the landowner might be just as content to receive a cash rent of $96, in which case he would have discounted the share rent by 20 percent.
Estimates of Rental Rates
The USDA reported average cropland rental rates and rent as a percent of cropland values as follows:
———————————————————————
Year Rent Percent of value
———————————————————————
1972 $35 7.2
1973 $38 6.9
1974 $48 7.1
1975 $63 7.6
———————————————————————
Note that rent as a percent of value has increased in each of the past 3 years, in spite of big increases in land values. This probably is due to the fact that land values reflect income expectations for the long run, while rent represents payment for the right to receive income in the short run, often only one year. In view of the outlook for the year ahead, rent as a percent of land values may increase again in 1976, perhaps to around 8 percent.
Table 1 presents data obtained in a land values survey conducted in mid-1975. The average of all areas for rent of average quality land was, somewhat surprisingly, exactly the same as the USDA estimate $63 per acre or 7.3 percent of the estimated value of average land.
The averages presented in Table 1 are useful as rough guides to cash rental rates. They probably tend to be on the low side of newly-negotiated rent figures for 1975 for two reasons. First, rates on existing rental contracts, even when rent is renegotiated annually, tend to move up more slowly than rates on agreements between new tenants and landowners. Some landowners are not aware of the size of general increases in rent, while others are well satisfied with their tenant and are thinking in terms of an average rent over several years. Second, some of the rental rates reported may have been set a year or more earlier under a contract that specified the rent for a certain number of years.
In addition to being on the low side, there was considerable variation in rent reported for land of the same value or productive capacity. For example, in several instances, land of the same value was reported by one person to rent for double what another person reported.
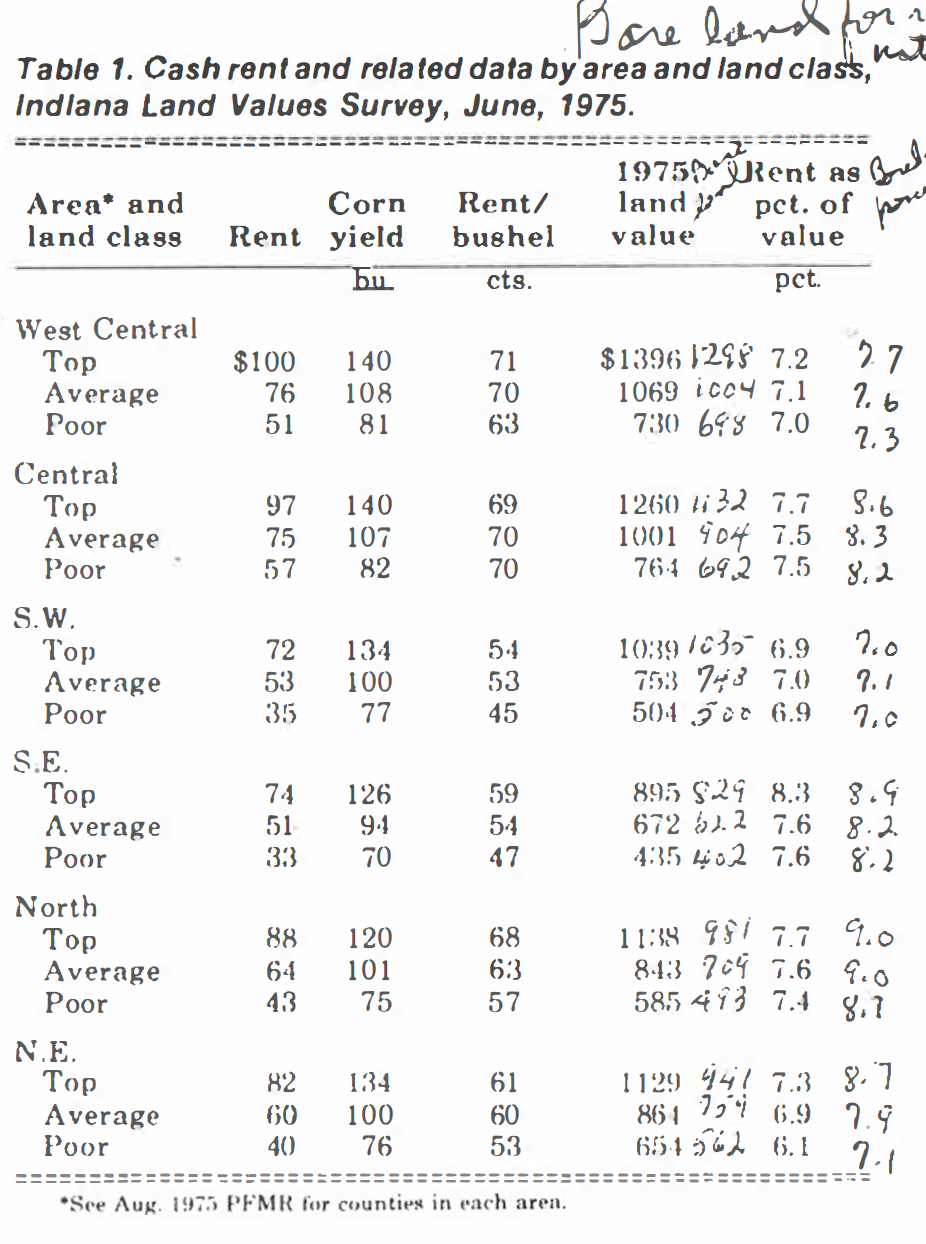
Table 1. Cash rent and related data by area and land class, Indiana Land Values Survey, June, 1975
But in spite of these limitations, the figures are useful beginning points for deciding what a given tract of land might rent for. (Remember too good 1975 crops in many areas of the state plus favorable grain prices may push cash rents higher in 1976 than in 1975.)
Table 1 indicates that bare land rents for top quality land averaged about $Mo per acre in the Central and West Central areas, $85 in the North and Northeast and about $73 in the two Southern areas. The corn yield capacity of the land accounted for some, but not all of these differences. Again, looking at the state as three regions, rent per bushel of estimated corn yield on top and average quality land was about 55¢, 65¢ and 70¢ for the South, North and Central areas. The Central area had the highest yields per acre, tending to reduce machinery costs per bushel and allow higher rents per bushel to be paid, but average yields on top land in the North and South were about the same.
The percent which cash rent was of estimated land value averaged 7.0 to 7.7 percent in a majority of the categories in Table 1 – fairly close to the 7.6 percent figure reported by the USDA as a state-wide average. In using a percentage of value to estimate cash rent, remember that value estimates vary considerably for land of similar quality. Obviously, land near town valued at $2,000 per acre will not bring doubt the rent of similar quality land 15 miles away which sells for $1,000 per acre.
Summary
Cash rent may appeal to well-financed tenants who are good managers, especially if they are renting several different tracts. Landowners who want a more certain income without involvement in financing and managing crop production may also find cash rental attractive.
In view of the prevalence of share renting, both operators and landowners may want to estimate costs and returns under typical share arrangements. By making allowance for differences in risk, management and operating capital between cash and share leases, a cash rent can be estimated which would give returns roughly equal to net share rent returns. This figure might serve as a maximum rent the operator would pay, or the minimum the landowner would accept.
In formation on the cash rental market should be obtained locally. Rough rules of thumb are: (1) cash rent averages around 7½ to 8 percent of cropland value and (2) cash rent per bushel of corn yield capacity averages 65a: to 70¢ in the northern and central parts of the state, around 55¢ in the south.
Final determination of the cash rental rate should also take into account the details of the agreement with regard to cropping programs, buildings, mowing fence rows, etc.