Cash Rental Rates for Farm Land
October 16, 1976
PAER-1976-2
Author: J. H. Atkinson Professor of Agricultural Economics
![]()
![]()
![]()
![]()
![]()
According to a June 1976 survey of 125 farm lenders, managers, brokers and appraisers, the average per acre cash rent for Indiana farm land in 1976 was $77. This is an increase over last year of $13 per acre or about 20 percent. The statewide average cash rent reported by USDA as of March 1, 1976, was close to the June survey figure-$72 per acre or a 14 percent increase over 1975 (Table 1).
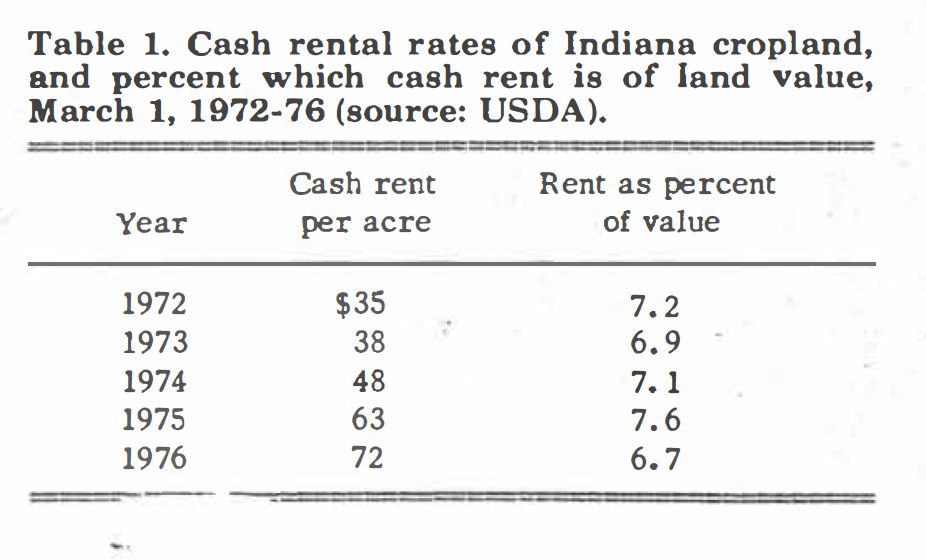
Table 1. Cash rental rates of Indiana cropland, and percent which cash rent is of land value,
March 1, 1972-76 (source: USDA).
The spring, 1976, statewide average value of cropland was $1238 and estimated to produce 104 bushels of corn in an average year. The $77-peracre rent thus figures out to be 6.2 percent of the land value-over a full percentage point lower than last year. Therefore, while cash rents increased in 1976, land values went up even more, resulting in a decrease in the percent that rent is of land values.
This also is evident in the USDA figures shown in Table 1. For the first time in 3 years, there has been a decrease in the percent that cash rent is of land values-.9 of a percentage point (from 7.6 to 6.7 percent).
A widely used thumb rule is that cash rents tend to run from 6 to 8 percent of land values. Both USDA and Purdue estimates fall on the low side of this range. But for the past couple of years, these estimates have been over 7 percent or above the mid-point of the 6 to 8 percent range.
The rental figures in the Purdue survey were for bare land. Respondents also were asked to estimate building values, which were included in their land values, and estimates were then made of bare land values. Statewide, the bare land value estimate was $1146, and average rent as a percentage of this figure was 6.6 percent-slightly higher than the 6.2 percent figure with buildings included.
There is, however, a major valuation problem in making adjustments for buildings. In some cases, land can be rented with or without certain buildings for about the same amount. These, typically, are such buildings as obsolete livestock facilities, old barns and cribs and dwellings not easily rented, even though they might be considered to have some value. In other cases, rent is higher when buildings such as grain storage, modern livestock facilities and machinery storage are included. Thus, the percent that cash rent is of estimated bare land values may be slightly on the high side, assuming that land values were at least partly reduced by the value assigned to nonrentable buildings.
For example, assume that an 80-acre tract renting for $75 per acre has an unused house and barn “worth” $8000. The entire tract is valued at $96,000 or $1200 per acre. If the land value is reduced by $8000 or $100 per acre, the rent would be 6.8 percent of estimated value. For this to be a realistic way of viewing the situation, the landowner must have some expectation of eventually selling or renting the old buildings, otherwise he should calculate rent as a percent of the total value of $1200 per acre or 6.25 percent.
RENTAL RATES BY GEOGRAPHIC AREAS AND LAND CLASS
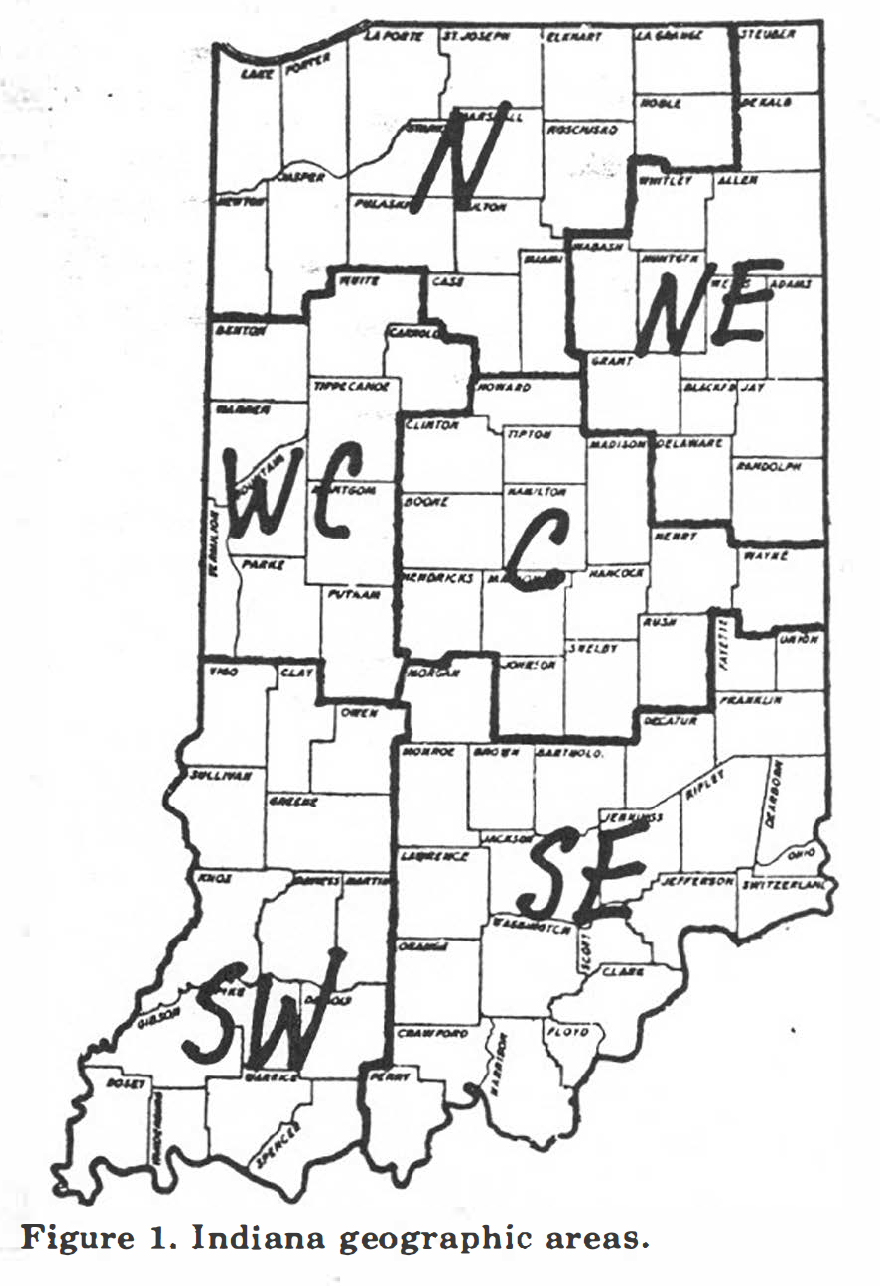
Figure 1. Indiana geographic areas.
The June survey also revealed that land values vary by geographic areas (Figure 1) as shown in Table 2. But rents, on the average, tended to vary with land values, so that the percent that rent is of land values was similar in all areas of the state except the Southeast. These percentage figures also were similar regardless of land quality.
With the exception of the Southeast and poor land in the Southwest, rent as a percent of value fell in the rather narrow range of 6.l to 6.8 percent on the average. Of course, individual figures for a given area and class of land varied considerably, but when they were averaged, they were very close together. For example, on $1000-per-acre land, the average rent would range from $61 to $68 per acre except in the Southeast, where rent for $1000-peracre land was indicated to be $80 to $82. The other exception was on poor land in the Southwest, where rent was 5.7 percent of land value.
Leaving out the Southeast, the state average bare land value was $1237, and cash rent was $79 or 6.4 percent of the value.
RENT PER BUSHEL OF CORN
Average rent per bushel of estimated “normal” corn yield ranged from 57 to 87 cents (Table 3). There was no clear-cut difference between top and average land, thus implying that renters of top quality land were getting the better deal, because fixed labor and machinery costs can be spread over more bushels of grain. The per-bushel rent on poor land tended to be somewhat lower than for better quality land.
In considering renting land of differing productivity, farm operators may need to make estimates of how much more rent per bushel they could afford to pay for better quality land. For example, 100-bushel land in the North rented for about $73 per acre. Assume that fixed costs, including the operator’s labor, were$60 or 60 cents per bushel. If these fixed costs could be spread over 132 bushels of corn (top quality land), cost per bushel would be 45 cents, a savings of 15 cents. Thus, the operator would be just as well off paying a rent of 88 cents per bushel (73 cents plus 15 cents) or $116 per acre for top quality land as he would be paying the reported average rent of $99 for this land.
This would give him a basis for bidding on the better land. Of course, he would not want to bid away his entire savings, but might rent the better land for $110 and made an additional $6 per acre over the lower quality land. The reported rent on top quality land could be taken as the starting point, in which case the break-even rent for average land would be lower than reported.
There were differences among geographic areas in per-bushel rents as indicated by these ranges for average and top land:
Southeast and Southwest 73¢ – 80¢
North and Northwest 61¢ – 70¢
West and West Central 82¢ – 87¢
Note that there is about a 10-cent-per-bushel difference between the areas as grouped above, with the highest figures being in the central part of the state. Lower rents per bushel in the North and South may reflect somewhat higher risk and production costs in these areas.
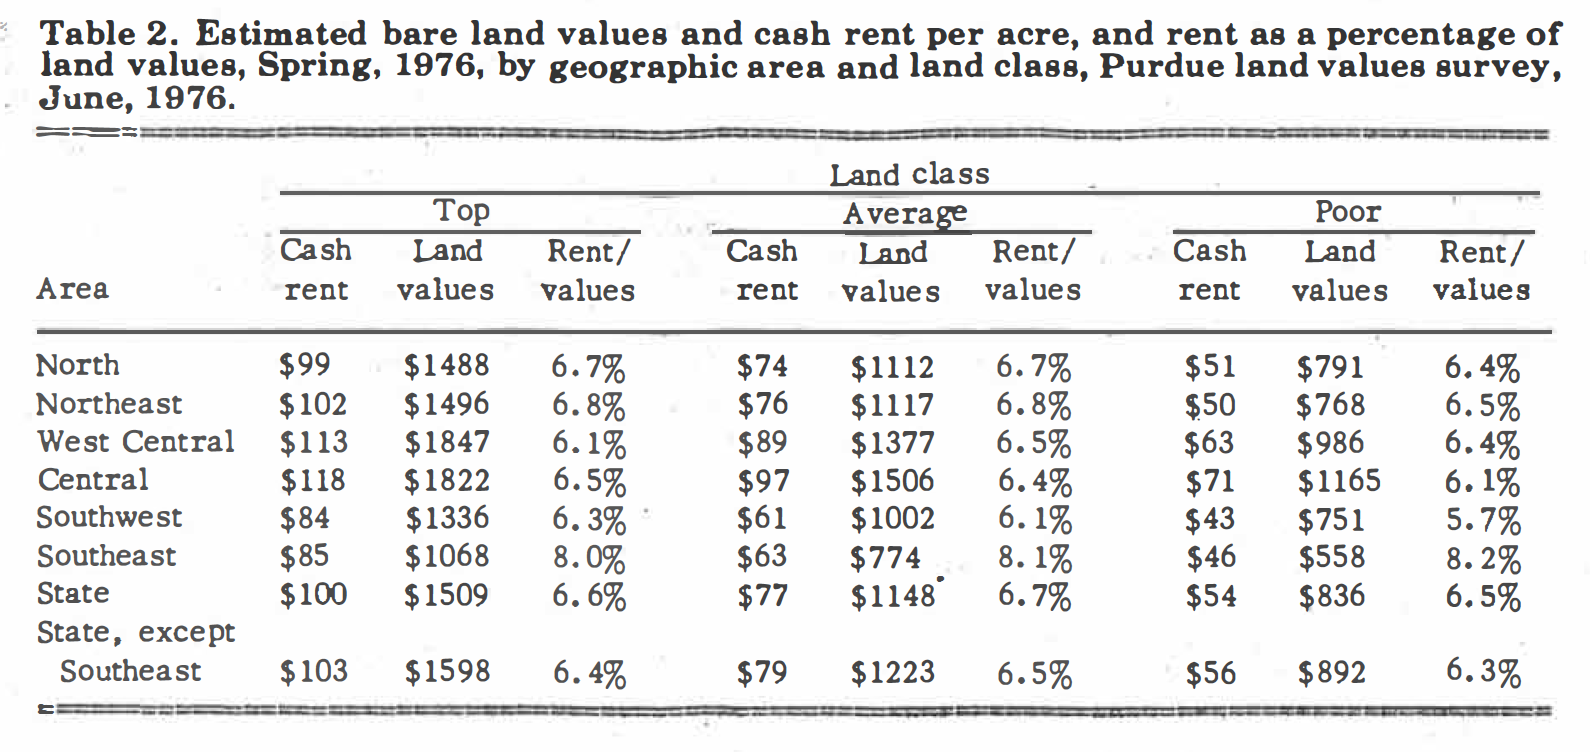
Table 2. Estimated bare land values and cash rent per acre, and rent as a percentage of land values, Spring, 1976, by geographic area and land class, Purdue land values survey, June, 1976.
IMPLICATIONS
Cash rents for land have increased to the point that, in some situations, the return to rented land may equal or exceed the return from share renting. For example, on HO-bushel corn land, 1976 typical landlord expenses were estimated at $57, including $15, for truces and other real estate expenses. With corn at $2.40 per bushel, the landowner would net $75 per acre.
Compare this with average land in the West Central area producing 109 bushels of corn per acre and renting for an average of $89. Subtracting $15 for truces and other land expenses leaves about the same net as would be realized under a typical 50-50 share lease. With corn prices above $2.40 per bushel, returns would be higher under the crop share lease; corn prices under $2.40 would mean higher returns from the cash lease.
Now consider the tenant. Under a 50-50 share lease, his expenses, not including labor, were estimated at $75. With corn at $2.40 per bushel, he would earn $57 for his labor. If he cash rented, his expenses would be $117; so with cash rent at $90 per acre, he would earn $57 for his labor-the same as with the share lease.
However, if he paid $90 rent and corn was only $2.00 per bushel, his labor return would be only $13 per acre ($220 gross receipts minus $117 operating expense minus $90 rent). With a share lease and $2.00 corn, he would still earn nearly $35 per acre for his labor. Thus, a major consideration in cash leasing is whether the tenant has the financial strength to accept the greater risk.
Similarly, the landowner needs to be aware of the likely variation he faces in share renting and the need for somewhat greater management and capital contributions.
In summary, the most likely cash rent operator is one who has sufficient financial strength to provide the capital and accept the risk associated with cash renting. He also needs to be a good manager and be able to profit from having full managerial control of the land which is cash rented. The likely landowner candidate for cash leasing is one who needs a secure income, is short on capital and not interested in participating in management decisions. However, in many
situations, both operator and landowner will need to analyze probable returns under both cash and share lease agreements.
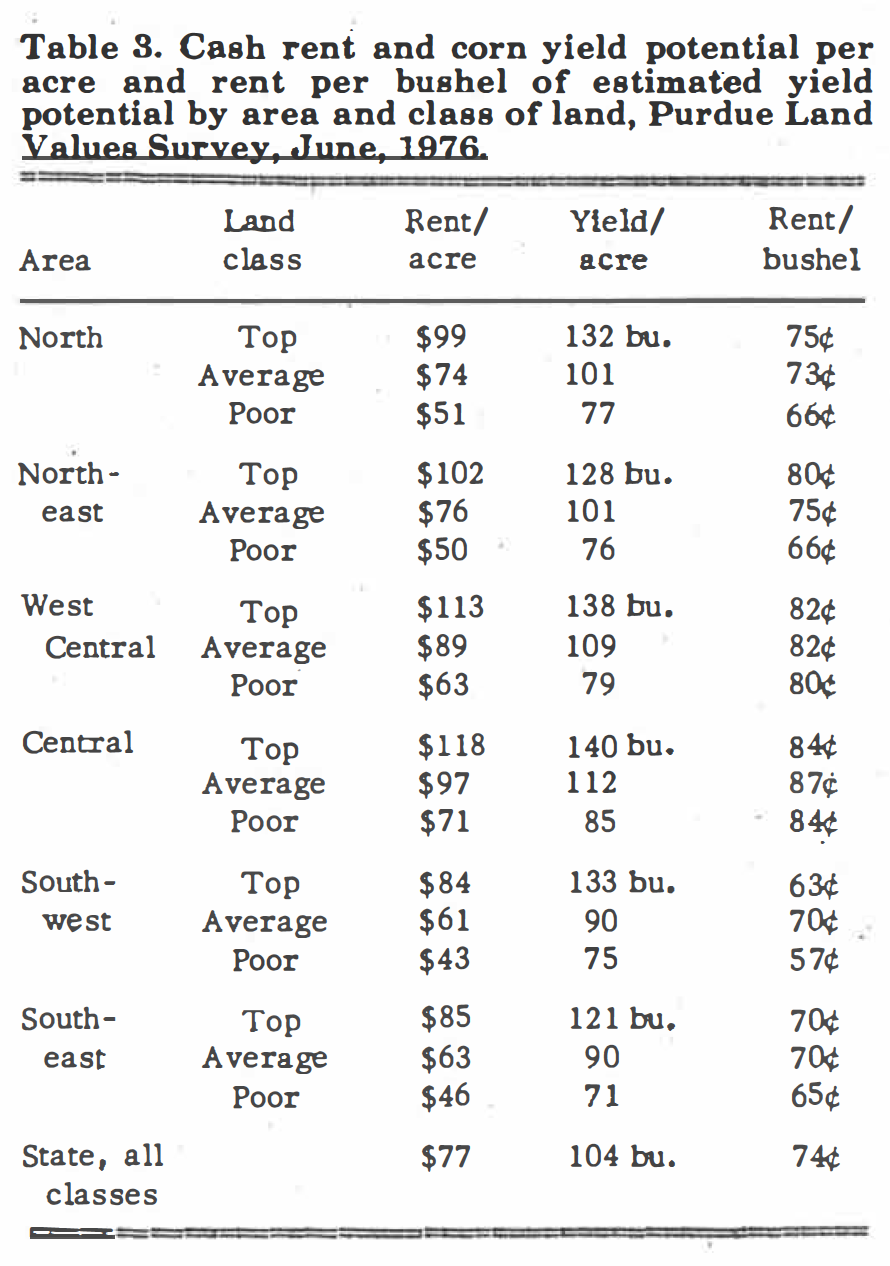
Table 3. ‘Table 3. Cash rent and corn yield potential per acre and rent per bushel of estimated yield potential by area and class of land, Purdue Land Values Survey, June, 1976.
![]()
![]()
![]()
![]()
![]()
