Cash Rental Rates: USDA-NASS vs. Purdue Survey
August 7, 2023
PAER-2023-28
Todd H. Kuethe, Schrader Endowed Chair in Farmland Economics
![]()
![]()
![]()
![]()
![]()
Cash rental rates are an important component of sound farm financial management. Each June, the Purdue Farmland Value and Cash Rent Survey collects cash rental rate information from numerous professionals knowledgeable of Indiana’s farmland market, including farm managers, rural appraisers, agricultural loan officers, and others. The results provide estimates of the average per acre cash rental rate for bare poor, average, and top quality farmland. The results are reported at the state level and for six regions. The survey is designed to provide helpful information to both famers and land owners.
The National Agricultural Statistics Service (NASS) of the United States Department of Agriculture (USDA) also collects cash rental rate information through the Cash Rents Survey. The Cash Rents Survey collects information from approximately 280,000 farms and ranches across the United States. Respondents report their total acres operated and acres rented for cash, with the option to also report rent per acre or total dollars paid in rental expense.
Each summer, USDA-NASS reports average per acre cash rental rates at the State level derived from the responses to the Cash Rent Survey. These values are plotted, along with the Purdue Farmland Value and Cash Rent Survey results, in Figure 1 from 1994 through 2022. It can be observed that the NASS cash rental rates per acre generally fall between the Purdue estimates for average and poor quality land. In addition, the USDA-NASS series exhibits smaller changes from year to year or are “smoothed.”
There are a number of reasons why Purdue and USDA-NASS aggregate cash rental rates may differ. The first is the differences in the pools of respondents for both surveys. While USDA-NASS surveys only farm operators, the Purdue survey includes a number of other market experts, including professional farm managers. Generally, farmland that is professionally managed rents for higher per acre value when compared to farmland that is not professionally managed (Schnitkey, et al, 2022). The second reason the two sources of information may differ is the way in which cash rental rates are collected. The Purdue survey asks respondents about the average cash rental rate for bare farmland at a given quality grade in their county, and respondents also provide the expected long-run corn yield for each quality grade in their county. The USDA-NASS survey, on the other hand, provides the option to report the farm-level rental expense on a total or per acre basis.
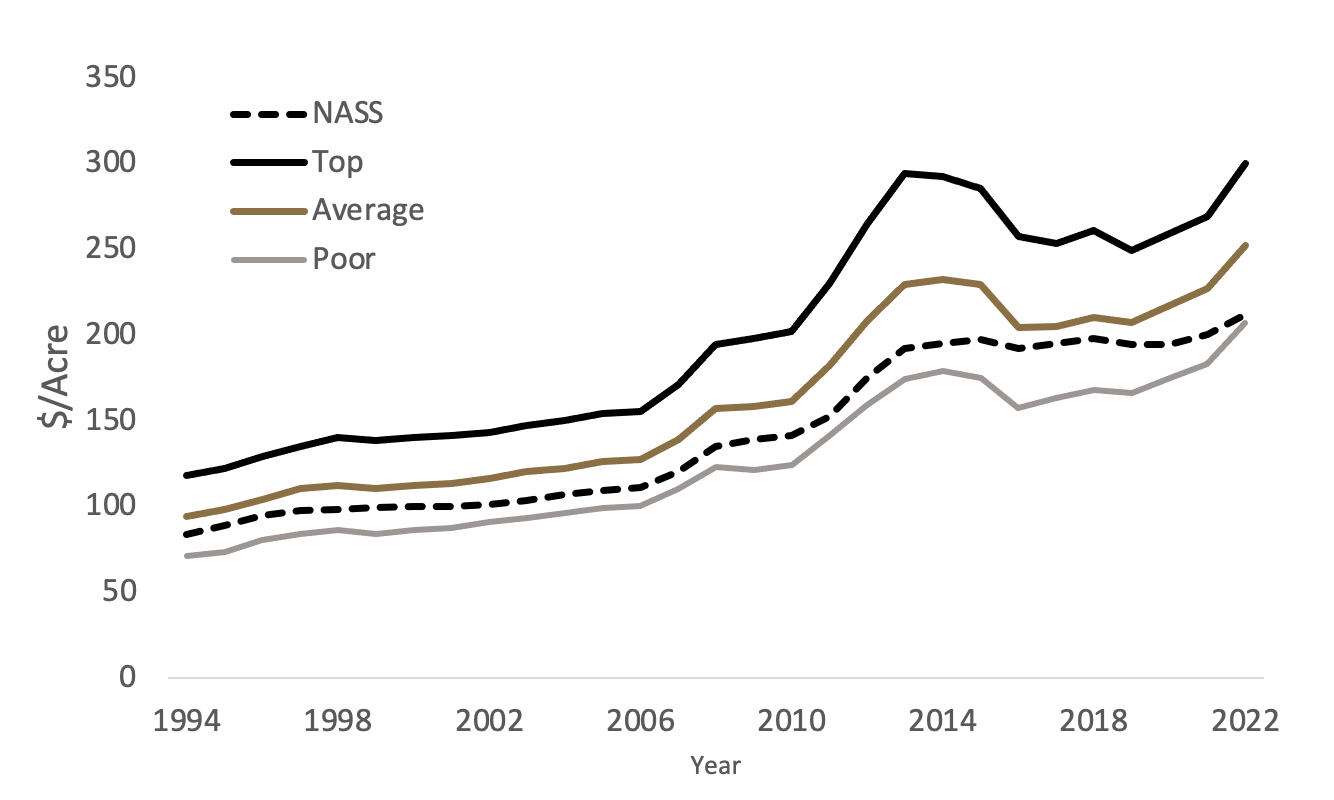
Figure 1: State-level cash rental rates, Purdue Land Values survey vs. USDA-NASS
In some years, USDA-NASS also publishes county-level cash rental rates for counties with a sufficient number of responses. Figure 2 plots the county-level USDA-NASS rental rates along with the state-level average per acre cash rents obtained from the Purdue survey from 2008 through 2022. Again, it can be seen that the majority of USDA-NASS county-level rent estimates are clustered between the Purdue estimates for average and poor quality land. However, Figure 2 also illustrates the high variability of county-level rents across Indiana. In some counties, the average rents across the county approach those of state-wide top quality land.
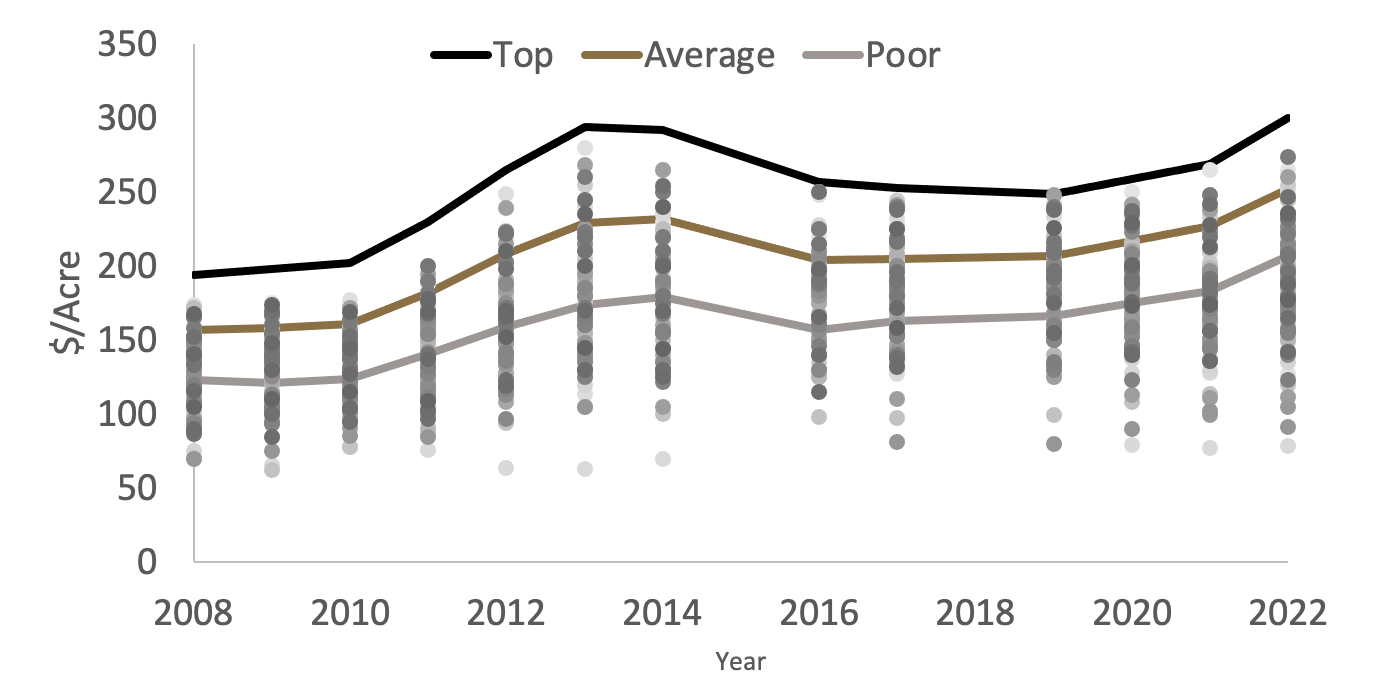
Figure 2: State-level cash rental rates, Purdue Land Values survey vs. USDA-NASS
As mentioned previously, the Purdue survey results are also reported for six regions across the state of Indiana (Figure 3). Figure 4 plots the average per acre cash rental rate for top, average, and poor quality land in each region from 2008 through 2022. The dashed line represents the average of the USDA-NASS county-level rent estimates within each region for the counties for which estimates were published. Again, the patterns observed at the state level in Figure 1 hold for each of the regions. Specifically, USDA-NASS estimates tend to fall between the average and poor quality land estimates from the Purdue survey, and the USDA-NASS estimates appear to exhibit less variation across years.
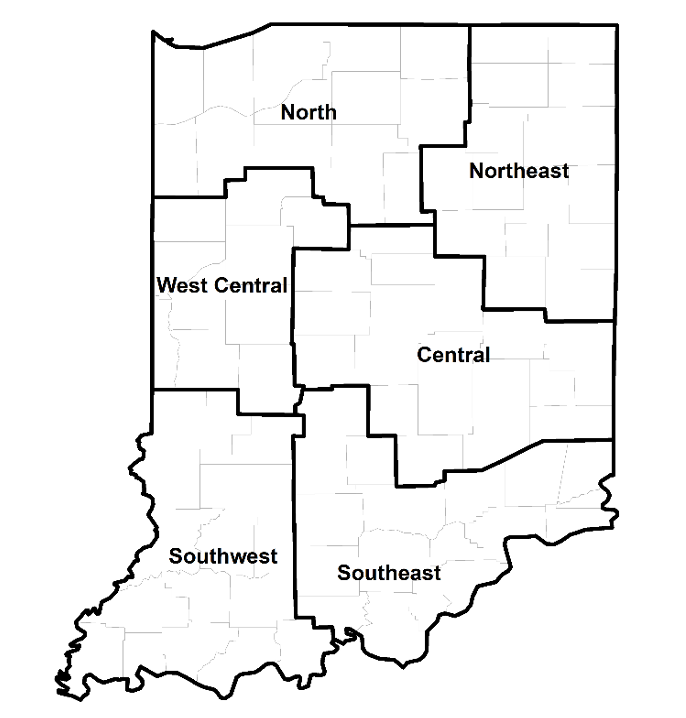
Figure 3: County clusters used in Purdue Land Values survey to create geographic regions
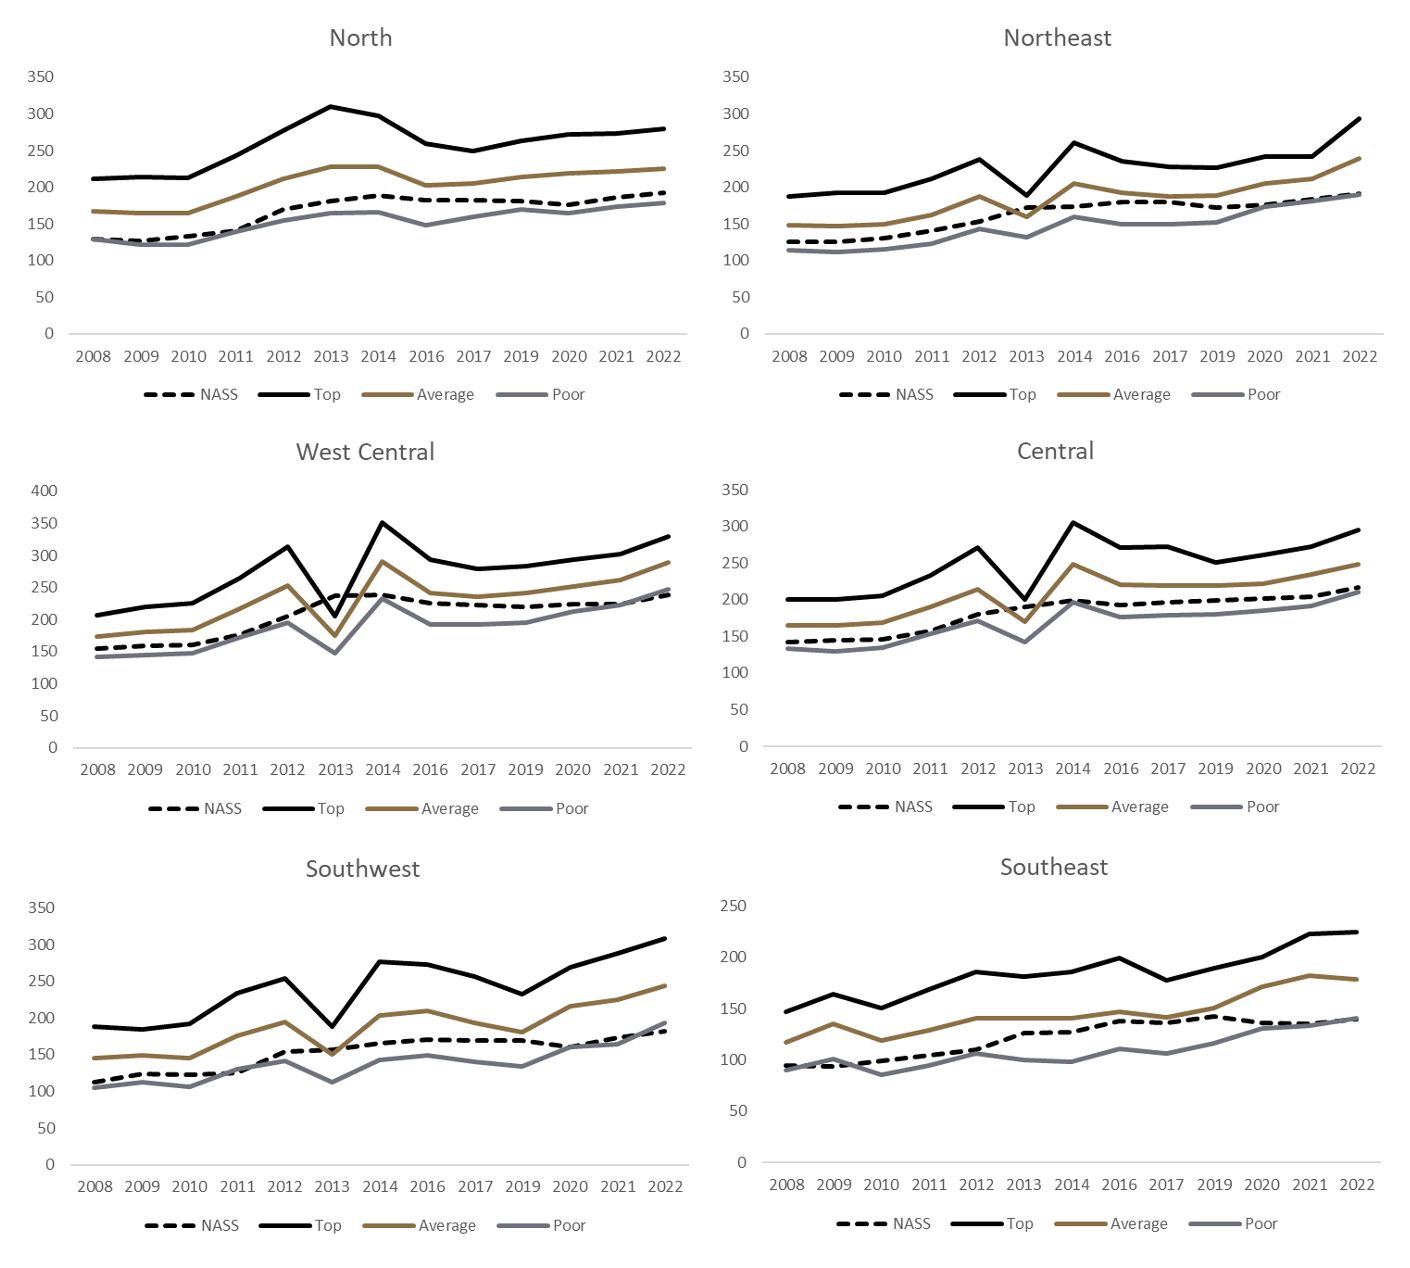
Figure 4: Regional cash rental rates, USDA-NASS vs Purdue Land Value survey
Summary
When setting cash rental rates, farmers and landowners should consider information from both the Purdue survey and USDA-NASS. Each source of information offers a variety of benefits and challenges. Farmland rental rates vary substantially both across and within counties. Further, most commercial-scale farms rent land from several landlords, and as a result, rental rates can also vary within a single farm enterprise. For this reason, it can be difficult to establish the appropriate rental rate for a specific parcel from aggregate values reported by either USDA-NASS or the Purdue survey.
Purdue Farmland Value and Cash Rent Survey
The Purdue Farmland Value and Cash Rent Survey is conducted each June. The survey is possible through the cooperation and contribution of numerous professionals knowledgable of Indiana’s farmland market. These professionals include farm managers, rural appraisers, land brokers, agricultural loan officers, farmers, and Farm Service Agency (FSA) county office directors. These professionals were selected because their daily work requires they stay well informed about farmland values and cash rents.
These professionals provide an estimate of the market value for bare poor, average, and top quality farmland in December 2020, June 2021, and a forecast for December 2021. To assess productivity of the farmland, respondents provide an estimate of long-term corn yield for top, average, and poor productivity farmland. Respondents also provide a market value estimate for land transitioning out of agriculture and for recreational land.
The data reported here provide general guidelines regarding farmland values and cash rent. To obtain a more precise value of an individual tract, contact a professional appraiser or farm manager that has a good understanding of the local market.
Prior reports are located at: https://purdue.ag/paer_archive.
![]()
![]()
![]()
![]()
![]()