Cash Rents Head Upward
October 23, 2011
PAER-2011-20
Craig Dobbins and Alan Miller
Since 2007, the change in cash rent reported by the Purdue Farmland Survey has been unusually variable. For the years 2007 to 2011, annual statewide cash rent for average land increased 0.6% to 13%. For this five-year period, the increase in annual cash rent averaged 7.6%. The prior five-year period, 2002-2006, the percent change in annual cash rent varied from 0.8% to 3.4% and averaged 2.4%. The 13% increase in cash rent in 2011 is the third largest increase in the 37-year history of the Indiana survey.
Many of the forces behind the 2011 increase are still in place. The domestic and international demand for U.S. corn and soybeans is expected to remain strong. USDA projects average 2011-12 corn and soybean prices will exceed 2010-11 prices. Indiana farmers are expected to have strong 2011 net farm income. Input prices are expected to be higher in 2012, but grain prices are expected to be strong and interest rates to remain low.
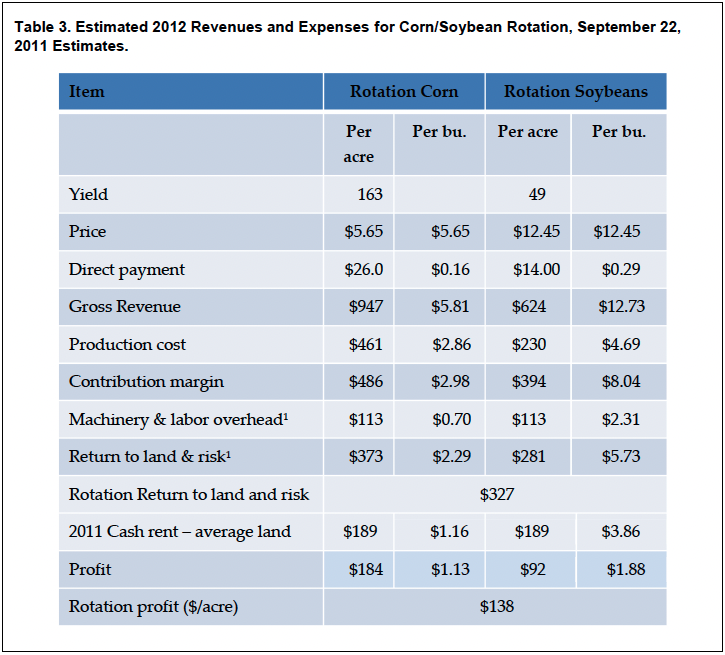
To obtain a 2012 estimate of the margin for paying rent, a 2012 corn/soybean rotation budget was prepared using expected 2012 cash prices based on futures September 22nd and shown in Table 3. Current federal government direct payments were assumed to remain in place. The return that remains to pay for average quality land using a corn-soybean rotation is $327 per acre on average quality land. Using $1.16 per bushel of corn for cash rent from the 2011 Purdue Farmland Value Survey results in a $189 charge for average yield land. Subtracting this land charge leaves an estimated per acre corn and soybean profit of $184 and $92, respectively. For the corn-soybean rotation, the profit is $138 per acre.
The budget attempts to reflect all the costs required to keep resources in their current use, corn and soybean production. Since revenue exceeds total economic costs, economists refer to the rotation profit as “excess profits.” Economic theory says that in the long-run, adjustments will occur that result in excess profits being zero. Common adjustments include increased production of corn and soybeans, which tends to reduce grain prices and excess profit decline. Another common adjustment is increasing production costs. This is already occurring with the increased cost of inputs, cash rent, and farmland. In most situations, both adjustments occur.

Table 3. Estimated 2012 Revenues and Expenses for Corn/Soybean Rotation, September 22, 2011 Estimates.
The estimated rotation profit indicates there will be upward pressure on cash rents this fall. On average, it would not be surprising to see cash rents increase as much as they did in 2011 which was up 13% on average quality land.
How much cash rents change in a specific situation will depend in part on what changes have already occurred. The variation in rainfall around the state and the impact it has on 2011 yields will also exert some influence on cash rent adjustments. If cash rents have been adjusted upward over the past five years though raising the base rent or receipt of bonus payments and yields this year are poor, the change for 2012 may not be large. If the cash rent has been stable because of a long-term lease or other reasons and yields are close to average, the increase could be large.
Budgeted returns are very sensitive to potentially large changes in expected 2012 crop prices. In this volatile environment, it is important for landlords and tenants to have a detailed discussion about crop yields, prices, and cost forecasts used to establish 2012 cash rents.
