Changing Crop Net Return Prospects
April 13, 2020
PAER-2020-05
Author: Michael Langemeier, Professor of Agricultural Economics
![]()
![]()
![]()
![]()
![]()
COVID-19 has resulted in widespread changes in crop and livestock prices. For example, corn and soybean prices have dropped substantially since late January. Corn futures price for the December 2020 contract declined 7.3 percent or -0.36 per bushel from late January to late March, and soybean futures for the November 2020 contract declined 5.2 percent or -$0.48 per bu. This article discusses the change in net return prospects for corn and soybeans that has occurred since late January, and compares net farm income per acre for 2020 to net farm income for recent years.
Cost and Return Prospects
Table 1 summarizes 2020 estimates in late January and late March of market revenue, variable cost, overhead cost, and earnings for high productivity soil in Indiana. Crop yields for rotation corn and rotation soybeans are assumed to be 210 and 65 bushels per acre, respectively. Comparisons between the two budgets can be found below.
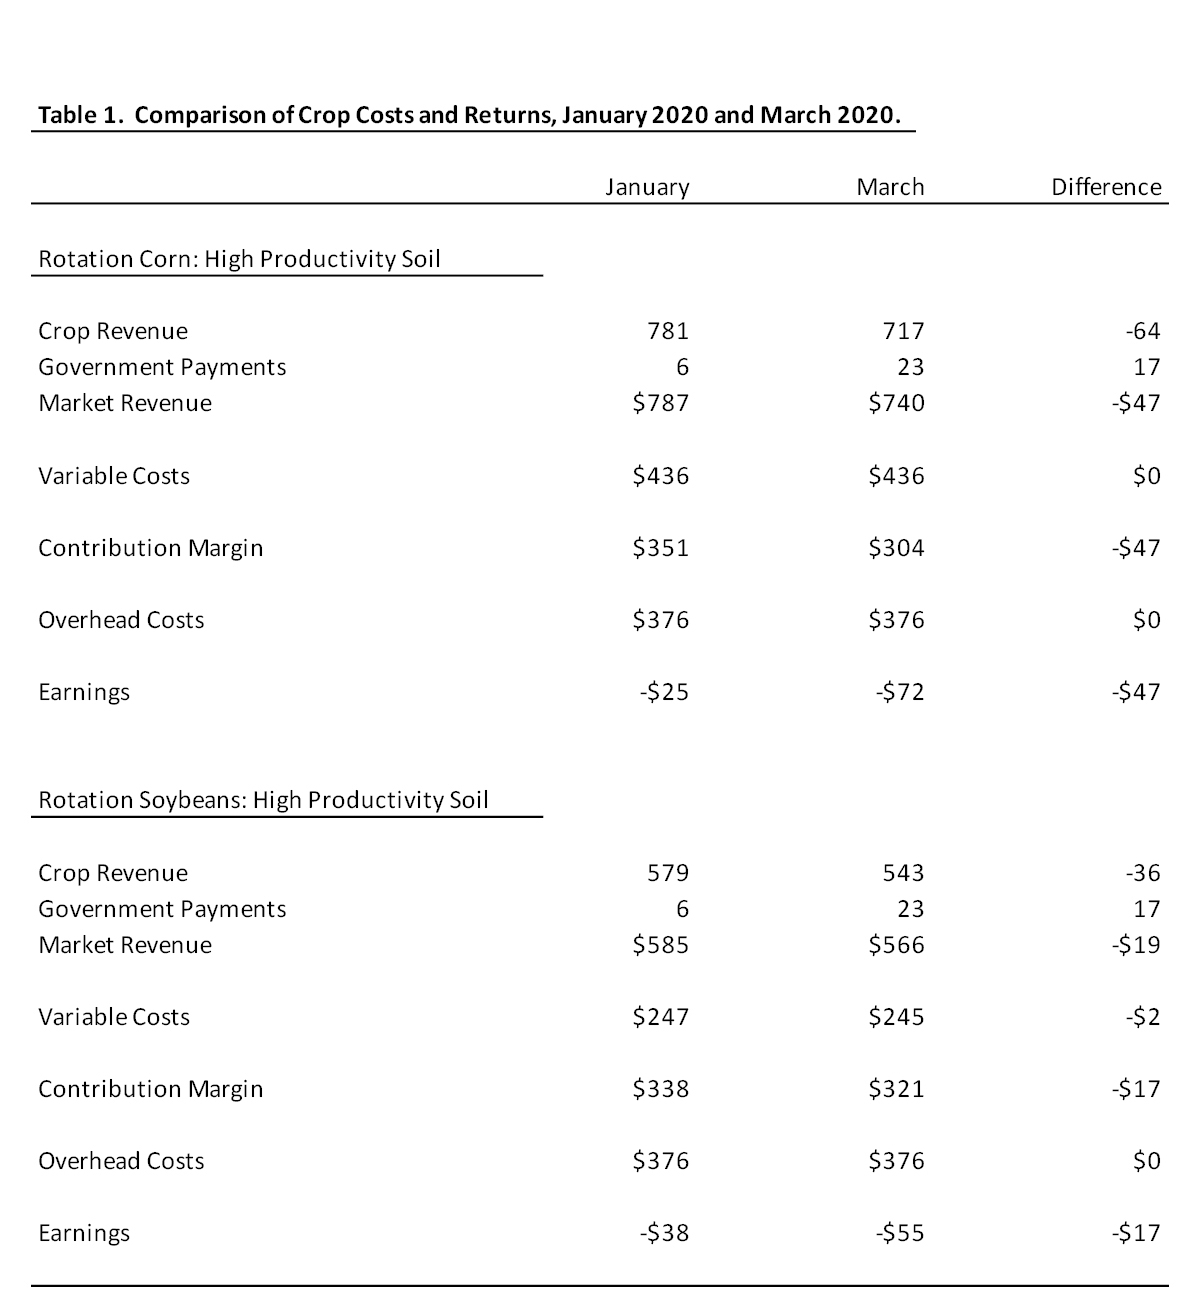
Table 1. Comparison of Crop Costs and Returns, January 2020 and March 2020.
Projected crop revenue for corn and soybeans declined $64 per acre and $36 per acre, respectively, from late January to late March. Table 1 assumes that corn acres were enrolled in the PLC program and soybean acres were enrolled in the ARC-CO program. The drop in crop prices from late January to late March has resulted in an increase in projected government payments per acre for corn and soybeans of $17 per acre. Obviously, the ARC-CO and PLC program only partially mitigate the impact of a drop in crop prices.
Production cost estimates in table 1 are taken from the 2020 Purdue Crop Cost and Return Guide in late January and late March. This publication provides estimated costs for planting growing, and harvesting a variety of crops and is available for free download from the Center for Commercial Agriculture website (here). The guide is updated frequently as grain futures prices change and the costs of inputs, such as seed, fertilizer, pesticides and fuel, fluctuate. Production costs in late March were very similar to the estimates in late January.
The contribution margin for each crop in table 1 is computed by subtracting variable costs from market revenue, which includes crop revenue and estimated government payments. It is important to note that the contribution margin is used to cover overhead costs such as machinery costs, family and hired labor, and cash rent. Earnings are computed by subtracting variable and overhead costs from market revenue. To operate in the short-run, a farm must cover variable costs. In the long-run, a farm needs to be able to cover both variable and overhead costs. Failure to adequately cover overhead costs typically puts downward pressure on cash rent and land values.
The contribution margin and earnings for corn and soybeans dropped $47 per acre and $17 per acre, respectively, from late January to late March. Because production costs are similar between the two periods, the breakeven prices for corn ($3.85 per bushel) and soybeans ($9.55 per bushel) did not change.
Trends in Net Farm Income
Even in late January, net return prospects for crop farmers for 2020 were not very good. The drop in net returns for corn and soybeans during the last couple of months made a bad situation worse. We will use a case farm in west central Indiana to compare projected net farm income per acre in 2020 to net farm income per acre during the last few years. This case farm has 3000 crop acres of which 750 acres are owned. The farm utilizes a corn/soybean rotation, and has solid liquidity and solvency positions.
Figure 1 illustrates net farm income per acre and sources of net farm income from 2007 to 2020. Sources of net farm income include crop net returns, government payments, and crop insurance indemnity payments. The average net farm income per acre during the 2007 to 2020 period was approximately $113. From 2007 to 2013, net farm income ranged from $103 per acre in 2009 to $278 per acre in 2011. Government payments were relatively large in 2018 and 2019. Despite this fact, net farm income per acre in 2018 and 2019 was only $77 and $46, respectively. The projected net farm income for 2020 is -$24 per acre. If this net return materializes, it would be similar to the very low net farm income in 2015, which was the result of a disastrously wet June.
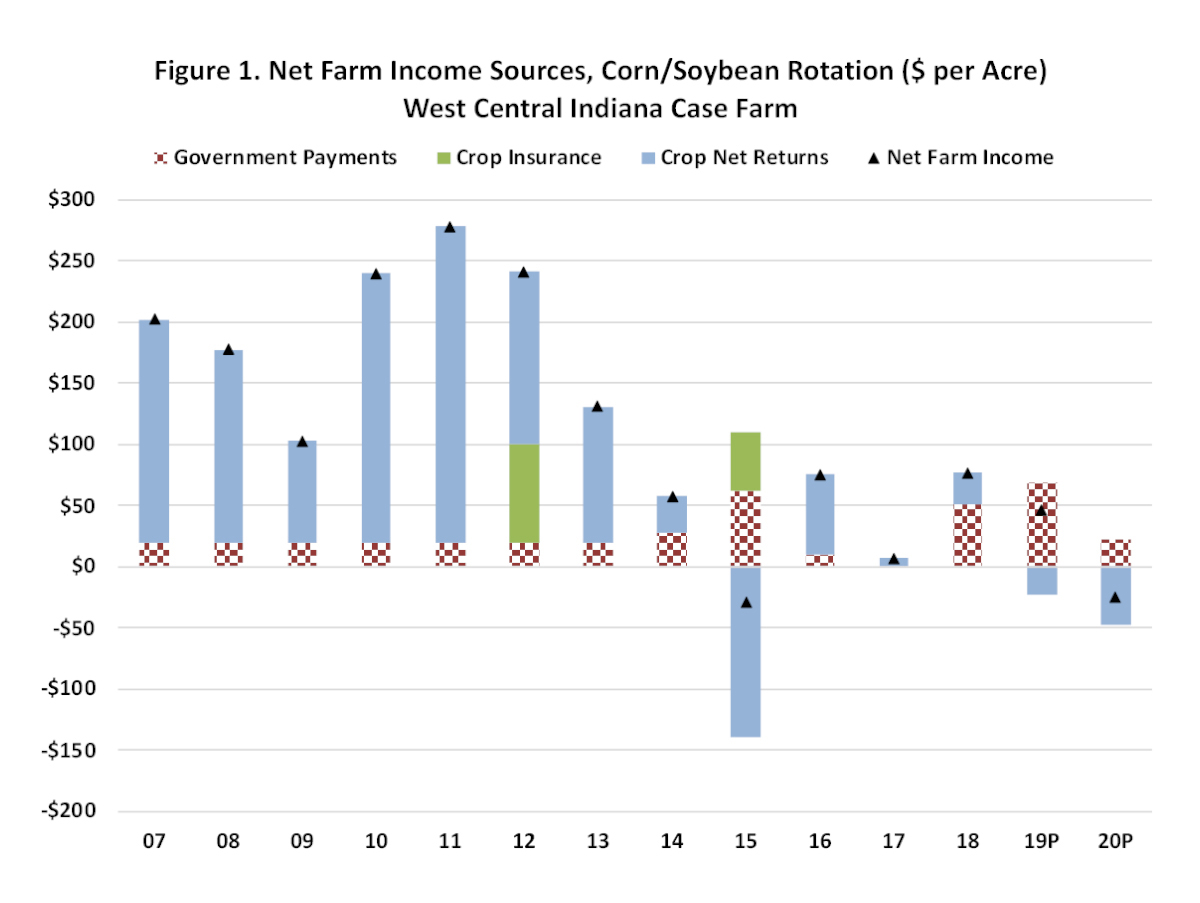
Figure 1. Net Farm Income Sources, Corn/Soybean Rotation ($ per Acre) West Central Indiana Case Farm
Conclusions
In summary, corn and soybean earnings have dropped $47 and $17 per acre, respectively, since late January. As noted in this article, this has made a bad situation worse. Using a case farm in west central Indiana, net income per acre is expected to drop from $77 and $46 per acre in 2018 and 2019 to -$24 per acre in 2020. The ARC-CO and PLC programs provide some protection from downside risk, but they only partially mitigate the impact of the recent drop in corn and soybean prices.
![]()
![]()
![]()
![]()
![]()
