Changing Input Costs and Grain Prices: Implications for Crop Selection and Management
February 18, 2009
PAER-2009-5
Bruce Erickson, Director of Cropping Systems Management; Todd Hubbs, Graduate Student; Alan Miller, Farm Business Management Specialist and Craig Dobbins, Professor
![]()
![]()
![]()
![]()
![]()
With the swings in grain and oilseed prices and with costs for inputs such as fuels and fertilizers varying this year more than their entire price just a few years ago, those planning for 2009 are adapting to a changing playing field and learning to utilize a range of possible inputs and outputs. The Purdue crop bud‑ gets are designed to provide farmers, landowners, and those that do business with them a set of benchmark numbers that can be used as a starting point for developing and refining their own cropping estimates, or to help guide decisions regarding crop selection. The following article details the factors that influence Purdue’s crop budgets, how these factors have changed in recent years, and the implications for management decisions.
Input Costs Still Relatively High
Input costs for 2008 were up around 50% compared to the 2007 crop. Previous cost estimates for the 2009 crop indicated that input costs might raise another 30‑40%, depending on the crop. However, the credit crisis, world economic slowdown, and falling commodity prices have affected the prices of many inputs, especially some fertilizers and fuels. Current projections have rotation soybean input costs up $41/acre or 22%, rotation corn up $45/acre or 12%, and continuous corn up $45/acre or 11% (Figure 1).
Farm Energy Costs Mostly Down Energy costs are highly sensitive to the world supply and demand situation, and at this time appear to be one area where costs will be down for 2009. Diesel prices are forecast by the Energy Information Administration to stay at about the current level of retail prices through the 2009 cropping season, after last year’s exceptionally high prices. Propane was well above $2.00/gallon last fall but is forecast to continue declining in price well into 2009.
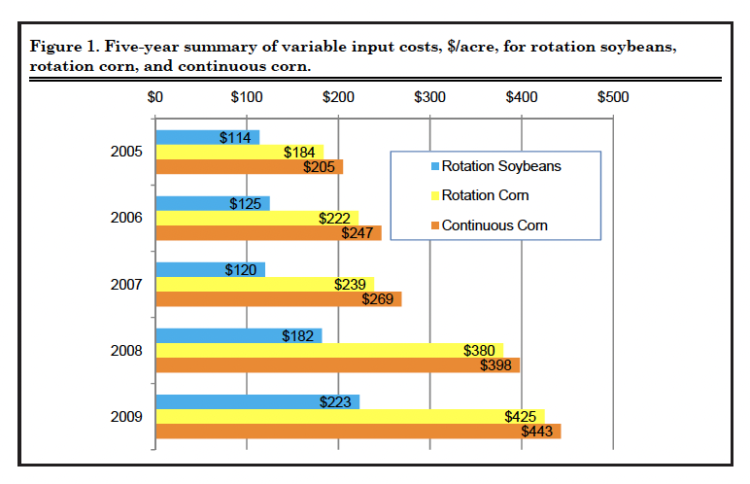
Figure 1. Five-year summary of variable input costs, $/acre, for rotation soybeans, rotation corn, and continuous corn.
Seed Prices Reflect Technology Changes
With more and more traits being developed, farmers will continue to see seed prices occupying a substantial part of their budgets. List prices for most seed companies were announced in early fall and the general trend was sharply up, with some stacked‑trait premier hybrids top‑ ping the $300/unit mark and some soybeans exceeding $50/unit. Actual prices paid by farmers reflect quantity, early order, early pay, customer loyalty, and other discounts which may change depending on market conditions, and our budgets reflect modest increases in seed prices for 2009.
Fertilizer Prices Adjusting After a Wild Ride
Fertilizer prices have been recalibrating as a result of the financial crisis and the corresponding declines in commodity prices. Past USDA reports show that slightly less than half of the nitrogen and potash fertilizers imported into the U.S. for use on the 2008 crop came ashore from July to December of 2007. This past import pattern suggests that at least some fertilizer suppliers in the Midwest purchased significant quantities of fertilizer for the 2009 crop at wholesale prices much higher than current prices. Last summer local retail prices for potash at some locations were over $900 per ton, anhydrous ammonia over $1000 per ton, and DAP in some cases exceeded $1100 per ton. There is wide variation, but Indiana retail prices are now slightly lower for potash, and some nitrogen and phosphorus sources are reported down by one‑ third or more.
The fertilizer market is much different than just a few years ago both from a demand and a supply situation. Increased fertilizer use around the world has resulted in the U.S. consuming a smaller and smaller proportion of world production. Also, while the U.S. continues to dominate phosphorus production and we still import most of our potassium from Canada, more than half of the nitrogen used in the Midwest now comes in from other parts of the world, especially where natural gas is inexpensive. Last summer’s huge price run‑up was fueled largely by unprecedented demand spurred by high crop prices, but also by supply limitations in fertilizer production. A handful of companies produce most of the world’s phosphorus and potassium. Investments in fertilizer manufacturing and transport are often very long‑term commitments, and companies may not react to short‑term market conditions.
Crop Inputs Have Changed Over Time
While variability in the costs of crop inputs has been the most recent news, the longer‑term trend shows some fundamental shifts in where the money goes for inputs. Crop protection dollars have been moving away from chemicals and toward seeds, especially in continuous corn. Fertilizer costs are also a growing percentage of input costs for both corn and soybeans. In 2009 fertilizer and seed costs accounted for 63% of the total input costs for corn and soybean production, up from 50‑55% just four years prior (Table 1). The Purdue Crop Cost & Return Guides assign phosphorus and potassium costs to both corn and soybeans based on nutrient removal by those crops, regardless of applications made.
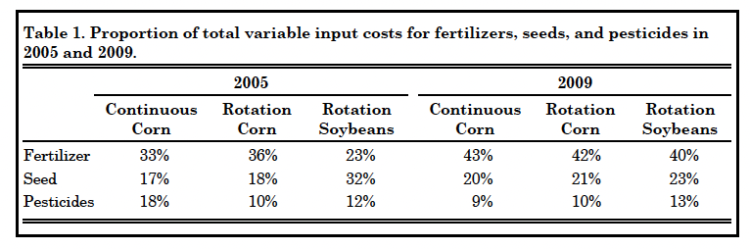
Table 1. Proportion of total variable input costs for fertilizers, seeds, and pesticides in 2005 and 2009.
Contribution Margins Down from 2007 and 2008
Contribution margins in the Purdue Crop Cost & Return Guide are based on expected market revenue minus estimated variable costs, and do not include land, machinery replacement, family or hired labor costs. Harvest prices are calculated from December futures for corn and November futures for soybeans minus an estimated basis. These values will certainly change with time and will be different for each operation. The relative contribution margins of corn vs. soybeans are often used by growers to help them decide their mix of crops for the upcoming year. In some past years, contribution margins have strongly favored corn, in other years soybeans. This year contribution margins are similar for rotation corn and soybeans (Table 2).
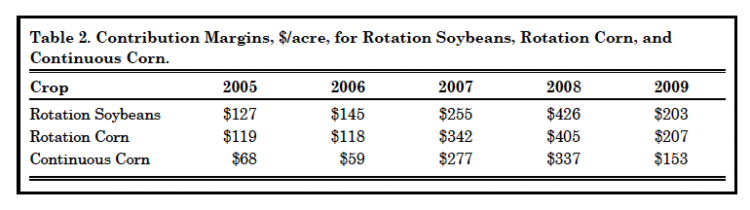
Table 2. Contribution Margins, $/acre, for Rotation Soybeans, Rotation Corn, and Continuous Corn.
Margins Sensitive to Variation in Input Prices Paid
When margins are lower, differences in prices paid for inputs can have a greater impact on the percentage of revenue left over after paying variable costs. This year’s range of fertilizer prices paid by farmers is significantly affecting the bottom line. Fertilizer costs have become one of the largest expenses of producing a crop. For corn production, fertilizer costs can exceed land rental charges in some instances. Figure 2 shows the sensitivity of contribution margins to a range of anhydrous ammonia prices and corn market prices. With ammonia above $900 per ton, contribution margins can drop below $200 per acre if corn prices are below $4.00. In many farm situations, this leaves little or negative earnings after considering land costs, labor, and machinery overhead.
Fertilizer Costs Can Influence Crop Choice
With fertilizer costs so influential in contribution margins, differences in prices paid could influence crop choice. Tables 3 and 4 portray the contribution margin differences between corn and soybeans at a range of market prices for those crops. Since these numbers are the contribution margin of rotation corn minus the contribution margin of rotation soybeans, a positive number indicates that corn provides a better return, and a negative number indi‑ cates that soybeans provide the best return. At a lower fertilizer price (Table 3), $4.00 corn and $9.00 soy‑ beans would favor corn production. At a higher fertilizer price (Table 4), the same corn and soybean prices would favor soybeans.
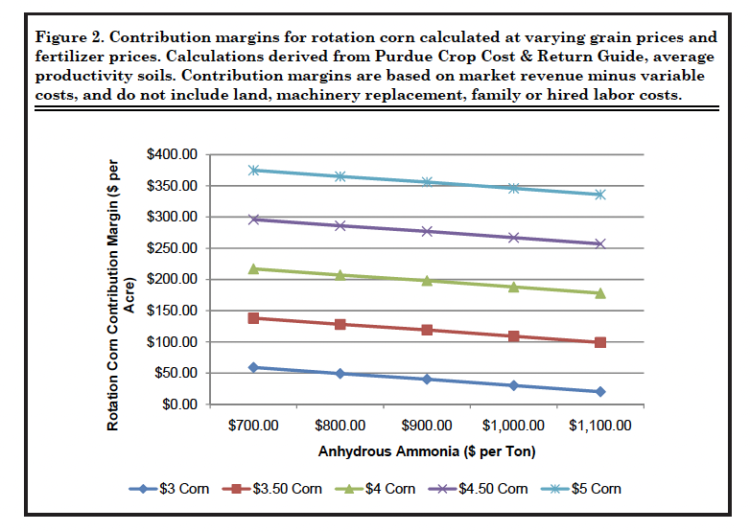
Figure 2. Contribution margins for rotation corn calculated at varying grain prices and fertilizer prices.
Calculations derived from Purdue Crop Cost & Return Guide, average productivity soils. Contribution margins are based on market revenue minus variable costs, and do not include land, machinery replacement, family or hired labor costs.
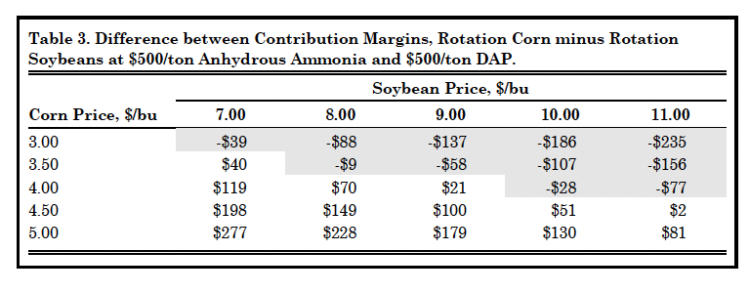
Table 3. Difference between Contribution Margins, Rotation Corn minus Rotation Soybeans at $500/ton Anhydrous Ammonia and $500/ton DAP.
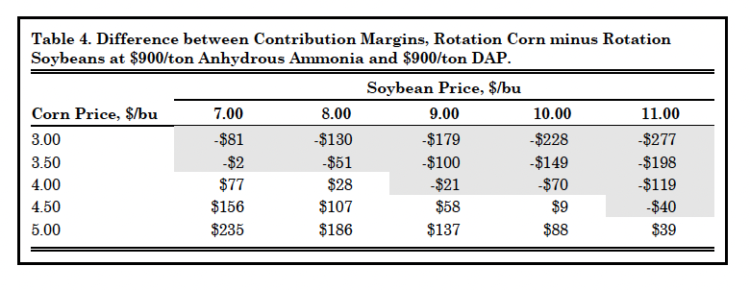
Table 4. Difference between Contribution Margins, Rotation Corn minus Rotation Soybeans at $900/ton Anhydrous Ammonia and $900/ton DAP.
Summary
While input costs for the 2009 crop are generally down from earlier projections, they remain up from the 2008 crop. With grain prices having come down from last summer’s highs, contribution margins this year are projected to be lower than for 2007 and 2008. Fertilizer costs occupy a higher proportion of variable input costs than in past years, and this year’s smaller margins mean that the differences in prices paid for fertilizer can have a greater impact on returns. The Purdue crop budgets can provide some help in suggesting adjustments to a cropping program, but a better tool is the development of budgets for your particular situation.
![]()
![]()
![]()
![]()
![]()
