China: Future Customer or Competitor in Livestock Markets?
December 13, 2000
PAER-2000-21
Thomas Hertel, Professor; Alejandro Nin, Graduate Research Assistant; Allan Rae, Professor at Massey University; and Simeon Ehui, Economist with the International Livestock Research Institute
![]()
![]()
![]()
![]()
![]()
China’s future role in inter-national agricultural trade continues to be a puzzle. Part of this puzzle, namely that related to grains, has received far more attention than has livestock trade, which has been relatively neglected. China is a net exporter of livestock products, although over the last two decades imports have been increasing faster than exports. Figure 1 shows the time path of net exports (exports – imports) of meat, essentially poultry meat and pork, presented as a fraction of total non-ruminant meat trade (exports –imports) from 1965 to 1997. Fore-casts from 1997 to 2005 (discussed below) are also shown. The trend is clear. The decrease of net exports as a proportion of total trade reflects a steady deterioration of China’s comparative advantage in pork and poultry production. This begs a further question: Will China eventually become a net importer of livestock products?
The Organization of Economic Cooperation and Development (OECD) projects that China will be a major net importer of poultry meat by 2005. In contrast, the International Food Policy Research Institute (IFPRI) projects an increase in China’s net exports of poultry meat in the coming decades. Resolving this controversy requires examination of the forces underpinning change in consumption patterns in China, as well as the structural changes that have been occurring in China’s live-stock industry (Figure 2).
Rising Demand for Livestock Products
The changing patterns of food consumption in Asia are now well documented. Rapid increases in household income, with urbanization, foreign investment, and marketing have combined to shift consumption toward non-traditional cereals and value-added products, including many derived from live-stock. As a consequence, meat consumption in China has risen from 13.4 kg per person in 1980 to 41.2 kg per capita in 1995 – an increase of more than 200.0 percent! This rapid growth in meat consumption helps explain the increase in meat imports. In 1991 China became a net importer of poultry meat, and by 1995 China was the world’s third largest poultry meat importer. Research suggests that this increase in meat consumption will continue until 2020, when meat consumption will reach 60 kg per capita.
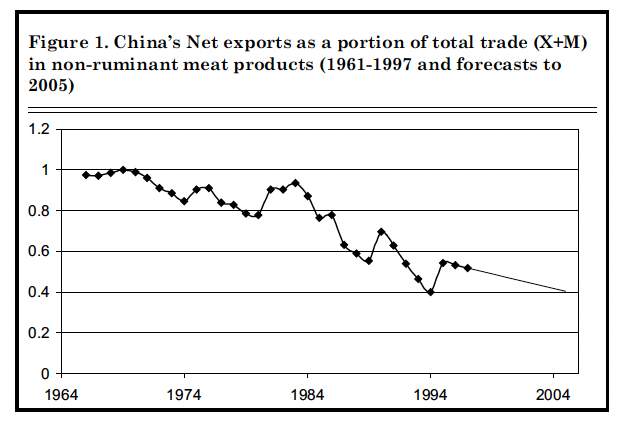
Figure 1. China’s Net exports as a position of total trade (X+M) in non-ruminant meat products (1961-1997) and forecasts to 2005
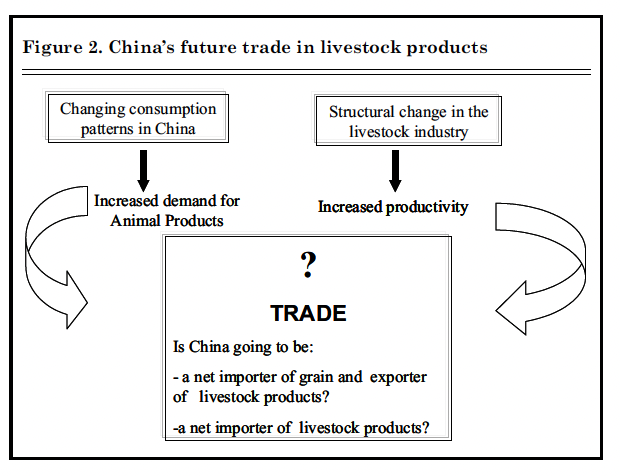
Figure 2. China’s future trade in livestock products
But Supply is also Growing
Even with the growth in domestic demand for meat products, China’s gross exports have continued to increase – but at a somewhat slower pace than imports. An analysis of the supply-side helps square this with the increase in consumption. Figure 3 shows the evolution of China’s non-ruminant production since 1961. Pork, the most important source of animal protein in China, is the most important contributor to increased output. China is now the world’s largest producer of animal protein foods, with pork output growing at an average annual rate of 7 percent since the early 1980s. The 1990s showed an increase in the importance of poultry production with 12 percent annual growth rates between 1980 and 1995, giving a cumulative increase of 485 percent over this period.
This rapid expansion of meat pro-duction has been possible because of the structural transformations that expanded private plot sizes, specialization among household production units, increased foreign investment, and on expanded domestic feed industry. Chinese authorities have also played a role by actively promoting poultry production because these animals are more efficient feed converters than hogs, cattle, and sheep.
Output gains have been fueled by increased productivity
In general, there are two sources of productivity growth: technical change and “catching up.” The first relates to advances in the technologies used by the world’s most advanced livestock production facilities. Finding still more productive technologies is usually described as shifting the “technological frontier.” Catching up, the second source of technical change, stems from an improvement in a country’s efficiency that moves it toward the frontier. Catching up can be measured by rate at which producers adopt known technologies, closing the gap between them and the world’s most efficient producers.
If China’s productivity is growing at the same rate as the growth in the technological frontier, China is not catching up—the ratio between China’s productivity and the world’s productivity remains the same. If China’s productivity growth is greater than expansion in the frontier, then China is incorporating new technologies and increasing its relative efficiency: China is catching up to the frontier.
Figure 4 shows the source of productivity growth (output per head of inventory) in China’s pig and poultry industries. Historical growth is reported from 1976 to 1997 and is projected from 1997 to 2005. Productivity growth is represented by a cumulative index. If, for example, productivity grows by 20.0 percent in 1978 and 5.0 percent in 1979, the cumulative productivity index for the two years is calculated as [1.2*1.05]=1.26, or 26.0 percent. Figure 4A shows that the rapid productivity growth for pigs since the 1980s is largely due to “catching up.” The overall frontier, established by the most productive countries in the world, shows little change, whereas productivity in China grew at an average annual rate of 5.4 percent between 1978 and 1997. Based on the productivity forecast out to 2005 (also in Figure 4A), we expect that catching up will continue to explain most of the productivity growth in China’s pig production in the next five years.
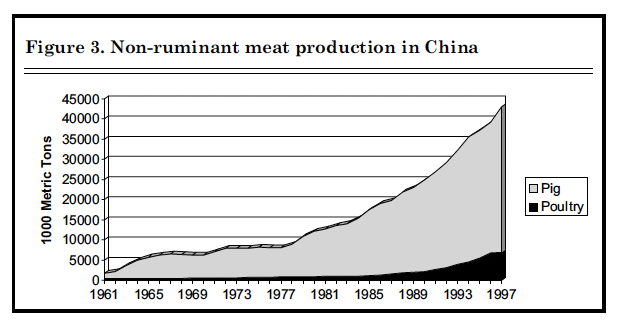
Figure 3. Non-ruminant meat production in China
The composition of growth in out-put per head in China’s poultry sec-tor is quite different. Figure 4B shows that China’s poultry productivity experienced very little catching up until the 1990s. However, there is a sharp upturn in relative efficiency at the end of the period. Poultry pro-duction in China has been catching up at a remarkable pace (more than 6.5 percent per year) since the early 1990s. This growth in the relative efficiency of China’s poultry sector will likely continue.
The combination of catching up and technical change is expected to result in poultry output growth rates continuing to exceed those for pigs. Modernization of China’s pig sector began about a decade earlier than was the case for poultry, so efficiency gains are still possible, but they will come at a slower rate than in the poultry sector. The projected annual rate of catching up in poultry production is about 7.5 percent compared to about 3.3 percent for pig production. The technological frontier for the poultry sector also appears to be more dynamic than for pigs. Technical change in poultry production is forecast to grow at about 3.1 percent per year compared to about 1.5 per-cent annually in pig production. All things considered, the 11.0 percent annual rate of growth in poultry productivity between 1995 and 2005 is projected to be more than double the 4.9 percent annual rate of growth in pig productivity.
2005: Exporting or Importing Meat?
Examination of the supply and demand-sides of China’s livestock puzzle allow something to be said about the future of China’s trade. Caution is important since China’s income and productivity growth are only part of the story. Other countries’ productivity will also be increasing. Furthermore, other sec-tors in the Chinese economy will be experiencing technological change, and they will compete with livestock production for scarce labor and capital. These other effects can be recognized by combining the supply and demand projections into a modified version of the Global Trade Analysis Project (GTAP) model of the world economy. This global general equilibrium model captures developments in both the farm and non-farm economies as well as simultaneous changes in bilateral trade. The model uses projections of the labor force, investment rates and income growth simulated forward from 1995 to 2005. It also takes into account the productivity forecasts shown in Figure 4.
According to our forecast, China’s imports will nearly double over the decade from 1995 to 2005. However, exports will also increase so that China will still be a net exporter of non-ruminant meats (essentially poultry meat and pork), slightly increasing the balance of trade sur-plus from $1.6 million in 1995 to $1.7 million in 2005. The importance of imports in total trade will continue to increase – from about 30 percent to almost 45 percent of exports by 2005. Net exports as a share of total trade will continue to decline under these forecasts (Figure 1).
The model used to estimate productivity also provides information about possible errors in the forecasts. This information leads to a distribution of possible increases in productivity in each sector. These range from 109-135 kg/head for pork and 4.9-6.2 kg/head for poultry. The potential impact on China’s net trade in 2005 was developed by running the model again, sampling from this distribution of possible livestock productivities. The range of trade balance outcomes are displayed in the first part of Figure 5. The trade balance for non-ruminant products might be as high as $+3.6 million or as low as $-48.0 million dollars. The possibility that China will be a net importer of non-ruminant products in 2005 cannot be ruled out, although continuation of net exports is the most likely outcome.
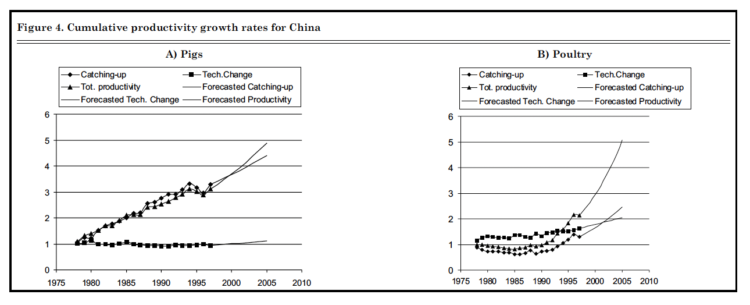
Figure 4. Cumulative productivity growth rates for China, A) Pigs B) Poultry
The Asian financial crisis, has made economists pay increased attention to macro-economic uncertainty. What would happen if growth of non-livestock productivity slows, and as a consequence incomes rise more slowly? The net trade position in meats is very sensitive to this. An economy-wide slowdown will affect livestock trade on both the supply and the demand sides. Lower income growth obviously reduces domestic demand, and lowers the need for imports. In addition, lower productivity growth in the non-agricultural sectors means less competition for labor and capital. Wage costs and interest rates facing livestock producers would be lower under a slow-down scenario. This translates into enhanced supply and further erosion of the need for imports. On the other hand, rapid growth in the non-livestock economy has the oppo-site effect. By fueling income growth, meat demand is also increased. Meanwhile, the competition with other sectors for inputs also intensifies. All things considered, the rate of productivity growth in the non-livestock sectors of the Chinese economy plays a key role in deter-mining the livestock trade balance. The range of trade balance estimates in the second part of Figure 5 (-$1,586 mill. to +$5,035 mill.) underscores this point. This range is based on only small changes in China’s overall growth rate—from a low 5.9 percent per year to a high of 6.9 percent per year. Yet even this modest degree of macro-economic uncertainty is sufficient to generate greater uncertainty in China’s non-ruminant trade balance than that resulting from uncertainty in the livestock sector itself!
Uncertainty is also introduced by China’s pending accession to the World Trade Organization (WTO). While this development is not formally reflected in our projections, it is clear that it will have implications for China’s trade balance. Meat imports into China are currently con-strained by many tariffs in the 20 percent to 45 percent range, along with import licensing requirements. Under the US-China Bilateral Agreement, China is committed to establish a tariff-only import regime for meats and dairy products, and all WTO-inconsistent non-tariff barriers must be removed. The Agreement also requires reductions of up to 70 percent in tariffs on some frozen meat cuts. Foreign enterprises will be permitted to engage in the full range of distribution services within China, and China has also agreed to abide by the WTO Sanitary and Phytosanitary measures. Such reforms of China’s meat import policies would, by themselves, encourage increased imports of meats that would likely reduce China’s net exports.
The growth in consumption of livestock products in China over the past 20 years has been explosive. Many producers in North America and elsewhere are watching this development, and hoping to claim a share of the China market sometime in the future. This view ignores the supply-side of China’s meat products industry. Fueled by strong productivity growth, pork and poultry output in China has been growing rapidly. The outcome of this race between demand and supply for meats will have a great impact on world markets in the coming decade. China could become the world’s largest meat importer – or she could prove to be a fierce competitor, exporting to Asia’s rapidly growing markets.
Our analysis of past productivity performance in the Chinese pork and poultry sectors is an aid that serves as a basis for forecasting future developments in the livestock sector. Having started the modernization process a decade earlier, pork productivity is already at 60 percent of North American levels. On the other hand, poultry productivity in China is only 30 percent of that in North America. However, poultry output per head is accelerating. We project poultry productivity to grow by 11 percent per year out to 2005. This growth will be insufficient to offset fully the projected growth in demand, so China’s trade balance in meats will likely continue to deteriorate. However, our base case analysis shows China remaining a net exporter of non-ruminant meats in the medium run.
Our analysis of potential uncertainties, both in the livestock and non-livestock economies of China, shows that the nation’s net trade position is very sensitive to these fac-tors. If livestock productivity growth is at the high end of possible out-comes, and if there is a slow-down in the rest of the economy, China could become a fierce competitor in export markets by 2005. On the other hand, slower than expected diffusion and adoption of livestock technology cou-pled with a rapidly growing macro-economy could fulfill the dreams of those who see China as a major future market for their meat exports.
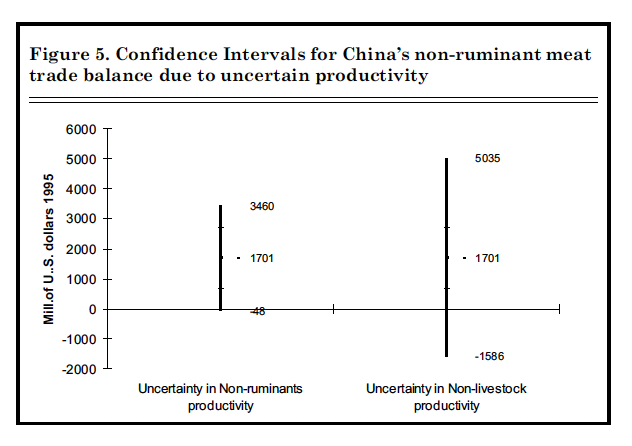
Figure 5. Confidence Intervals for China’s non-ruminant meat trade balance due to uncertain productivity
![]()
![]()
![]()
![]()
![]()
