Comparing Your Farm’s Labor Performance
August 17, 1995
PAER-1995-12
Alan Miller, Extension Specialist
![]()
![]()
![]()
![]()
![]()
Comparative information on labor cost and efficiency can provide individual producers with a useful perspective for evaluating the performance of their own farm businesses. However, care must be exercised to make sure that the comparative data is really comparable. Efficiency measures typically are expressed as ratios, such as the value of production per man or net income per hour of unpaid labor. These vary widely from farm to farm due to the influence of factors that include, but definitely are not limited to, how well the farms per-formed.
Producers are concerned about questions such as:
➤ Am I paying my employees too much for my costs to be competitive?
➤ Am I paying enough to keep my best employees?
➤ Do I have too much or too little help?
➤ Can I justify wages that I know are high, because my employees are more productive?
Comparisons with farms that are very similar with respect to the types of enterprises and the product mix will be more meaningful in terms of putting nagging labor management questions like these in perspective.
Table 1 presents selected labor cost and efficiency measures found in the published record summaries of the Illinois FBFM program for 1994 (or computed using that information). The data presented comes from pure grain (field crops only and no livestock), pure hog and pure dairy farms and shows the average value of the selected measure for all the farms in each farm size-type category. This data demonstrates the affect that farm type, farm size and geographic region can have on the efficiency measures.
Value of farm production (VFP) equals gross farm operating revenues net of livestock and feed purchases. VFP will be a considerably smaller dollar amount than gross revenues on many livestock farms. VFP is a measure of the dollar value of farm output that is used to enhance the comparability of revenues between farms and farm types. As Table 1 shows, labor productivity, as measured by VFP, is typically higher on grain farms than on live-stock farms. Labor productivity typically increases as farms of a particular type in a particular region get larger. Across geographic regions other factors, such as differences in climate and soil productivity, will come into play and the typical relationship between farm size and labor productivity may not hold. For example, labor productivity was lower on the Southern Illinois pure grain farms summarized in Table 1 despite the fact that these farms were larger on the average than their Northern Illinois counterparts.
Labor productivity obviously wasn’t a key factor determining hired labor cost per hour. The cost of hired labor was highest on the hog farms. The table also shows that the efficient use of farm labor resources, as evidenced by total labor cost and total labor hours per producing unit (acre, sow, cow) may be a real problem for relatively small livestock farms. Productive labor is often associated with more profitable farms. A close examination of the pure hog farm averages in Table 1 confirms that this is not always true. This is evidenced by the fact that net income per hour of unpaid operator and family labor was negative for the over 250 litters category.
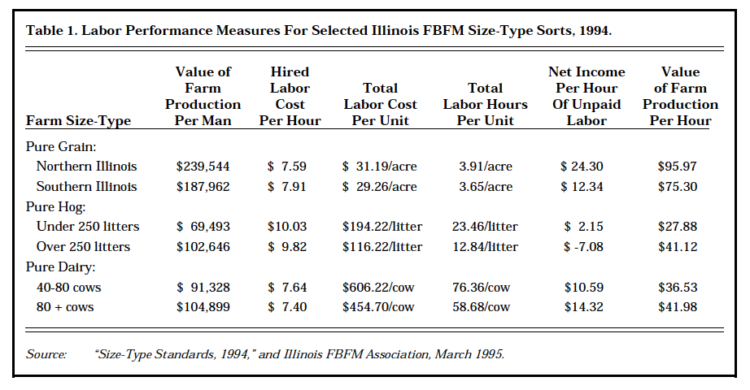
Table 1. Labor Performance Measures For Selected Illinois FBFM Size-Type Sorts, 1994
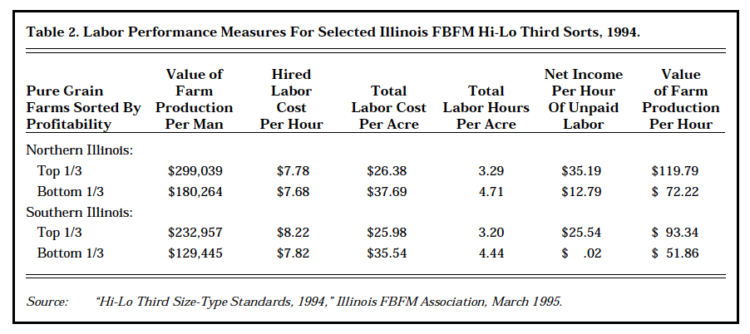
Table 2. Labor Performance Measures For Selected Illinois FBFM Hi-Lo Third Sorts, 1994
Table 2 compares the averages for the most profitable (top 1/3) and least profitable (bottom 1/3) farms included in the Northern and South-ern Illinois pure grain farm averages that are summarized in Table 1. Table 2 illustrates the extent to which the selected efficiency measures can vary with profitability on farms that may otherwise be very similar. Both the value of farm pro-duction per hour of labor and the net income per hour of unpaid operator and family labor are enough higher on the top 1/3 of the farms that they should be able to compete more effectively for available labor than their less profitable counterparts.
Comparison of an individual farm’s labor performance to the averages for a group of comparable farms can help to put that performance in perspective. However, it is important to recognize that in a rap-idly changing industry, such as the hog industry, these averages may not be at all indicative of the efficiency a farm will have to achieve during the next few years in order to stay competitive.
![]()
![]()
![]()
![]()
![]()
