Corn and Soybean Storage Returns in a Wild Decade
June 15, 2017
PAER-2017-08
Author: Chris Hurt, Professor of Agricultural Economics
The past decade was a wild price ride! The boom began in the fall of 2006 with nearby corn futures at $2.25 per bushel. The first wave of the boom took nearby corn futures to a high of $7.65 by June 2008. Then the U.S. and world economies fell into a deep recession with a financial and housing crisis in the U.S. in late 2008 and 2009. Nearby corn futures fell to $3.00 a bushel in late 2008 and at times in 2009. Then the second boom began in late 2009 moving nearby futures from $3 to the ultimate high near $8.50 during the drought of 2012. Prices then generally moved lower in 2013, 2014, and 2015 as increased production replenished depleted world inventories.
Given the wide price swings of the past decade what was the impact on storage returns? In an attempt to answer that question this article will estimate the speculative storage returns by year, and on average, over the past decade for a central Indiana farm.
What does “speculative” storage returns mean? It is assumed that the farm operator puts grain in storage at harvest and hopes prices will rise by more than storage costs through the storage season. This is among the simplest pricing strategies and is probably the most frequently used strategy among Midwest farm managers.
The word “speculation” is used to indicate that the grain is unpriced while it is in storage. Therefore, it will become more valuable if cash prices rise, or less valuable if cash prices decline during the storage season. Returns are estimated for both “on-farm” and “commercial storage” like at a grain elevator that is licensed to store farmers’ grain.
How Returns Were Calculated
Price bids were collected each Wednesday evening from a central Indiana grain elevator that can ship unit trains to the Southeastern U.S. They are also a federally licensed grain warehouse and provide storage for farmers. Weekly bids were collected for the 10 marketing years in the study. The marketing year for corn and soybeans begins in September and extends through the following August. The first marketing year in the study was the 2006/07 marketing year that spans the 12 months from September 2006 through August 2007. The final marketing year was 2015/16 representing the crop harvested in the fall of 2015 and marketed through August 2016. At the time of writing, this was the most recent marketing year for which all data was available.
It was assumed that corn harvest prices were the last two weeks of October each year. For soybeans, it was assumed that the first two weeks of October was the harvest price. On-farm storage and commercial storage costs were added to the harvest price. Interest costs were added weekly to both on-farm and commercial storage. Yearly interest rates were at the six-month certificate of deposit rate or the prime rate whichever was higher. For the 10 year data period, the average of the annual interest rates was 3.55%. In the case of commercial storage, elevator charges were added as well. These were a flat charge for use of storage until January 1, and then a monthly charge starting in January. Over the 10 year period, the average flat charge was 17 cents per bushel and then 3 cents per bushel per month starting in January.
The question being asked is, “are cash bids each week during the storage season high enough to cover the harvest value plus accumulated storage costs up to that point? Returns to on-farm storage were calculated as the weekly bid price minus the harvest price plus accumulated interest cost. For commercials storage, returns were calculated as the weekly bid price minus the harvest price plus accumulated interest and commercial storage charges.
On-farm storage returns reported here are actually a gross return since the costs of grain facilities and operation costs are not included. The on-farm returns are a return for the investment and costs to operate the grain system. It is important to note this difference between on-farm and commercial storage returns. The commercial storage fees at a grain elevator cover their costs for bins, grain handling equipment, labor, shrinkage, grain loss, and insurance. In this study, these costs are not charged for the on-farm storage situation. So, if the gross returns to on-farm storage were 40 cents per bushel per year this means that the farm manager is receiving 40 cents per bushel per year for the ownership costs of the on-farm storage system and for the labor and management costs of that system.
Corn Storage Returns
The past decade was a volatile period with wide price swings. This likely means that gross speculative storage returns were highly variable depending on price movements in each marketing year.
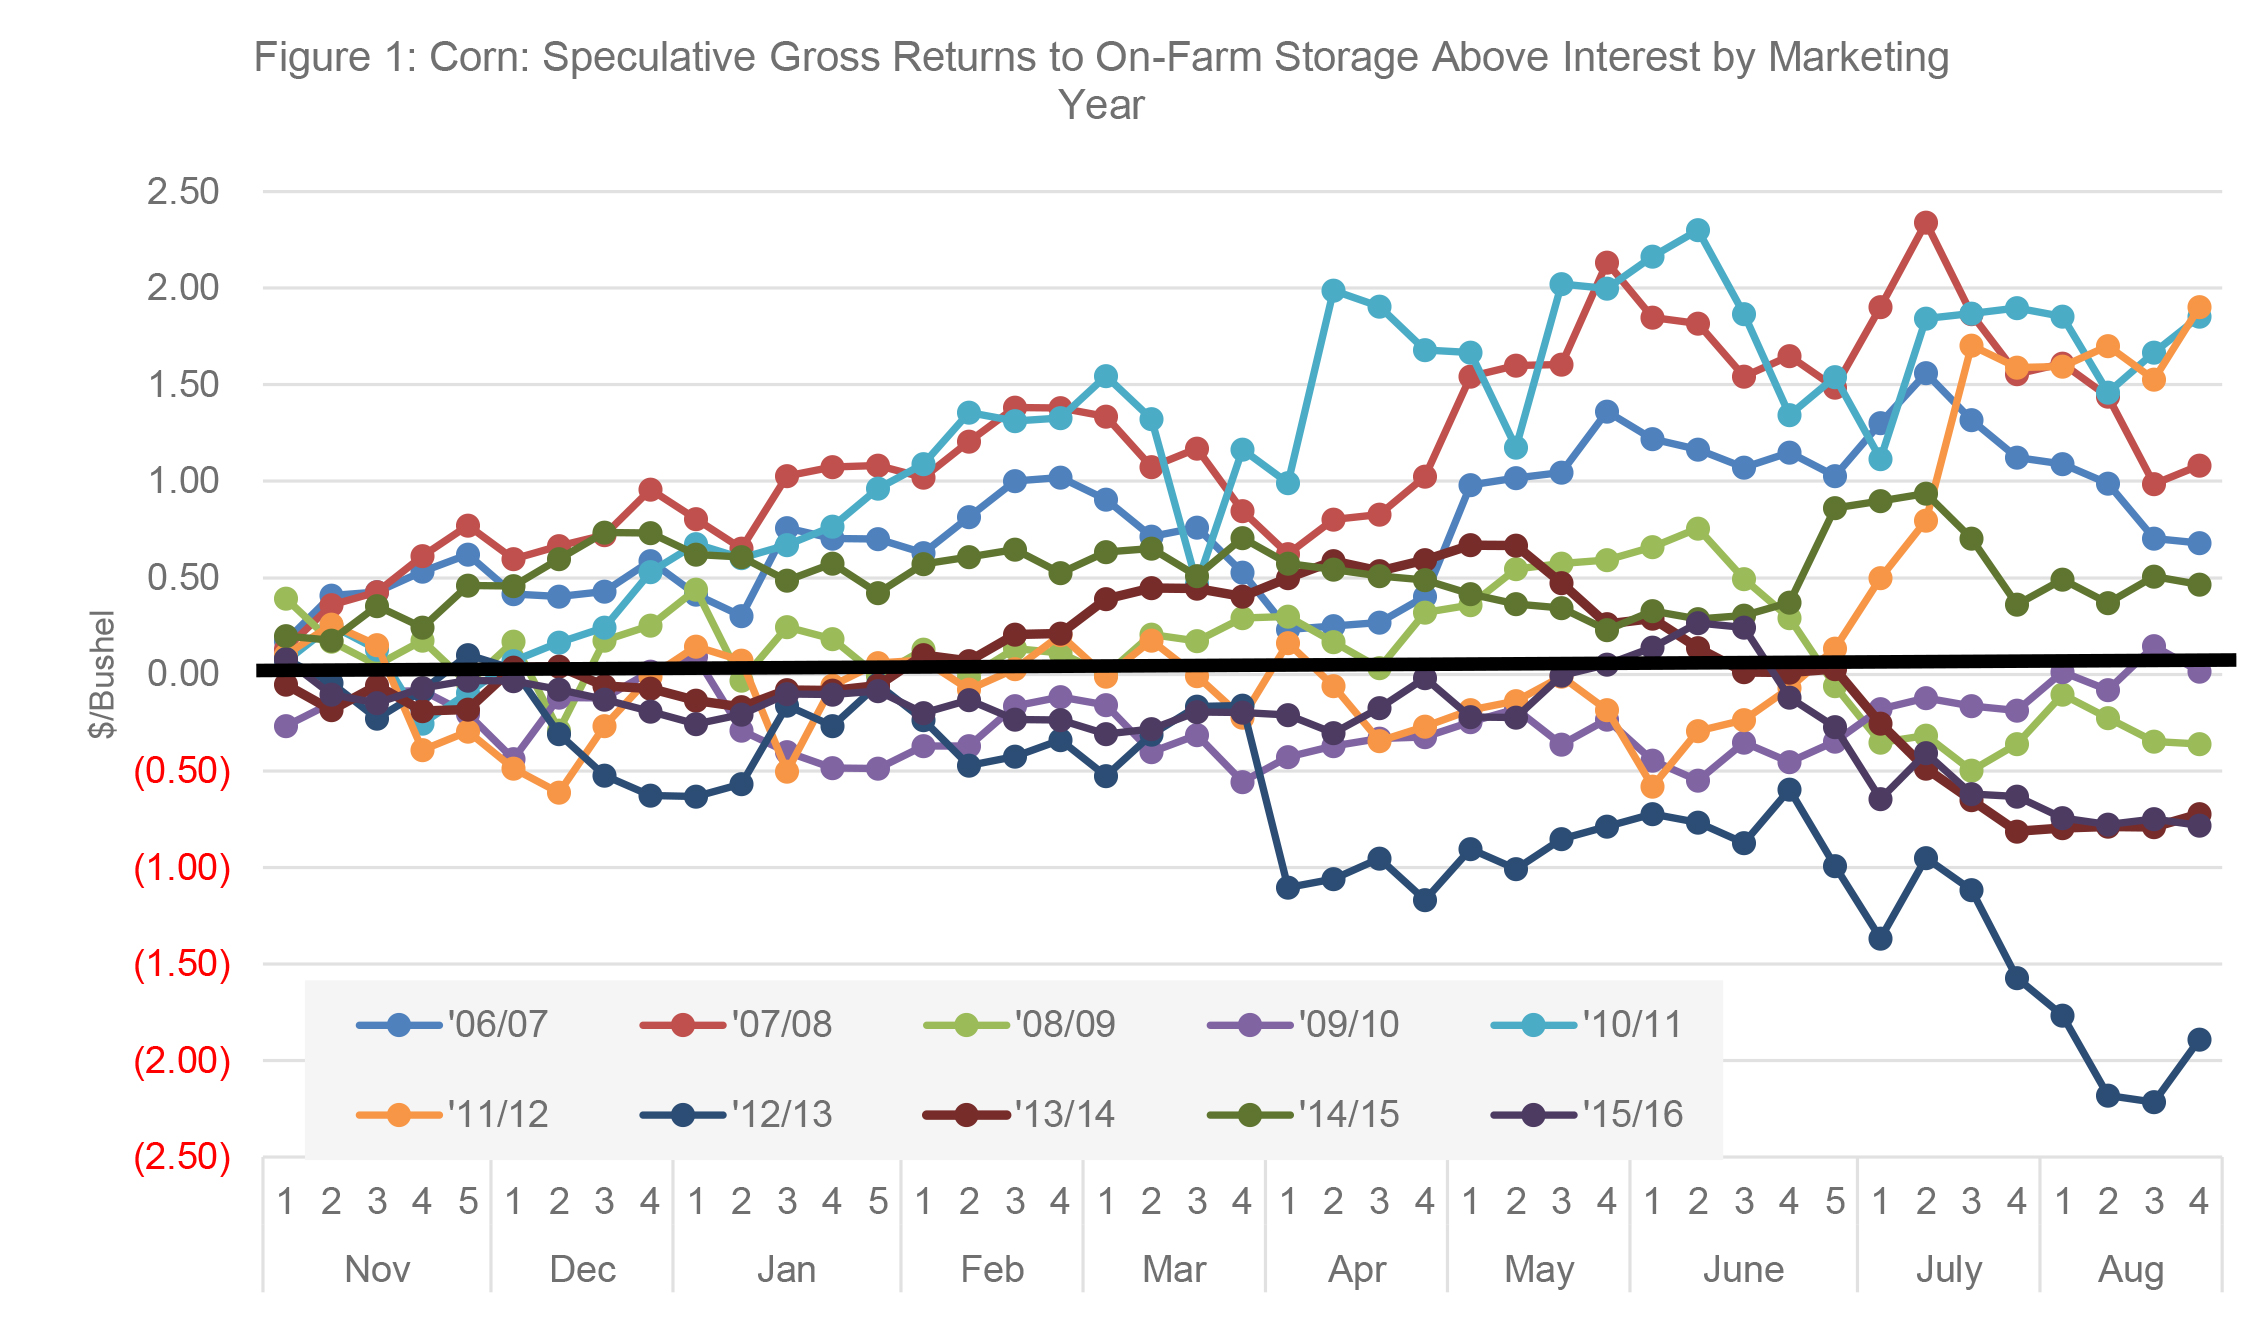
Figure 1 shows those gross returns for on-farm storage by marketing year. The horizontal axes represents weeks of the storage season. Remember that harvest price was considered to be the last two weeks of October, so the first week of November is the first week for which the gross storage returns are calculated. Those extend to the end of August the following summer. Each month has at least four weeks, or sometimes 5 weeks.
The vertical axis is the gross storage returns per bushel above interest. Note the 0.00 line. Observations above this point are positive returns and observations below are negative returns or losses.
The range of gross storage gains or losses is remarkable. In some years speculative gross return for on-farm corn storage gains were over $2 per bushel and in one year were over $2 per bushel of loss. This is even more remarkable when considering that the average U.S. farm price of corn for the previous decade covering the 1996 to 2005 crops was only $2.15 per bushel.
This figure also points out that speculative return risks or uncertainty tends to increase with the length of storage time. This can be seen by observing how results for the 10 years are more tightly clustered for storage into winter, through March as an example. Then, especially starting in April and extending through storage to August, the results tend to have increasing variability.
Why does this occur? There is an increasing amount of new information influencing prices as more time passes after harvest. During the wintertime, the size of the fall harvest is reasonably closely estimated by USDA. Markets are learning about the demand structure, but demand generally does not have as much volatility as supply. As late winter and spring approach, there is new information coming to the market regarding South American production and the anticipation of the U.S. planted acreage for the next crop and the potential for U.S. production. Then as the spring and summer progress, much more information becomes known about the size of the U.S. and other Northern Hemisphere crops.
As new information comes to the market there is some randomness to this information if viewed over a number of years as in the 10 years shown here. Randomness simply means that in some years the majority of the new information is bullish and causes prices to overall rise, and in some years the new information tends to be bearish and results in a tendency for overall lower prices.
Two examples will make this last point. On the high return side, one of the years that provided a $2 per bushel positive return to storage was the corn harvested in the fall of 2011. That was the 2011/12 marketing year. By the late summer of 2012, drought had set in and corn prices rose sharply providing the $2 speculative gross return to on-farm storage.
The $2 loss per bushel was the next year 2012/13. In the fall of 2012, prices were record high as corn usage from the tiny 2012 drought crop had to be cut back. At our elevator, cash prices at harvest in 2012 were $7.67 per bushel. However, the 2013 yields returned to normal and a record size crop was seen by August with cash prices dropping to about $5.60 by August of 2013.
A final observation is that a number of the 10 years were unprofitable with negative gross margins. Generally, three or four years out of 10 had negative gross margins for most weeks.
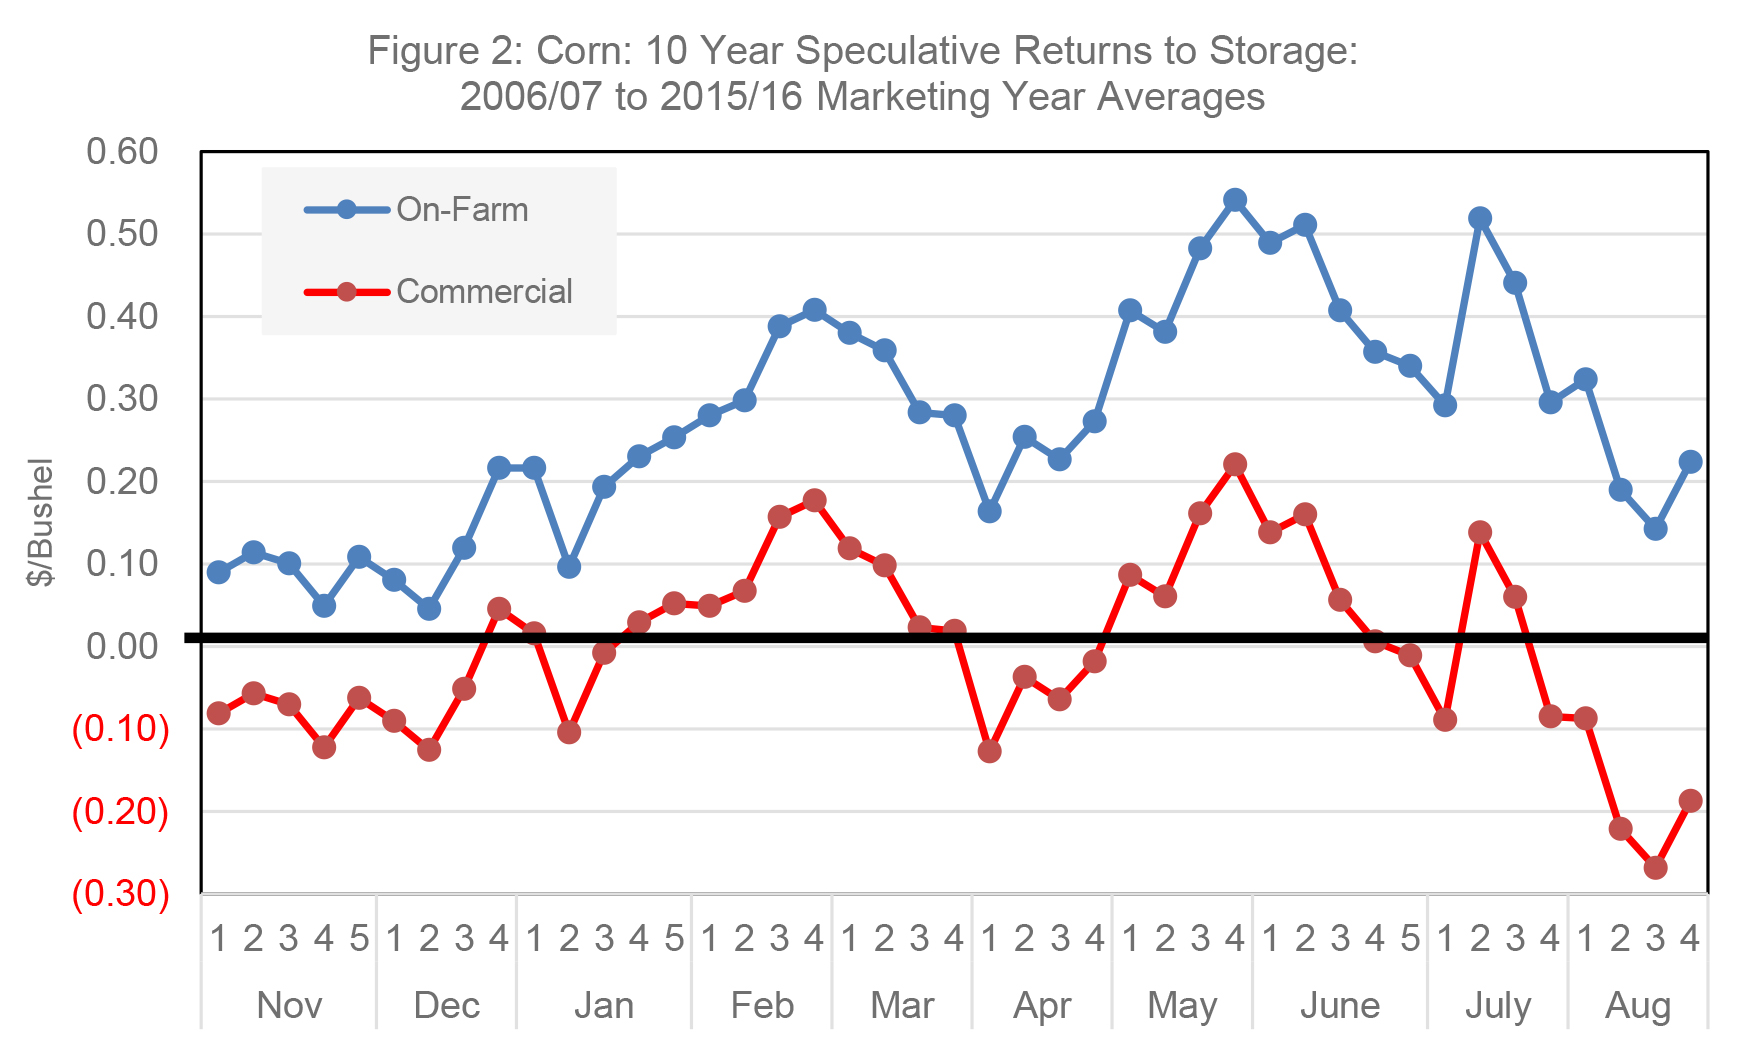
What about the averages over the entire 10 year period? This information is shown in Figure 2 for corn. It includes the 10 year gross returns for on- farm and net returns for commercial storage. Remember that the difference between the two is that commercial storage has added costs that includes an average of 17 cents as a flat fee for storage until January 1 and then 3 cents per active farmers want to reserve those days to plant the bushel per month starting January 1. Thus for the months of November through December the returns for commercial storage are 17 cents per bushel less than on- farm. For August, they are 41 cents per bushel less. This is composed of the 17 cent flat fee plus 8 months of storage at 3 cents per month ($.17 + (8 * $.03) = $.41).
On average, gross returns to on-farm storage for corn were highest in February and early March and again in May and early June. At the peaks, these 10 year average gross returns were $.40 to $.50 per bushel per year over the 10 years. A more conservative approximation, assuming one may not hit the highs, is $.30 to $.40 per bushel per year across the February through May period.
What does this mean? Since bin costs and labor are not included in the on-farm storage costs, it should be thought of as the returns to the farm for the costs of owning the grain system; providing the labor and management to operate it; and taking the risk associated with on-farm storage, (some grain going out of condition and theft are two examples).While these gross returns show the highest returns were in May or early June, next crop, rather than haul grain from on-farm bins to market. For this reason, working with buyers to deliver corn in late winter and then seek free DP (Delayed Pricing) with final pricing to be made by summer is a possible strategy.
Another way for a farm manager to think about this is to ask if $.40 to $.50 per bushel per year is enough gross return to cover all the costs and associated risk with owning and operating the grain system. The more conservative number for this historic corn data would be $.30 to $.40 per year.
On average, storage deep into the summer tends not to pay. Most years do not have a traditional late July and August drought. As a result, there is a tendency for storage returns to drop after early July.
The pattern of returns during this most recent 10 years is similar for commercial storage. The returns shown are the average over the 10 year period and do cover all costs, so are net returns.
For the 10 year period studied, there were positive commercial storage returns in a little less than one-half of the weeks. Those positive returns were around February and again in May and early June. Peak net returns were around $.20 per bushel per year on average over the 10 years. Past storage studies have tended to show that commercial storage to the February and March period was optimal over time. However, in the past decade represented by this study, the ultra-low interest rates may be contributing to positive storage returns into the spring.
Soybean Storage Returns
A similar evaluation was made for on-farm and commercial soybean storage where a farm manger would put grain in storage at harvest and then speculate for higher prices through the storage season. Weekly returns to storage through the storage season were calculated for the most recent 10 marketing years from 2006/07 through 2015/16. The harvest price for soybeans was considered to be the first two weeks of October so storage returns are reported beginning the third week of October.
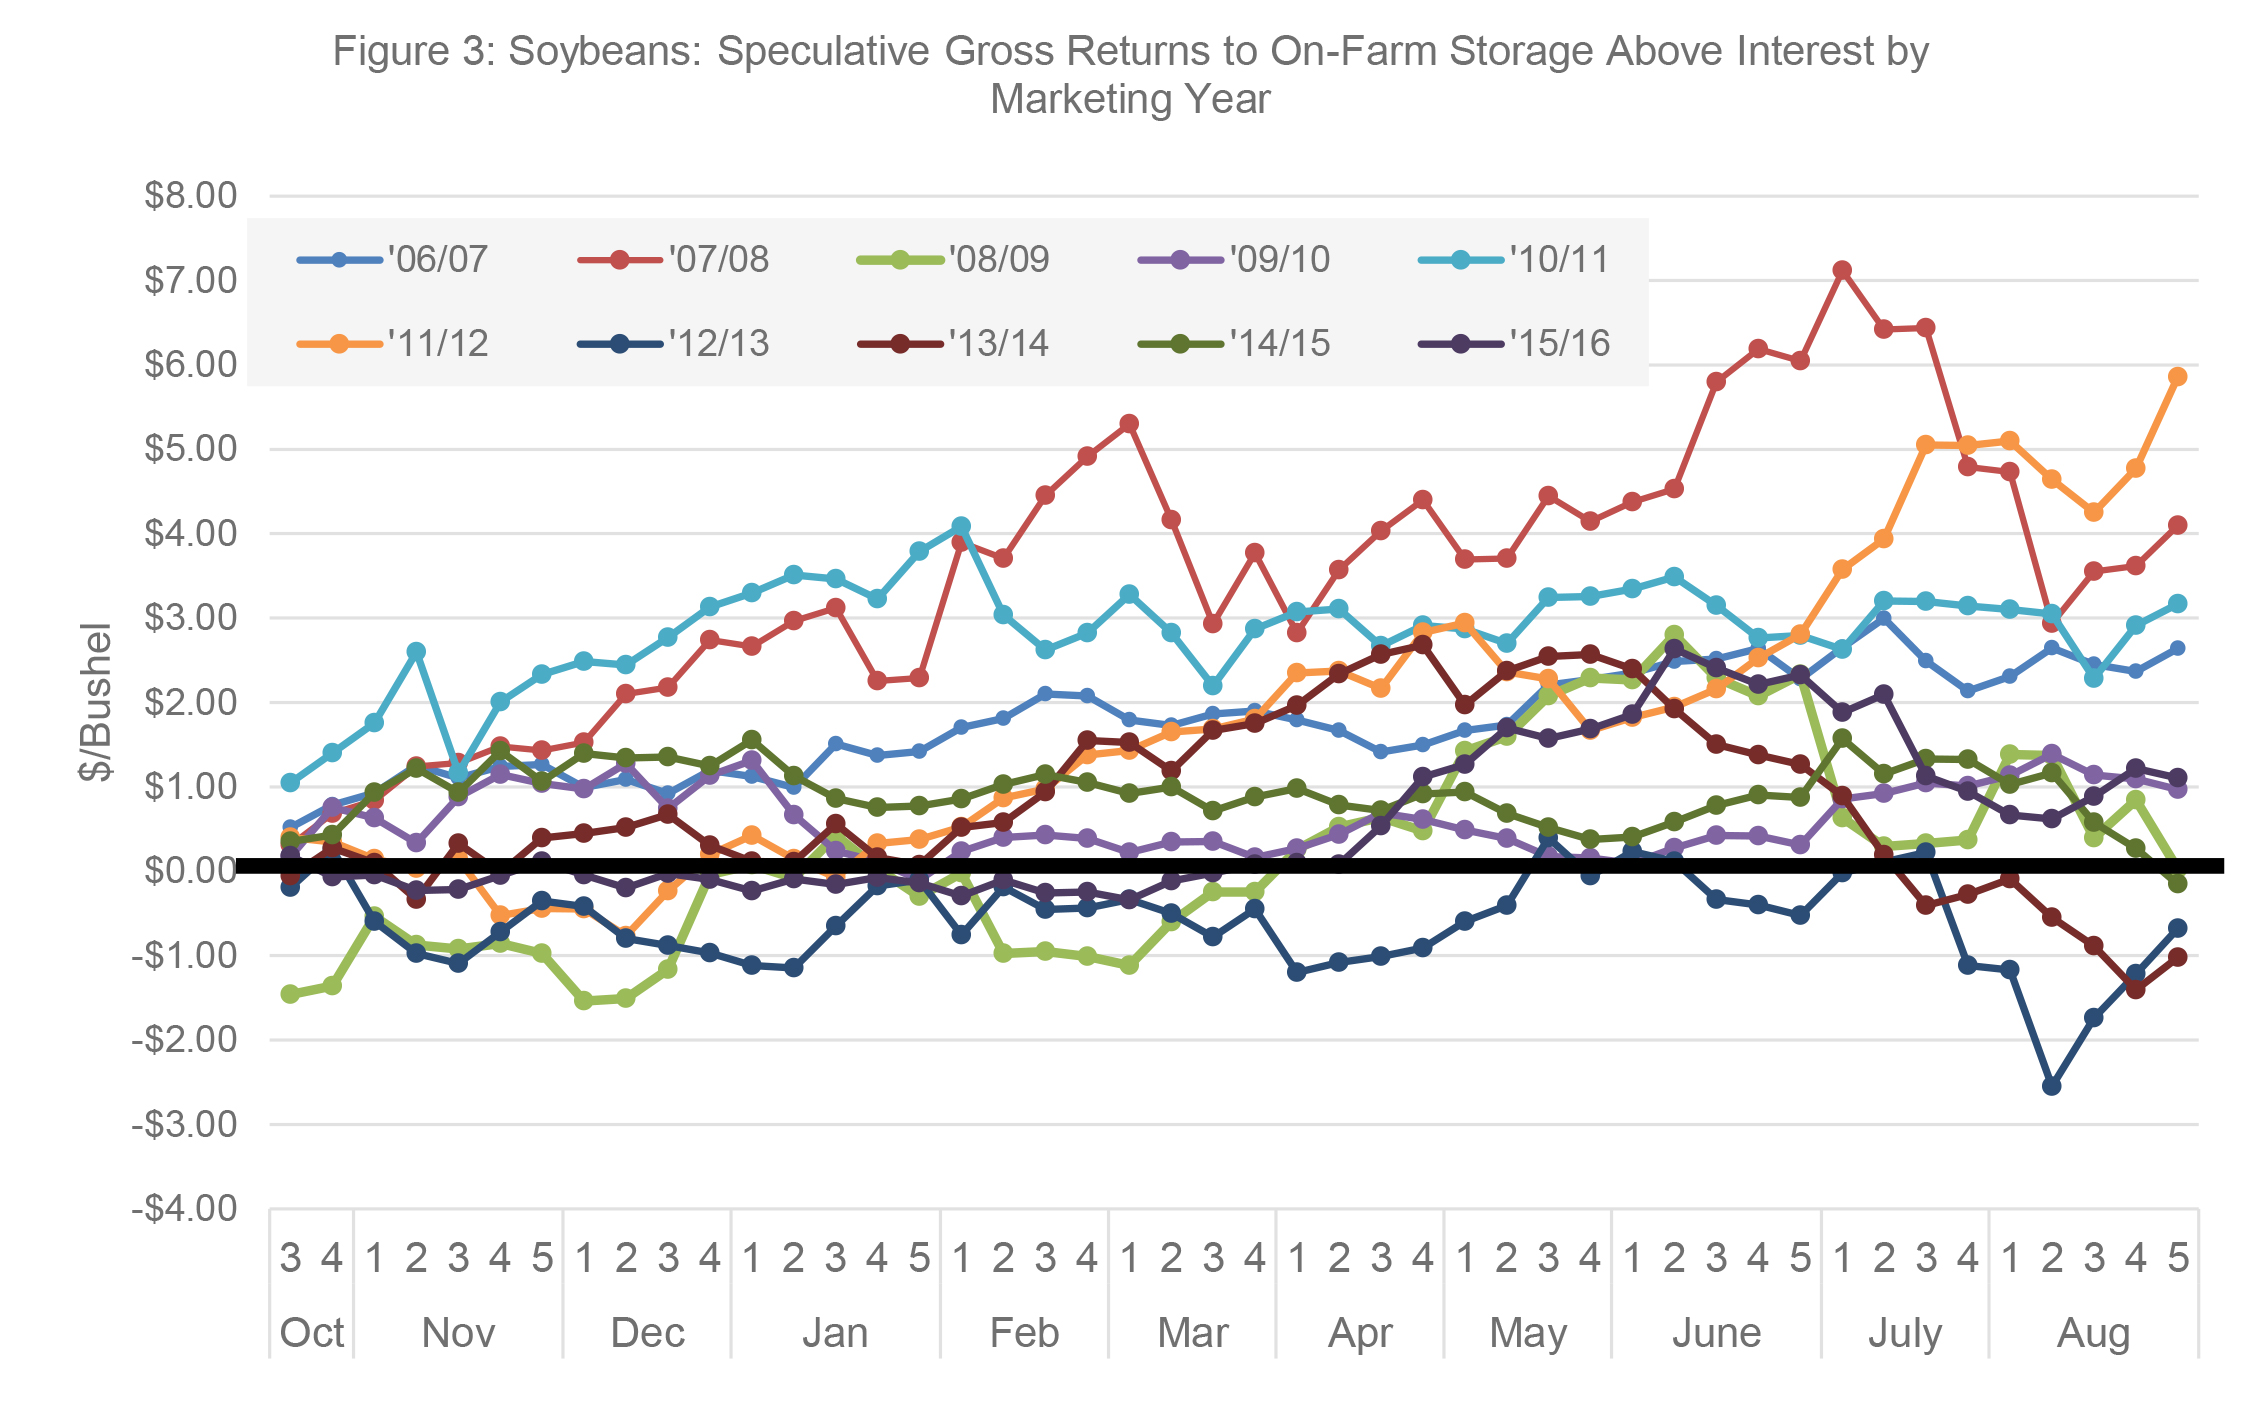
Soybean storage returns also varied widely over these volatile price years. On-farm gross returns to speculative storage varied from $7 per bushel positive returns to nearly $3 a bushel of loss at the extremes as shown in Figure 3. The $7 gain came from soybeans harvested in the fall of 2007 with prices exploding by the spring of 2008 during the first price boom. The nearly $3 of loss was for the 2012 crop where harvest prices were at record highs due to the drought and then fell sharply by August of 2013 as near-record production was being anticipated for the fall of 2013.
For soybeans during these 10 years, there were only one or two years that tended to have gross storage return losses. Corn in contrast had three or four.
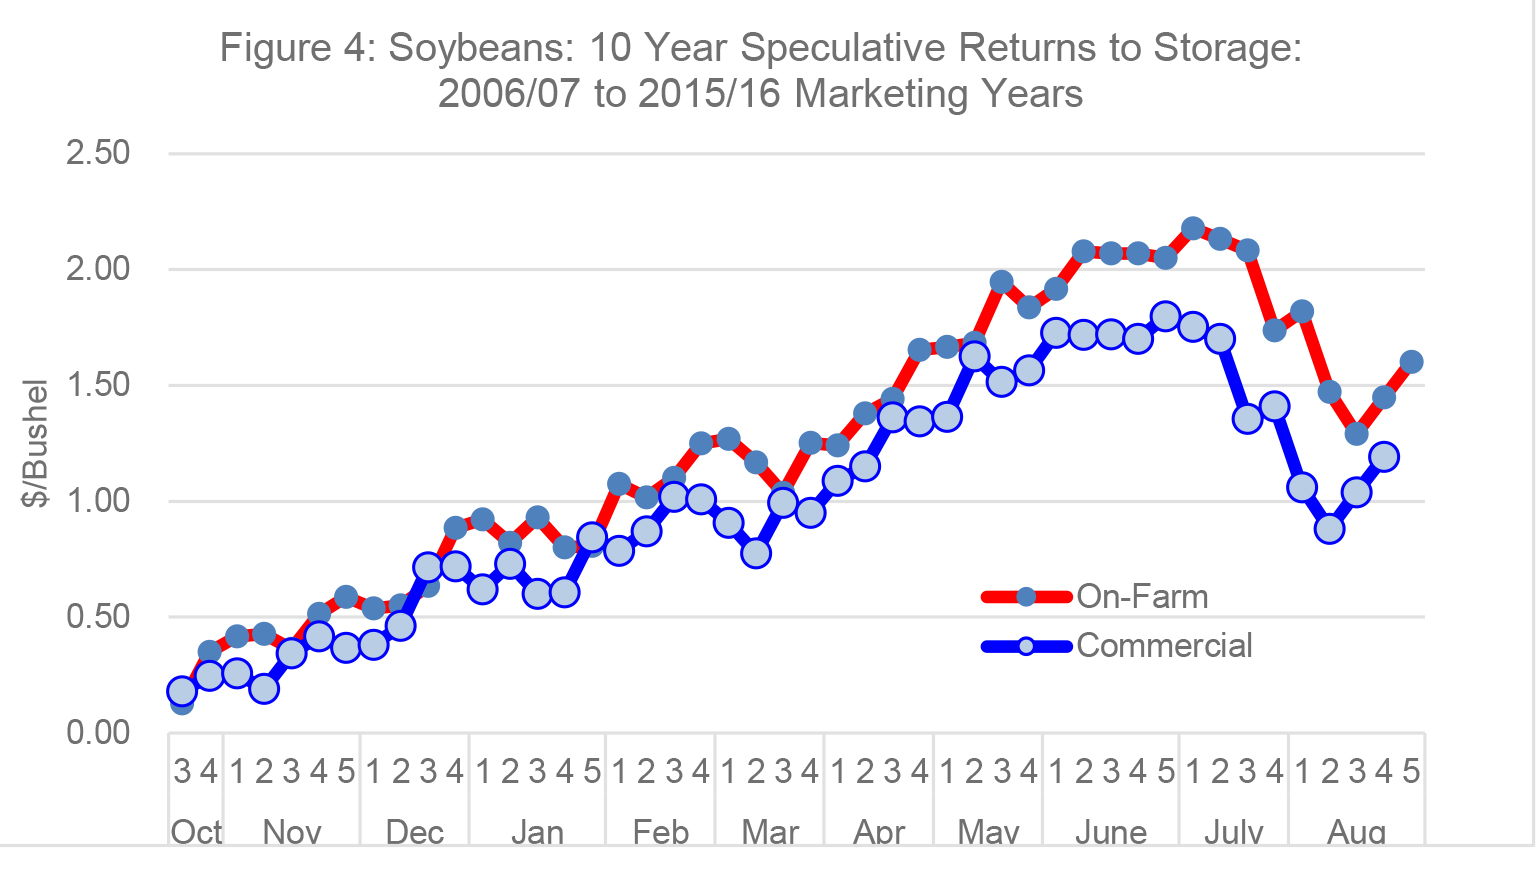
Average speculative returns to soybean storage was strong over these 10 years as shown in Figure 4. Gross returns to on-farm storage averaged over $2 a bushel for storage until June and early July. Since costs for the grain system and labor and management to operate it are not included for on-farm storage, this $2 gross return can be thought of as the return to cover those costs.
Average net returns to commercial storage were strongly positive as well. Returns were positive and increasing from immediately after harvest until June and early July. Returns for both categories dropped in late July and August.
Summary
This article reports on the returns to storage for corn and soybeans during the most recent 10 marketing years spanning 2006/07 to 2015/16. The returns are calculated as if a farm manager put grain in storage at harvest and then waited for prices to rise. As such, the owner is speculating on the price to rise by enough to cover the harvest value plus storage costs.
For this analysis, grain bids from a central Indiana grain elevator were collected each Wednesday evening over the 10 year period. Storage returns for corn and soybeans are reported weekly. On-farm storage returns include interest but not charges for grain facilities and the labor and management to operate the on-farm grain system. This means on-farm returns are the gross returns to cover the costs of the facilities and labor and management to operate them. Commercial storage charges are included for elevator storage and thus represents a net return.
The most recent 10 marketing years included a price boom and price moderation cycle. In addition, there were wide swings in world production, and a severe financial crisis and the subsequent “Great Recession” in 2008 and 2009.
The study showed that the riskiness of storage returns tends to increase the longer grain is stored. This is because there is an increasing amount of new market information as time passes after harvest. This new information has some randomness from year to year and may result in price tendencies after harvest that can be bullish, bearish, or neutral.
The recent past has been a volatile period for grain and soybean prices and this is reflected in wide swings in the speculative returns to storage. For corn, the extremes ranged from over $2 a bushel of positive gross returns to over $2 a bushel of loss. For soybeans, the range was from $7 a bushel of positive returns to nearly $3 a bushel of loss.
Gross returns for on-farm corn storage averaged about $.30 to $.50 for storage selling at the optimum time during these 10 years. This can be viewed as the return for the on-farm investment in the grain facilities and the operation and management of that system. Two periods of storage were near optimum. One was to sell corn in late February and March and the second was in May and early June. Commercial corn storage returned positive average returns in less than half of the weeks during the storage season. Optimum commercial returns were in the range of $.10 to $.20 per bushel per year on average and focused on selling around February and another period in May and early June.
Returns for soybean storage during these volatile price years were more positive than corn. Gross returns for on-farm soybean storage was about $1 per bushel per year by February and kept rising to near $2 per bushel per year by June and early July. Commercial soybean storage net returns reached about $1.70 per bushel by June and early July.
Implications for Farm Managers
- Speculative storage returns can vary sharply from year to year. Much of that volatility is driven by the new information that comes to the market during the storage season such as the size of the Southern Hemisphere crops and growing conditions in the U.S. during the next production season.
- The longer one stores into the storage season the great the volatility in storage returns (on average). For example storing grain into July of the following summer can result in higher or lower old crop speculative storage returns depending on supply and demand conditions that are evolving for the new crop.
- This study and others suggest that storage into late July and August has diminishing storage returns when returns are averaged over a number of years. In most years, there is not a late summer drought and thus late July and August are transition periods when crop prices are moving from the higher old crop prices to lower new crop prices.
- Soybean storage returns in this study were very large with on-farm gross returns of $1 to $2 per bushel per year. This is much higher than in previous studies and may be related to the upward shifting Chinese demand during the study period. The U.S. shipped about 400 million bushels of beans to China from our 2006 crop. That grew to an astounding 1.1 billion bushel by the 2015 crop, the last year in this study. Sharply increasing demand could have provided a more bullish overall pattern to soybean prices. Then again, the abnormally high storage returns to soybeans may just be related to the specific years in the study and the unique set of events during these years.
- For those without on-farm storage, selling corn out of the field at harvest was not such a bad strategy in these 10 crop years as more than one- half the weeks resulted in negative commercial storage returns. However, those that do not store should consider starting to forward price in the spring and add to the amount priced by very early July if their yield prospects are favorable.
- One golden storage rule is to strongly consider not storing in years that are likely to provide negative storage returns. That is generally a year when the national crop is small, like in a drought year. Characteristics of those years are when the nearest futures prices are higher than futures prices into the storage season and/or when cash bids for harvest delivery are higher than the bids for delivery later in the storage season like in January, March or May. The 2012 drought- reduced crop provided these conditions at harvest. If one had not stored that year and simply sold at harvest, they would have avoided negative storage returns and noticeably raised the average returns over the entire 10 year period
- Every year can be different and reading the storage signals in that crop year and adjusting storage strategy can increase storage returns if one is able to correctly read the signals. However, for those who are not able to accurately adjust to storage signals a routine strategy that uses some of the seasonal pricing points shown in this article may be preferred. In any case avoiding storage in years like 2012 as outlined in #6 is to be considered.
- Grain elevator managers and other buyers tend to be experts at understanding the storage signals and in making decisions about storage. Talk with them, learn from them, and discuss potential storage returns each season with them. However, remember that for the grain they buy and store for the elevator, they are generally futures hedgers. That is a topic for another article as farmers can also be futures hedgers.
References
Alexander, Corinne and Phil Kenkel. “Economics of Commodity Storage.” Kansas State University, S156-27, March 2012. http://entomology.k-state.edu/doc/finished-chapters/s156-ch-27-economics-of-commodity-storage.pdf
Hurt, Chris. “Returns to Corn Storage in Recent Boom Years.” Purdue Agricultural Economics Report, June 2014,pp.10- 13. https://ag.purdue.edu/agecon/Documents/PAER_June%202014.pdf


