Corn Storage Returns: Implications for Storage and Pricing Decisions
June 5, 2019
PAER-2019-05
Author: Chris Hurt, Professor of Agricultural Economics
![]()
![]()
![]()
![]()
![]()
Grain storage is an important marketing function that provides “time value” to the grain. Grain production occurs at harvest time, but usage is spread throughout the marketing year. Thus storage is required to remove the harvest surplus and then to allocate that surplus to users in an orderly manner until the next harvest.
Corn producers want to know how much return they might get from storing corn and when is the best time to price corn to give the highest storage returns. To examine these important questions we look at the historical storage returns based on cash bids each week at a central Indiana unit-train loading facility. These weekly cash bids are the Wednesday (mid-week) closing bid quoted publicly by the facility.
First, we will explain how on-farm corn storage returns are estimated and then move on to commercial storage returns. On-farm storage is the largest portion of the state’s grain storage. USDA reports that 61% of the total storage space in Indiana is on-farm storage (see USDA: Grain Stocks report for December 1 data). The remaining 39% is off-farm storage at locations like grain elevators, processing plants, warehouses, and terminals that store grain for their own use and/or for a storage fee for customers.
For this study we assume the farmer puts the grain in the bin at harvest and takes the cash price bid the week they decide to price and deliver the grain. They are speculating on the cash price. Of course they hope the cash bid goes up after harvest by enough to give positive returns. The corn harvest value was assumed to be the average cash bid for the last-two weeks of October.
For on-farm storage, only weekly interest costs are subtracted as a cost of storage. The structure of interest rates has changed over the 30 years in this study so prior to the 2001 crop, the 6 month certificate of deposit interest rate was used. Starting with the 2001 crop the prime interest rate was used. Individual farmers may use considerably different interest rates in their personal storage decisions.
For on-farm storage, if the cash bid rises by enough to cover the interest cost after harvest, then there was a positive return for that week. Of course those who have on-farm storage know there are substantial costs to owning and operating those facilities. Since the on-farm returns in this study only consider interest as a cost, this means that the returns reported here represent the $ per bushel left to cover ownership and operating costs for the on-farm storage.
Returns in three time periods are reported. Those are: the most recent 10 crop years representing the corn crops harvested in 2008 to 2017. Those are the 2008/2009 to 2017/2018 marketing years. Note that at the time of this publication, the 2018/2019 marketing year was not complete and thus is not included. The second time period is the most recent 20 years representing the crops from 1998 to 2017; and a 30 period for crops harvested in 1988 to 2017.
Returns to Speculative On-Farm Corn Storage
Figure 1 shows returns to on-farm storage above interest cost by week in $ per bushel. The horizontal scale is weekly. Remember, harvest is the last two weeks of October so the storage returns begin in November and run through the following August. The numbers 1-2-3-4 represent the weeks of each month. These are the estimated returns per bushel available to cover the ownership and operating costs of on-farm storage as defined by the assumptions in this study.
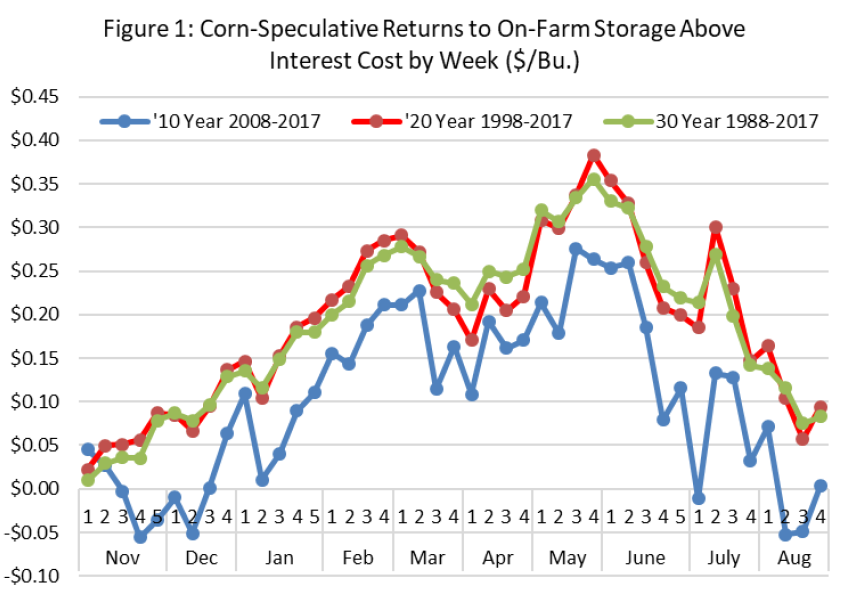
Figure 1: Corn-Speculative Returns to On-Farm Storage Above Interest Cost by Week ($/Bu.)
Remember they are averages of weekly returns for the multiple years in each of the periods.
For the three time periods note the consistent seasonal pattern of these returns throughout the storage season. Returns tend to rise from harvest into early-March. Then weaken in later-March and April, before peaking in May and early-June. Finally note the rapid decline in storage returns into the late-spring and summer.
What drives this seasonal pattern of returns? It is primarily the seasonal cash price pattern that has a tendency to reach peaks (on average over a series of years) in the spring. Cash prices have a tendency to decline into the summer, especially the mid-to-late summer and accumulating interest costs also contribute somewhat to lower summer storage returns.
How much return has there been to cover the costs of ownership and operating costs for on-farm corn storage above interest costs? Over the long run, that has been in the range of $.25 to $.40 per bushel when viewed as simply taking the cash price offered each week (speculative returns) and pricing in the near optimum time periods in late-February and early-March or late-May and early-June. Also recognize that the assumptions in this study may not be accurate for an individual situation.
Average returns in the most recent period representing the 2008 to 2017 crops have been lower than the longer periods. Does this say that returns to speculative corn storage are decreasing over time? My answer would be No! When we look at returns in this manner the overall multi-year trends in prices over time can have a big impact on these storage returns. As an example, if prices are overall going up, like during the ethanol build-up this tends to make storage returns look strong as prices overall are rising.
The opposite has been true for periods of overall decreasing prices-and there is plenty of this direction in the most recent 10 years. Three negative storage return years are noted among the last 10. Those are the 2009 crop as the great recession in 2009 caused weak demand and lower corn prices. The second year of poor storage returns among the past ten was in the drought of 2012 when cash corn prices started at record highs near harvest and then generally dropped through the storage season. The third major negative storage return year was the 2015 crop when corn surpluses were growing and the reality of lower prices was setting in. As a general statement, corn prices were overall trending lower from the 2012 crop to the 2017 crop and thus setting the stage for the “lower than normal” period of speculative storage returns shown here.
When speculating for higher prices to give a positive return to storage there can be a wide range of outcomes primarily driven by the forces of supply and demand that determine prices. Harmful weather in South America can increase Indiana corn prices in our spring. A summer dry spell in the Midwest can boost summer prices, just as much as a near-perfect growing season can depress them. For this reason there is a lot of variation from year-to-year in these weekly returns. (See the next article for some of those dynamics.)
Those storing on-farm would also like to know the odds of having a positive storage return in each of the periods. In Figure 2 we count the number of years in each of the three periods that there was a positive return to on-farm storage above interest cost. Looking at the 20 and 30 year periods, in roughly 60% to 80% of the years there was a positive return to on-farm storage during the peak return periods in February to early-June. However the odds decrease somewhat into the summer. Why? As the spring approaches the new crop situation begins to influence old crop prices. That information can increase or decrease old-crop prices.
Therefore storage into the late-spring and summer is more risky depending on what happens to the new-crop growing conditions.
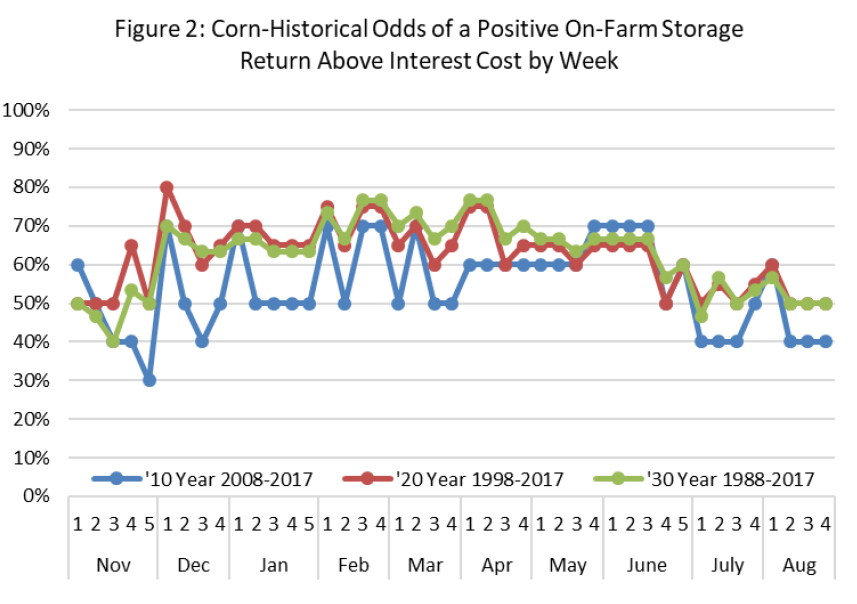
Figure 2: Corn-Historical Odds of a Positive On-Farm Storage Return Above Interest Cost by Week
Returns to Speculative Commercial Corn Storage
What are the historic returns for storage at a commercial facility like the local grain elevator? In this case, the elevator is a licensed warehouse and has charges for their storage services. In this study there was a flat charge per bushel for storage until December 31 and then a monthly charge for each month of storage beginning in January. The monthly charge was pro-rated by week. Of course over 30 years these storage rates have changed, but the study reflects charges at the time. For the 2017 crop which represents the most recent year in the study, the charges were a $.18 per bushel flat charge until December 31 and then $.03 each month beginning in January, and pro-rated weekly. So, storage charges until the end of February were $.24 per bushel, and storage until the end of May were $.33 per bushel.
Estimated speculative storage returns above interest and storage charges are shown in Figure 3 for
the three time periods. The best time to price out of commercial storage was in late-February and
early-March. But also note that pricing in May and early-June gave speculative returns that were roughly equivalent, but likely with somewhat higher risk. So, this shifts my preference a bit more in favor of late-winter pricing, but others may decide to store into the spring because of their personal situation or because of their price outlook.
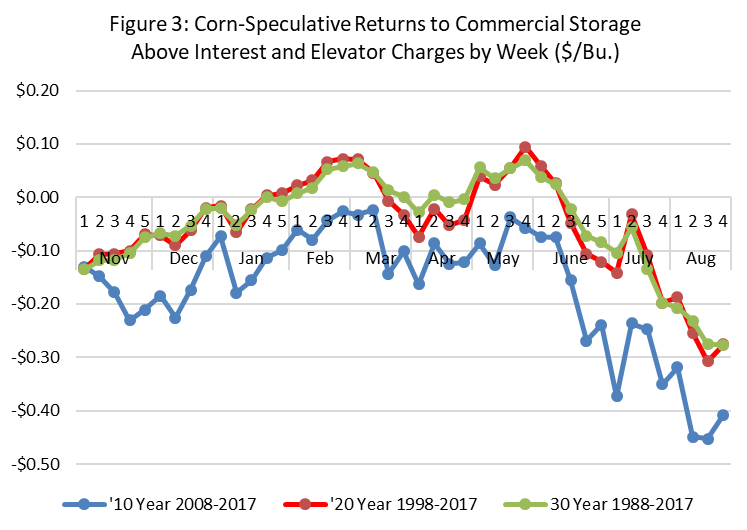
Figure 3: Corn-Speculative Returns to Commercial Storage Above Interest and Elevator Charges by Week ($/Bu.)
Historic returns above costs for corn storage have been in the range of $.00 to $.10 per bushel on average for pricing at the historical optimal weeks. While this seems small, it is a positive return above all costs. Commercial storage facilities have substantial costs and do protect the quality of the grain for their storage customers. Those customers often have other important motivations for storing corn such as rolling income tax liabilities from the harvest year into the next tax year.
Another important observation is to recognize how sharply storage returns drop into the summer for commercial storage. The reason is three fold: cash prices tend to drop; storage charges keep piling up; and interest costs continue to grow as well.
Figure 4 shows that the historic odds of a positive return to storage have been about 50% for the longer run periods for the optimum pricing weeks. Or, in the past 20 or 30 years, about 50% of the years had positive commercial storage returns as calculated in this study in the optimal pricing weeks.
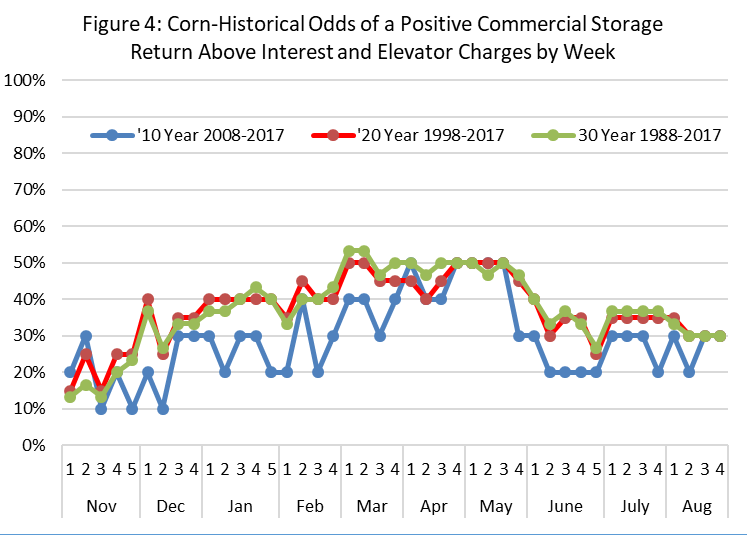
Figure 4: Corn-Historical Odds of a Positive Commercial Storage Return Above Interest and Elevator Charges by Week
Implications for Storage and Pricing Decisions
Does corn storage pay? How much? When is the best time to price corn that is in storage? Are the conclusions different for on-farm stored corn compared to corn stored at an elevator? These are some of the key questions that producers who store corn may have.
This study attempts to shed light on these questions by looking at what has happened to Indiana corn storage returns in the past 10, 20, and 30 year time periods. The way these returns are calculated is outlined and those methods are important to the results. Interest costs were subtracted for both on-farm and commercial storage. Commercial storage fees were also subtracted from commercial storage returns.
Over the long run periods representing the last 20 and 30 years, estimated returns to cover the ownership and operating costs of on-farm storage averaged $.25 to $.40 per bushel per year if one priced during the near optimum weeks.
There were two pricing windows for on-farm storage returns that stood out as averages across these multi-year periods. The first was in late February and early March, but the highest returns came from pricing in May and early-June.
Returns for commercially stored corn averaged $.00 to $.10 per bushel per year over the longer time periods for corn priced in the near optimal time windows. Remember that commercial returns also subtracted the storage fees charged by the elevator as well as interest costs.
The near optimal windows for commercially stored corn were in late February and early-March or in May and early-June. But in contrast to on-farm storage, these two windows were roughly equivalent for commercial storage while May and early-June was superior for on-farm storage.
Another important observation from this historical record is that storage returns on average across these years tended to drop sharply after early-June with a tendency to fall further as the summer progressed. This was true for both on-farm and especially commercial storage. This is driven by the average seasonal cash price pattern in which summer cash corn prices tend to fall as the new crop develops.
Returns calculated in this manner are called speculative returns to storage. This is because one is mixing storage returns with speculation on price changes.
Corn storage returns were lower in the most recent 10 year period, but this is likely due to the unique period of years as explained in the article.
Finally, these are results from history and that does not mean the results will be the same in the future. There is much variation from year to year and this means those making storage and pricing decisions will want to consider at least three factors in their decisions: the overall storage situation in each year; the price outlook in each year; and personal economic factors that impact their family or business. Cash flow needs and income tax management would be two examples of how family or business needs often impact storage and pricing decisions.
![]()
![]()
![]()
![]()
![]()