
COVID-19 Assistance to Indiana Producers in 2020 and 2021
May 10, 2023
PAER-2023-22
Hari P. Regmi, Agricultural Economics Doctoral Student
![]()
![]()
![]()
![]()
![]()
Introduction
There were significant supply and demand disruptions due to the COVID-19 pandemic, especially in the first year of the pandemic 2020. This resulted in significant fluctuation in commodities prices, including a rapid and sudden decrease in the commodities prices in the first half and middle of 2020. To offset the price decline and additional marketing costs incurred by producers, the USDA implemented several pandemic-related programs, including the Coronavirus Food Assistance Program (CFAP) using authority from bills passed to provide assistance to US businesses. Farm operations were also eligible to receive assistance from programs administered by other U.S. federal agencies. One of the major sources of non-USDA assistance was from the forgivable Paycheck Protection Program (PPP) loans administered by the Small Business Administration (SBA) with assistance from the U.S. Treasury.
This program resulted in a record-high government payment of 45.5 billion (in real 2023 dollars) to the farm sector in 2020 (at the national level). In this report, we analyze government payments, especially COVID-19 pandemic assistance, received by Indiana producers from USDA (labeled USDA pandemic assistance) and non-USDA sources (labeled non-USDA pandemic assistance) in a format similar to Giri et al. (2021), which examined assistance from CFAP and PPP loans to Illinois producers. We use publicly available data from the CFAP database, PPP database, and the Economic Research Service’s Farm Income and Wealth Statistics data product released on Feb 7, 2023, and Agricultural Resource Management Survey (ARMS) summary data.
USDA Pandemic Assistance Payments
Coronavirus Food Assistance Program was the primary COVID-19 pandemic assistance relief program for agricultural producers administered by the USDA. CFAP provided financial assistance to agricultural producers and ranchers that were directly affected by the COVID-19 pandemic. Agricultural producers who incurred a substantial increase in marketing costs or a substantial decline in sales or prices due to the COVID-19 pandemic were eligible for assistance under the CFAP program (USDA, 2020).
Figures 1 and 2 represent the different components of direct government payments to Indiana producers for two years (2020 and 2021) in real, inflation-adjusted 2023 dollars. Indiana producers received $1.5 billion direct government payments in 2020. The lion’s share of the government payments came from USDA-pandemic assistance in 2020, $764 million, which was more than 50% of total government payments received by Indiana producers. The regular Farm Bill programs payments (including those from PLC and ARC) accounted for 16.2%, or $ 240.4 million. Market Facilitation Payment (MFP) program accounted for 14.2%, or $211.8 million, and other ad hoc disaster assistance programs (such as payments from Wildfire and Hurricane Indemnity Program, Emergency Relief Program, Quality Loss Adjustment Program, and other Farm Bill designated disaster programs) accounted for 4.8%, or $70.9 million, of total government payments to Indiana producers in 2020.
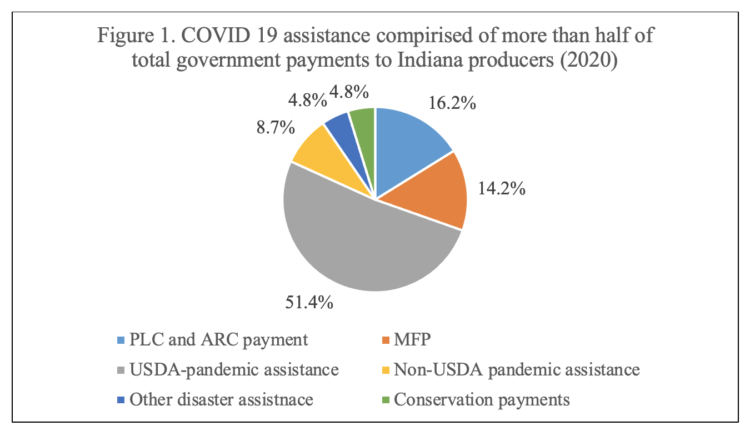
Figure 1. COVID 19 assistance compirised of more than half of total government payments to Indiana producers (2020)
Indiana producers received $716.9 million in direct government payments in 2021, which is almost half of the total government payment received by agricultural producers in 2020. The decline in USDA pandemic assistance payment lowered the total government payment in 2021. In 2020, Indiana producers received $764.4 million USDA pandemic assistance payments whereas they received $278.5 million in 2021.
Indiana producers received $128.9 million non-USDA pandemic assistance payments in 2020, which was 8.7% of total government payments (figures 1 and 2). However, in 2021, Indiana producers received a $230.5 million non-USDA pandemic assistance payment, which is 78.7% or 101.6 million higher than the payment received in 2020.
Overall, USDA-pandemic assistance payments made to Indiana producers decreased in 2021 as compared to 2020 (declined from more than 50% share in total government payments in 2020 to 39.1% in 2021 or declined from 764.4 million to 278.5 million). However, non-USDA pandemic assistance payments increased from 2020 to 2021, 8.7% share of total government payments in 2020 to 32.4% in 2021. This shows that non-USDA pandemic assistance was an important source for producers in 2020 and, even more, in 2021.
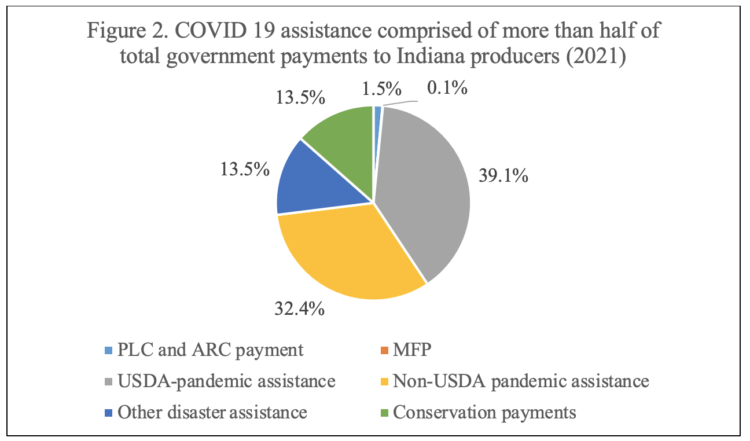
Figure 2. COVID 19 assistance comprised of more than half of total government payments to Indiana producers (2021)
Non-USDA Pandemic Assistance Payments: Paycheck Protection Program
The Small Business Administration administered the PPP program to support small businesses, including the farm sector. The SBA group crop production and animal production subsector according to the North American Industry Classification System (NAICS) code. The crop production subsector is coded as NAICS 111 and the livestock production subsector is coded as NAICS 11.
Table 1 shows approved PPP loans for Indiana producers in 2021. The SBA data indicates that the crop production sub-sector received $243 million PPP loans, and the livestock sub-sector received $82.80 million PPP loans. The crop production sub-sector received a greater amount of loan assistance relative to the animal production most likely because crop production is more labor intensive and PPP was designed to offset labor expenses.
Table 1 also presents PPP loan forgiveness rate (forgiveness amount/approval amount). The PPP loans were to be forgiven if the recipients met the forgiveness requirements, including 60% or more of PPP loan for payroll expenses within 24 weeks of receiving PPP loan on labor expense (SBA 2022; Giri et al. 2023). The unforgiven PPP loans (and loan amount) become a regular low-cost loan for the recipient. Results indicate that 98.3% of total PPP loans made to Indiana agricultural producers had been forgiven, which is similar to the national-level farm sector PPP loan forgiveness rate of 98% (Giri et al., 2023). We do not find a difference in loan forgiveness rates between crop and animal production subsectors.
| Table 1: PPP approved loans and forgiveness rate for Indiana producers in 2021 | ||
| Subsector | Approved loans ($ million) | Forgiveness rate* |
| Crop production (NAICS 111) | 243.00 | 98.3 |
| Animal production (NAICS 112) | 82.80 | 98.1 |
| Total | 325.80 | 98.3 |
Average government received by Indiana producers in recent five years (2017-2021)
Figure 3 shows the average government payments per farm in Indiana for the five years from 2017 through 2022 using ARMS web tool data. Data indicate that the average government payment per farm was a record high in 2020 at $35,497 (35.2% of total net cash income) followed by $28,731 in 2019. The higher government payment in 2019 compared to 2017 and 2018 might be due to higher MFP payments and higher government payments in 2020 and 2021 might be due to USDA pandemic assistance and non-USDA pandemic assistance payments. We also calculate the share of government payments to net cash income and present results in figure 2. Results indicate that the share of government payments was a record high in 2020, 35.2% of net cash income to Indiana producers.
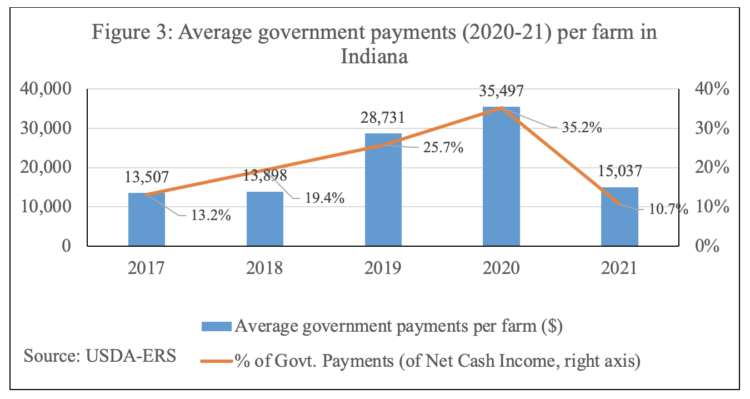
Figure 3: Average government payments (2020-21) per farm in Indiana
Conclusions
Historically, Farm Bill programs have provided a majority of farm income support to producers. In recent years, especially 2020 and 2021, the pandemic assistance payments comprised the largest share of government assistance to Indiana producers. The average government payments per farm ($35, 497) was a record high in 2020 (35.2% of net cash income). In 2020 and 2021, Indiana producers received more than $1.1billion from USDA pandemic assistance programs and more than $359.5 million from non-USDA pandemic assistance programs. Indiana crop production sub-sector received almost three times more PPP loans compared to the animal production sub-sector, however, PPP loans forgiveness rate (98%) was similar for both subsectors and on par with the national level.
References
Coronavirus Food Assistance Program 1 Data. Available on Coronavirus Food Assistance Program 1 Data | Farmers.gov
Coronavirus Food Assistance Program 2 Data. Available on Coronavirus Food Assistance Program 2 Data | Farmers.gov
Giri, A.K., D.Subedi, J.Janzen, and l. Tettech. 2021. “Pandemic Assistance to Illinois Agricultural Producers in 2020 from the Coronavirus Food Assistance Program (CFAP) and the Paycheck Protection Program (PPP)” https://farmdocdaily.illinois.edu/2021/10/pandemic-assistance-to-illinois-agricultural-producers-in-2020-from-cfap-and-ppp.html.
Giri, A.K., D. Subedi. A.K.Mishra, E. Wesley F. Peterson, R. Baral, and H.P.Regmi. 2023. “(Un)Forgiven Paycheck Protection Program (PPP) Loans to the Farm Sector.” CHOICE (forthcoming).
Paycheck Protection Program data. Available on PPP data (sba.gov)
US Department of Agriculture. 2020. Coronavirus Food Assistance Program 2 Cost-Benefit Analysis. US Department of Agriculture, Washington, DC. Available on https://www.farmers.gov/sites/default/files/documents/CFAP2-CBA-09252020.pdf
US Department of Agriculture, Economic Research Service. 2022. Government payments by program. Available on https://data.ers.usda.gov/reports.aspx?ID=17833#P4fda7f1a989d4de7 aaac4001448c80a9 _2_118iT0R0x14
US Department of Agriculture, Economic Research Service. 2023. ARMS Farm Financial and Crop Production Practices. Available on https://www.ers.usda.gov/data-products/arms-farm-financial-and-crop-production-practices/
![]()
![]()
![]()
![]()
![]()