Crop Insurance Guarantees
December 6, 2018
PAER-2018-30
Michael Langemeier
![]()
![]()
![]()
![]()
![]()
Crop insurance guarantees and potential indemnity payments vary among crop insurance products. Table 1 illustrates potential indemnity payments for three products; yield protection (YP), risk protection with harvest price exclusion (RP-HPE), and risk protection (RP); under three price and yield scenarios for corn. These scenarios are used to illustrate the differences between the three insurance products. It is important to note that the scenarios depicted are less likely to occur than scenarios using average or expected price and yield, or prices and yields slightly below expected price and yield.
The first section of Table 1 presents crop insurance projected price for corn in 2018, a coverage level of 85 percent, and the insurance guarantee or trigger for each product. This example is for a case farm in west central Indiana. As noted by Schnitkey (2017), high coverage levels (i.e., 80 to 85 percent) are commonly used in this part of Indiana. Lower coverage levels (50 to 80 percent) could also be chosen by producers. The YP product has a yield guarantee of 155.55 bushels (183 x 0.85) per acre. The RP-HPE and RP products have a revenue guarantee of $615.98 per acre. These revenue guarantees are computed by multiplying the trend adjusted APH yield by the projected price and 0.85 (i.e., the coverage level).
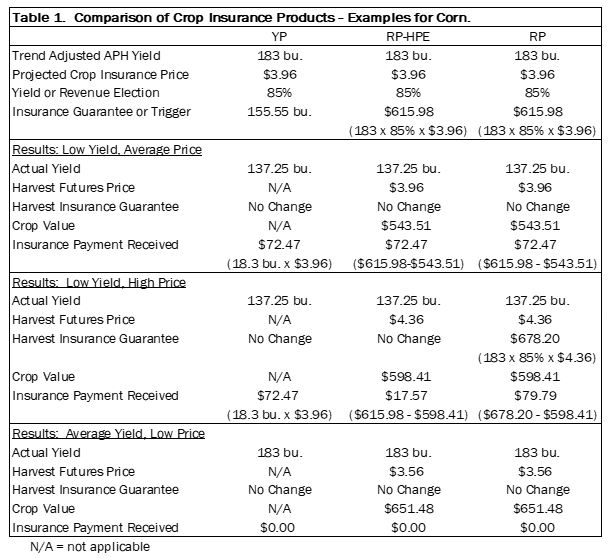
Table 1. Comparison of Crop Insurance Products – Examples for Corn.
The first scenario depicted in Table 1 exhibits a low yield (25% below trend adjusted APH yield) and a harvest price (i.e., average price) of $3.96. Under this scenario, the insurance payment for each product would be $72.47 per acre. If the harvest price differed from the projected price, the payments for the RP-HPE and RP products would differ from the payment for the YP product. A contrived set of prices is used in this scenario to illustrate that all three products provide payments when yields are extremely low.
The second scenario in Table 1 depicts a situation with low yield and relatively high price (25 percent lower yield and 10 percent higher harvest price). This scenario is similar to, but not as extreme, as what occurred in 2012. Under this scenario, the insurance payments vary across the three products. The indemnity payment for the YP product is the same as it was in the first scenario. For this product, the change in price has no impact on the indemnity payment. Because of the price increase, the indemnity payment for the RP-HPE product is lower than the indemnity payment for the YP product. In contrast, the RP product indemnity payment is higher than the payment for the YP product. In essence, the RP product pays for the bushels lost using the greater of the projected and harvest prices. In this case, the harvest price is higher so this price is used to compute the indemnity payment.
The third scenario in Table 1 presents the results of an average yield and relatively low price (10 percent lower harvest price) situation. If the U.S. corn crop is above trend yield in 2018, this scenario could play out. In this scenario, the indemnity payment for the YP, RP-HPE, and RP products are zero. Price would have decline more than 15 percent to trigger indemnity payments for the RP-HPE and RP products. Yields would have to decline to trigger a payment for the YP product.
Reference
Schnitkey, G. “Revenue Protection (RP) Use on Corn in the Midwest.” farmdoc daily (7):2, Department of Agricultural and Consumer Economics, University of Illinois at Urbana-Champaign, January 4, 2017.
![]()
![]()
![]()
![]()
![]()