Dairy: “Butter” Hold On – Tight Margins Continue!
December 16, 2017
PAER-2017-20
Authors: Nicole Olynk Widmar, Professor of Agricultural Economics and Courtney Bir, Ph.D. Candidate and Research Assistant


The hoped for prospects for milk price improvements are simply not materializing. Milk prices are looking like more of the same, with some downward pressures, if anything. The usual milk market factors of interest, including the number of milk cows, total milk production, stocks, and trade do not offer much hope of improved prices. Milk production continues to increase year after year. This year the US is expected to produce a new record, 217 billion lbs. Cow numbers are also at a record high of 9.4 million, with record production per cow. The cowherd has expand- ed by 50,000 head between December and June and productivity has improved by 1%. On the other hand, slaughter was up 4% from January – August 2017 and was on track to be the largest since 2013.
Stocks on a milk-fat basis remain high as seasonal consumption patterns have been lower than historical averages. In particular, exports of butter and cheese have been weaker than expected. Fluid milk sales volume was down 2% from the previous year in July, resulting in more milk available for cheese, butter, powder and other markets.
Butter is the hottest dairy commodity with American’s consuming 20% more butter per person when compared to 2000, and 8% more than last year. Butter inventories have been decreasing due to increasing demand, and were down 12% in August when compared to the previous year. However, recent downward price pressures and high global stocks have sent fourth-quarter 2017 prices lower for butter, as well as non-fat dry milk and whey. Cheese and powder inventories are at historically high levels. Pizza cheese (mozzarella) has been an increasing product of the dairy industry with exports now accounting for 7% of the U.S. production last year. Cheese prices were raised for the fourth quarter, a reflection of recent price strength.
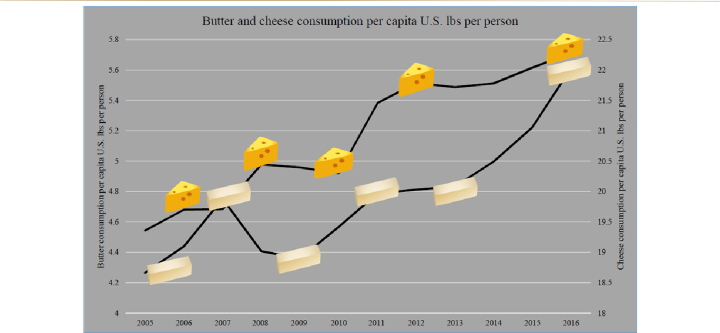
A look at changing per capita cheese and butter consumption in the United States.
Data Sources: USDA National Agricultural Statistics Service, USDA Farm Service Agency, USDA Foreign Agricultural Service, USDA Agricultural Marketing Service, U.S. Department of Commerce Bureau of the Census, California Department of Food and Agriculture, USDA Economic Research Service calculations. Graphic developed by Courtney Bir, 2017.
Price declines for most dairy products in domestic and international markets have led to lower expectations for the 4th quarter 2017 all-milk price forecasted at $17.75-$17.95 per cwt.
The all-milk price for 2018 is now forecasted by USDA to be $0.80 per cwt lower than 2017 at the midpoint of their range. Prices are expected to be $16.65 to $17.45 for 2018.
Milk margins have seen some improvement as harvest has bolstered on-farm feed supplies and feed costs are relatively low. The main driver of higher margins is high crop yields. Corn crops are yielding high silage tonnage, and the USDA reports stocks of soybeans are much higher than last fall. The 2017/18 USDA price forecast for corn is at $2.85-$3.55 while the soybean meal price is forecast at $295-$335 per short ton as of the December update.