Do High Rebates Guarantee High-Cost Savings?
May 15, 2024
PAER-2024-19
Yi Wang, Graduate Research Assistant
![]()
![]()
![]()
![]()
![]()
Introduction¹
The Women, Infants, and Children (WIC) program is the third largest food and nutrition assistance program in the US, with annual Federal expenditures reaching $5.0 billion and benefiting nearly 40% of all newborns in the nation as of 2021. The program assists pregnant, postpartum, and breastfeeding women, as well as children up to age five, who meet the income (at or below 185% of the U.S. Poverty Guidelines) and state residency requirements. WIC participants enjoy free infant formula (hereafter, IF) for their babies. In total, more than 50% of IF sales in the US are to WIC participants.
Since the late 1990s, WIC has leveraged on a sealed bid to contain costs via its infant formula rebate system. Specifically, IF manufacturers in each state propose product prices and rebates to the state WIC agency, leaving the net cost borne by the government equal price minus rebate. The manufacturer that offers the largest rebates wins the bid and becomes the sole brand of IF products bought via WIC, implying a concentrated market. While rebates reduce government expenditure, the concentrated market could generate conflicting cost effects, which further depend on the relationship between IF manufacturers and retailers.
My dissertation investigates the cost effects of the WIC bidding system with structural models. I am constructing demand and supply models that allow me to empirically test the vertical relationship between IF manufacturers and retailers. Given the results, I will perform counterfactual analyses to compare government costs in scenarios with and without the bidding system in place. This brief report aims to present key stylized facts about the complex IF market that motivates my models.
Overview of the U.S. Infant Formula Market
The U.S. IF market is highly concentrated. Abbott and Mead Johnson jointly dominate the national IF market, commanding an impressive 80% of total sales in the US. Abbott operates IF plants in Michigan, Ohio, and Arizona, while Mead Johnson’s operations are based in Michigan and Indiana. An essential marketing strategy employed by these leading firms involves not only selling products directly to retailers but also targeting physicians and other professionals.
On the other hand, manufacturer Nestlé, a later entrant to the US market and part of a Swiss parent company, lacks pharmaceutical retailing channels (Betson, 2009). Nestlé operates a single plant in Wisconsin, but its acquisition of another firm, Gerber, in 2007 resulted in a significant surge in the market share. While other minor players and various private-label brands produced by manufacturer Perrigo exist, their market presence remains much smaller in comparison.
Figure 1 presents the market share trends of leading IF manufacturers from 2006 to 2020 at the national level, highlighting the pronounced concentration of the market among the three leading manufacturers: Abbott, Mead Johnson, and Nestlé.
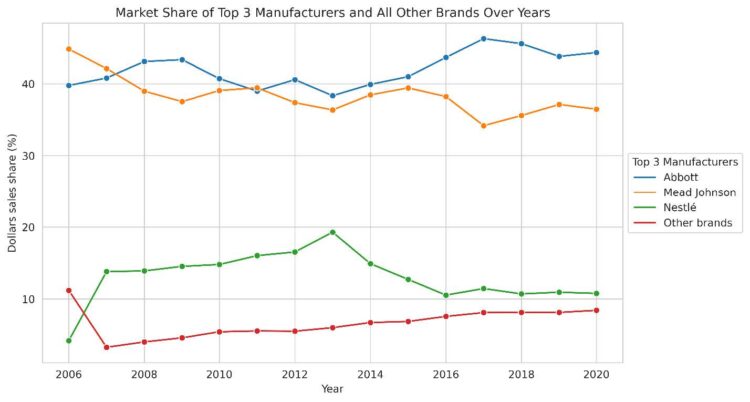
Figure 1: Sales market share of the top three manufacturers and all other brands from 2006 to 2020
While the total market shares of the two main manufacturers may appear similar at the national level, significant asymmetries emerge when examining state-level data. At this level, markets tend to be dominated by the winners of the WIC contract, leading to substantial variations. Figure 2 illustrates the annual sales shares of leading manufacturers from 2006 to 2020 in six states with the highest IF sales: California, Illinois, New York, Ohio, and Texas.
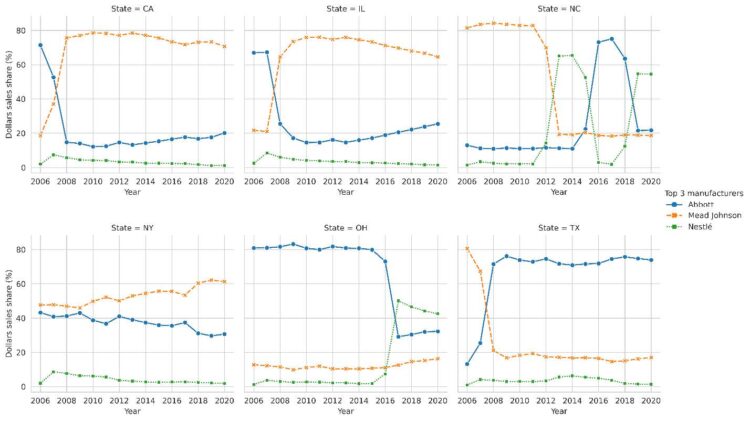
Figure 2: Sales market share trends of the top three Manufacturers in six states from 2006 to 2020
In these states, the market shares of manufacturers experience dramatic shifts as the WIC contract holder changes. For instance, in California, Abbott held a dominant 70% market share in 2006 when it was the WIC contract holder, while Mead Johnson only accounted for around 20% of the market sales. However, when Mead Johnson secured the WIC contract in 2007, its market share rapidly rose and reached 75% by 2008, while Abbott’s share declined to 15%. Similar patterns were observed in Illinois, where Mead Johnson won the WIC contract in 2008, leading to notable changes in market shares.
The WIC Program and Its Infant Formula Rebate System
WIC was established with the mission of providing vital supplemental food and nutrition resources to eligible pregnant, postpartum, and breastfeeding women, infants, and children. Over the years, WIC has grown into a major government program. In the fiscal year 2021, WIC stood as the third-largest food and nutrition assistance program, with annual federal expenditures reaching 5.0 billion, trailing only the Supplemental Nutrition Assistance Program (SNAP) and Child Nutrition programs (Jones et al., 2022).
Given its size, WIC agencies address budgetary concerns by requesting rebates from formula manufacturers through a competitive auction process. The winning manufacturer with the lowest net price (the difference between its lowest national wholesale price and rebate) gains the exclusive right to supply IF to WIC recipients in that state. Figure 3 provides a visual representation of how the WIC program operates. In the WIC program, the state agency reimburses WIC retailers the complete retail price paid by the participant, as evidenced in the transaction-level data directly obtained by WIC agencies. WIC participants access IF products from retailers using vouchers or WIC Electronic Benefits Transfer (EBT) cards. Non-WIC consumers, instead, are required to pay the full retail prices for the same products.
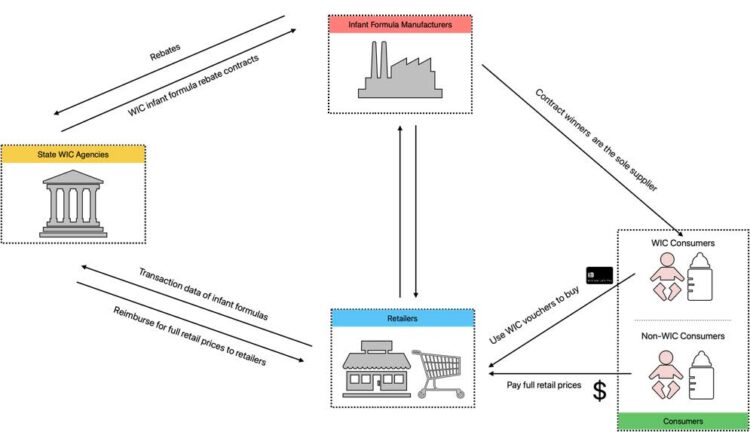
Figure 3: Illustration of the WIC rebate system
Discussion and Implications
The institutional and market framework outlined in this report sets the stage for a nuanced examination of the WIC program’s rebate system and its impact on government costs. The unit cost of supplying complimentary formula to WIC beneficiaries is captured by the formula:
Cost = Retail Price — Rebate
While manufacturers extend substantial rebates, often amounting to approximately 85% of their wholesale prices, there is no assurance that this will consistently translate into significant cost savings for the government. This is because the retail price, influenced by the vertical relationships between retailers and manufacturers, plays a pivotal role. My research investigates the influence of varying vertical relationships on their pricing strategies, the consequent government spending, and the derived surplus for consumers, manufacturers, and retailers.
¹Researcher(s)’ own analyses calculated (or derived) based in part on data from Nielsen Consumer LLC and marketing databases provided through the NielsenIQ Datasets at the Kilts Center for Marketing Data Center at The University of Chicago Booth School of Business. The conclusions drawn from the NielsenIQ data are those of the researcher(s) and do not reflect the views of NielsenIQ. NielsenIQ is not responsible for, had no role in, and was not involved in analyzing and preparing the results reported herein.
References
Betson, D. (2009). Impact of the WIC Program on the Infant Formula Market. No. 51, Washington, DC. U.S. Department of Agriculture, Economic Research Service. https://www.ers.usda.gov/publications/pub-details/?pubid=84543
Jones, J.W., S. Toossi, and L. Hodges. (2022). The Food and Nutrition Assistance Landscape: Fiscal Year 2021 Annual Report. Available at: http://www.ers.usda.gov/publications/pub-details/?pubid=104145 [Accessed July 1, 2023].
Oliveira, V., M. Prell, D. Smallwood, and E. Frazão. (2001). Infant Formula Prices and Availability: Final Report to Congress. Washington, DC. U.S. Department of Agriculture, Economic Research Service. https://www.ers.usda.gov/webdocs/publications/43025/35759_efan02001.pdf?v=6006.1
![]()
![]()
![]()
![]()
![]()