Employment and Investment Trends in Indiana Manufacturing
August 13, 2002
PAER-2002-8
David L. Brown, Research Associate and Kevin T. McNamara, Professor
![]()
![]()
![]()
![]()
![]()
The economy is emerging from a recession in which Indiana was listed as one of the two states most greatly affected (Alabama is the other). This determination was based on wage change, unemployment increase, and other factors* The impact has been large enough that the Indiana legislature has encountered difficulty balancing the state budget, and Indiana has experienced an increase of foreclosures and credit delinquency rates above U.S. rates** As jobs return to the state, Hoosiers are asking themselves what has changed. Will they be able to regain lost wages and employment, and what industries are likely to provide new opportunities?
Manufacturing Employment Changes
If past economic cyclical trends are an accurate guide, the manufacturing sector will most likely provide the opportunities that Hoosiers are looking for, because manufacturing has traditionally been an important source of employment and income in the Indiana economy. In accordance with a long-term trend, Indiana holds the distinction of having the highest percentage of manufacturing employment *** Furthermore, Indiana’s share of U.S. manufacturing employment was rising before the recession (Figure 1). In an increasingly global marketplace for inputs, manufacturers have greater site selection flexibility, and since 1982 Indiana has been regaining its share of U.S. manufacturing employment.
Figure 2 shows employment trends for the largest seven employment sectors in manufacturing. Chemical manufacturing (includes pharmaceuticals) is also shown, because it paid the highest average wage in 2000.
In the last few years, motor vehicles and equipment manufacturing gained the most new employment, making up for losses in the electrical and other electric equipment sector. Because of the growing importance of available support services from computer and data processing services, they are included in Table 1, which shows manufacturing employment change. Furniture, fabricated metal products, and chemicals manufacturing experienced growth in excess of 5% in these last three years of the decade. Printing and publishing was the only sector, aside from electrical, to show a decline in excess of 5%.
* Economic Policy Institute: Briefing Paper 9/2/2001
** Federal Deposit Insurance Corporation, Regional Economic Conditions
*** U.S. Dept of Commerce, Bureau of Economic Analysis Data shows that Indiana has the highest percentage of employment and highest percentage of gross state product in manufacturing, of any state in the country.
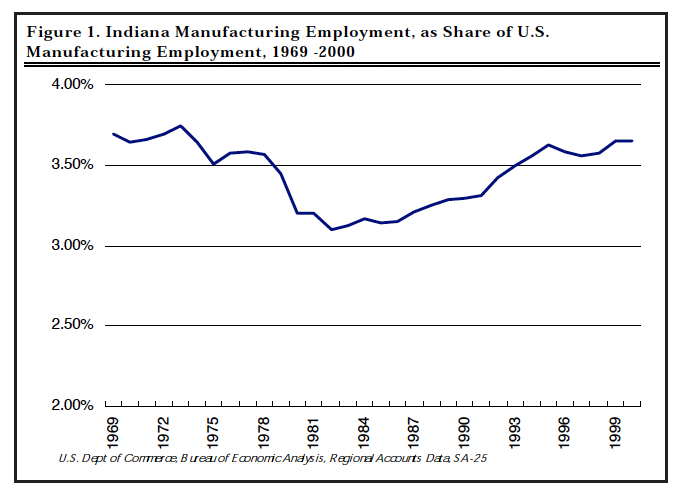
Figure 1. Indiana Manufacturing Employment, as Share of U.S. Manufacturing Employment, 1969 -2000
The overall employment growth in all economic sectors of the Midwest region did not exceed the national average. Indiana, Illinois, Michigan, and Ohio experienced employment growth of 5%, compared to the national growth rate of 7% during 1997 to 2000 (Table 2). Manufacturing activity in the United States decreased by 1%, whereas Indiana, Kentucky, and Michigan each gained 1% in manufacturing employment. Illinois and Ohio experienced slower growth and followed the U.S. decline in manufacturing employment (Table 2).
Kentucky showed the highest percentage growth in steel and automotive-related employment in the region but lost the greatest percentage of tobacco, textile, apparel, and energy products manufacturing employment. Indiana lost the highest percentage of electrical manufacturing employment and shared a slow [relative] growth rate in computer services employment with Michigan and Ohio.
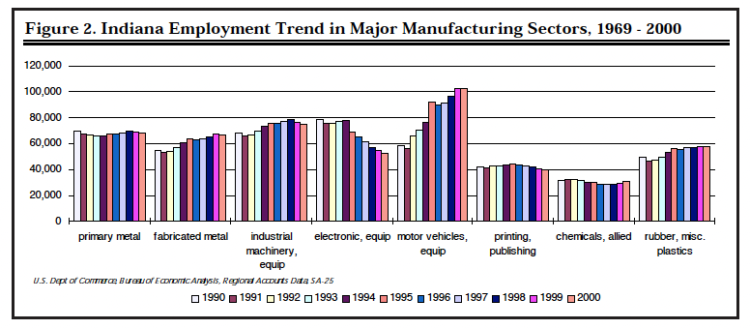
Figure 2. Indiana Employment Trend in Major Manufacturing Sectors, 1969 – 2000
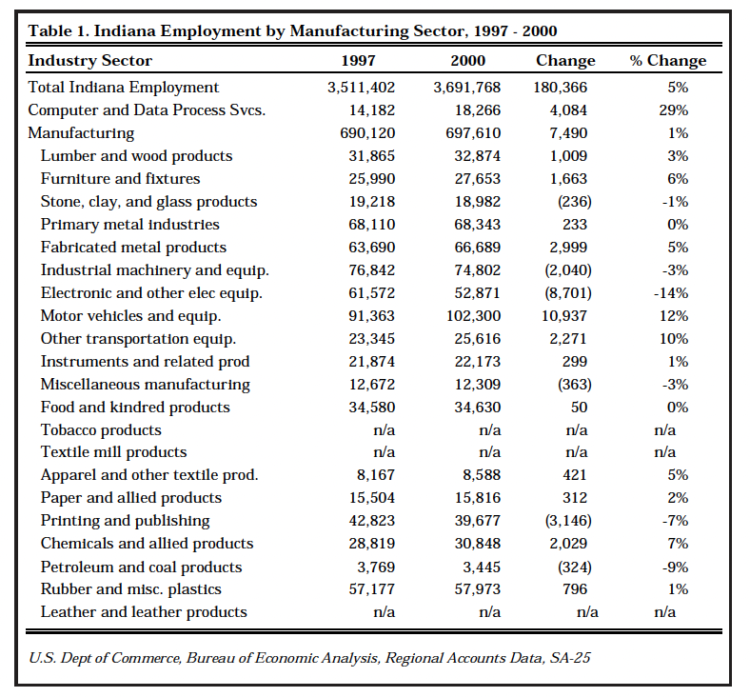
Table 1. Indiana Employment by Manufacturing Sector, 1997 – 2000
Employment Shift-Share Analysis
To assess the sources of employment change in Indiana manufacturing, it is useful to look at the shift-share changes that occurred through a recent time period. Shift-share analysis divides the number of jobs lost or gained during a time period into three parts. The total change in the number of jobs during the time period is equal to three components: Total Change in Employment = National Growth Component + Industrial Mix Component + Competitive Share Component.
Table 3 shows Indiana added 180,366 jobs from 1997 to 2000. At first glance this seems positive; however, the state would have created 73,186 more jobs, if statewide employment growth had matched the national rate of employment growth from 1997 to 2000. Had Indiana matched U.S. job growth through the period, instead of 180,366 new jobs, Indiana would have created 253,552 new jobs (Table 3).
In manufacturing the situation was better. The Indiana growth rate in manufacturing (1%) exceeded the national growth rate (-1%), thus, Indiana added 17,360 more jobs in manufacturing during 1997-2000 than it would have if the state had followed the national trend of losing manufacturing employment.
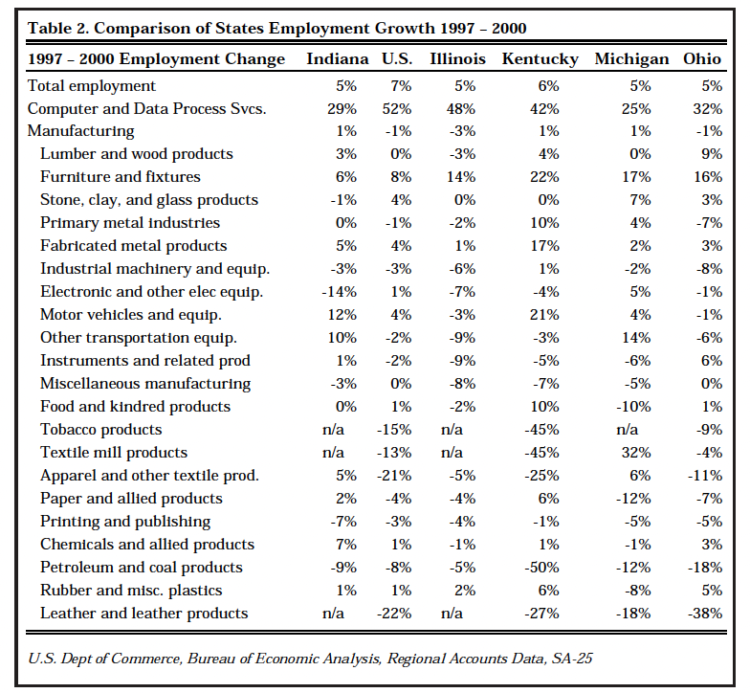
Table 2. Comparison of States Employment Growth 1997 – 2000
Local factors (competitive share component) resulted in 7,501 additional new jobs in motor vehicles and equipment, and 9,524 fewer new jobs in electrical and other electrical equipment.
Shift-share analysis indicates that manufacturing employment in the state restructured during 1997 to 2000, essentially from electrical-related to transportation-related manufacturing. The net growth of Indiana manufacturing employment was positive, affirming the ongoing importance of manufacturing to Indiana’s employment.
New Capital Investment Trend Long-term capital investment activity can indicate the direction of future manufacturing activity, assuming neutral inventory levels. The purchase of new equipment is based on expectations of future financial returns from the use of the capital item(s). New expenditures for machinery, tools, and equipment can be a positive sign for future output and employment.
Investment in Indiana manufacturing remains strong. The Corporation for Enterprise Development’s 2001 Development Report Card ranks Indiana’s manufacturing capital investment as 15th in the nation. In Indiana, manufacturers have continued a trend of increasing capital investments. After adjusting for inflation, the indication of a positive long-term trend of increasing investment activity in Indiana is apparent (Figure 3).
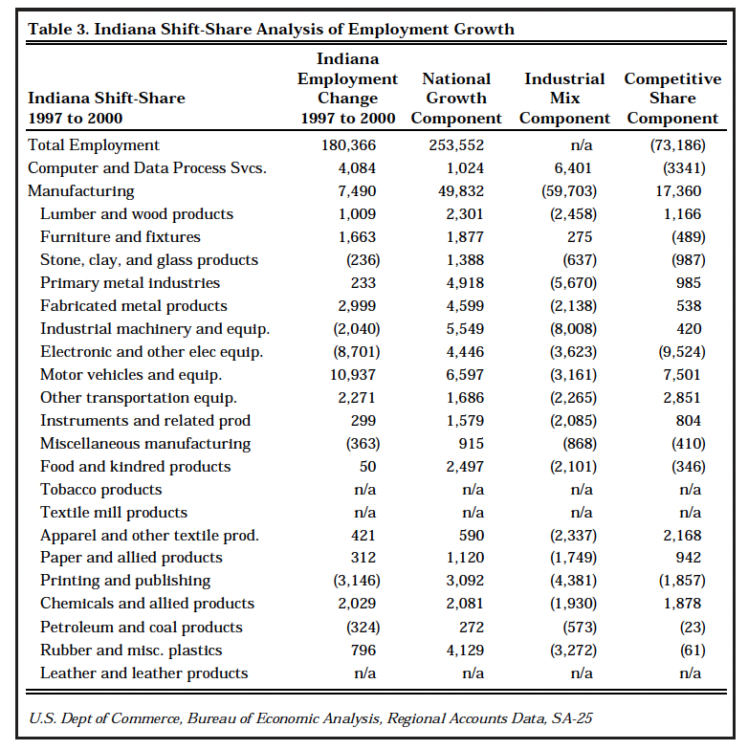
Table 3. Indiana Shift-Share Analysis of Employment Growth
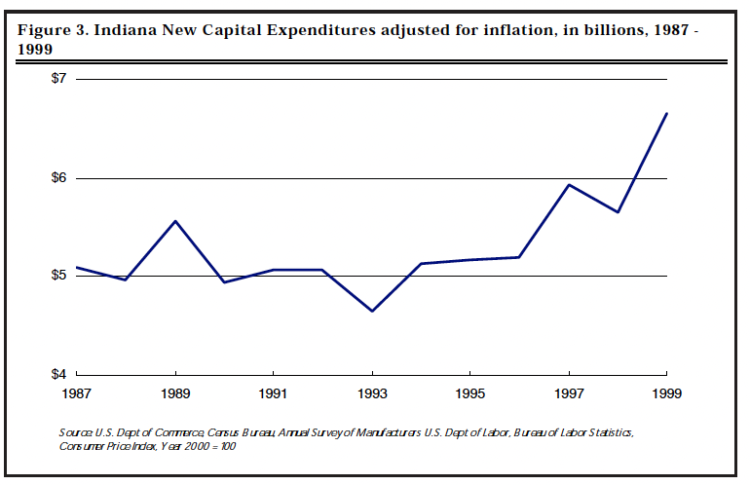
Figure 3. Indiana New Capital Expenditures adjusted for inflation, in billions, 1987 – 1999
Different manufacturing sectors experienced varying levels of new capital investment. Table 4 shows the new capital investment as a percent of value added, by manufacturing sector. A strong ongoing level of new investment throughout the 1980s and 1990s characterized the primary metals sector. Note that part of this new investment may reflect a trend toward new investment in (mini) mills that recycle metal.
Considering that Indiana is the most concentrated manufacturing state in the nation and that the level of reinvestment in manufacturing capital exceeds the national average, it appears that the state is in a good position to participate in the economic recovery.
Computer and data processing services is a key support sector for all industries, but the future is clouded by a deficiency in computer and data processing services employment. The Bureau of Labor Statistics category for computer and data processing services includes computer programming services, prepackaged software, computer integrated systems design, data processing and preparation, information retrieval services, computer facilities management, computer rental and leasing, computer maintenance and repair, and other computer related services, but it does not computer sales. Computer and data processing services are critical support services for all industries, including manufacturing, but Indiana has less than half of the national average of IT employment and is the lowest in the region, as seen in Figure 4.
Addressing this deficiency in computer services was one of the important recommendations from Batelle’s 2000 report on pillar industries**** DRI’s 1996 report***** explained how clusters of industry in an area benefit from economies of scale and how Indiana would benefit from a consortium of technology providers and services, with the innovations and technical expertise of the university system available to nearby industries. A Chicago Federal Reserve study****** shadowed this understanding by attributing the 1990s turnaround in manufacturing to advances in technology, which created substantial productivity gains. That report also recognized as a problem the fact that due to economies of scale, smaller manufacturing establishments need help in implementing technological advances and were less able to do so than their large-sized counterparts.
Increased implementation of flexible manufacturing in the automotive sector will mean that employment will increasingly be displaced from larger plants into small supplier firms and that Indiana could fall out of favor with manufacturing companies for failure to technologically advance. Without a sufficient mass of support services in computer and data processing, small firms’ ability to implement new technologies will be impaired. Indiana needs to find ways to provide technical assistance, grow the IT service sector, and provide a technically skilled workforce that is ready for the future, as larger numbers of small manufacturing firms in need of technological assistance emerge.
**** Nurturing Central Indiana’s Pillar Industries for 21st Century Midwestern Pre-Eminence, 2000
***** Blueprint for Economic Growth in Indiana, 1996
****** Assessing the Midwest Economy, 1997
Indiana’s increasing share of national manufacturing employment and positive capital investment trends suggest that the sector will again perform well in the immediate future, as the national economy emerges from the recession. The long-term outlook is tempered by the state’s lagging share of information technology professionals, and will be affected by its ability to sustain and/or increase capital investment. Future growth in manufacturing may depend in part on the degree to which manufacturing is able integrate new technologies into their operations. Firms’ ability to do this is linked the viability and availability of information technology support services.
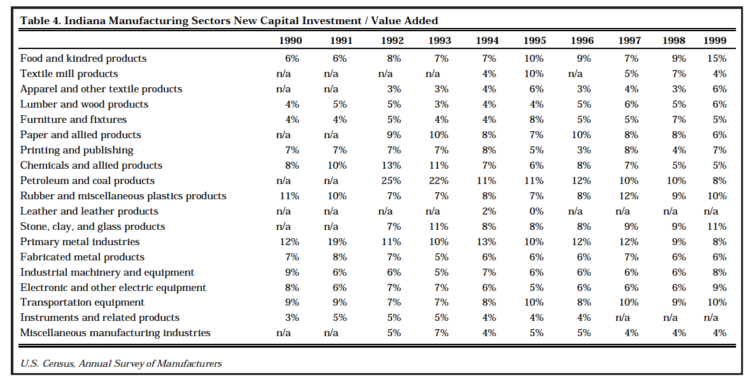
Table 4. Indiana Manufacturing Sectors New Capital Investment / Value Added
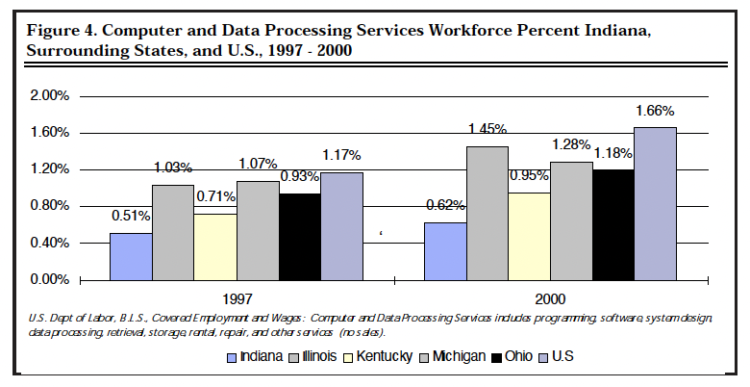
Figure 4. Computer and Data Processing Services Workforce Percent Indiana, Surrounding States, and U.S., 1997 – 2000
The National Growth Component represents the change in employment that would have occurred if a local industry had grown at the same rate as overall U.S. employment grew.
The Industrial Mix Component indicates whether an industry is a rapid growth or slow growth industry. If an industry has grown at a higher rate than the national economy, it is a rapid-growth industry; if it grew at a slower rate, it is a slow-growth industry.
The Competitive Share Component indicates whether the local economy is increasing or decreasing its share of national employment in an industry. A positive number indicates that a sector grew faster in the local economy than it grew in the national economy. A negative number indicates the sector grew slower in the local economy than in the national economy.
This analysis used employment data. Shift-share analysis can use income, establishment, or other data that measures the local economy.
![]()
![]()
![]()
![]()
![]()
