Ethanol Transforms Indiana Corn Uses
June 23, 2012
PAER-2012-05
Chris Hurt, Professor
![]()
![]()
![]()
![]()
![]()
Rapid growth of ethanol production in recent years has caused major changes in the uses of corn raised in Indiana. In 2006 there was one ethanol plant in the state. Today, there are 13 ethanol plants with capacity to produce just over 1 billion gallons annually. Indiana’s plants represent about seven percent of the country’s total ethanol production capacity. Most of the expansion occurred from 2007 to 2011, after the Energy Independence and Security Act of 2007 established the Renewable Fuels Standards II. That law mandates the use of conventional U.S. ethanol production to rise to 15 billion gallons by 2015.
In-State Users
In a few years, ethanol plants quickly became the number one destination for corn produced in Indiana. The single plant operating in 2006 used about 88 million bushels of corn running at capacity. Today, the 13 plants operating at capacity would require an estimated 381 million bushels.
Wet corn mills are the second largest user of corn in the state. Wet mills break down the corn seed into its four components: germ, hull, gluten, and starch. Corn oil is extracted from the germ, the hull and gluten are used for livestock feed, and the starch can be converted into sweeteners, starch products, or alcohol. Wet mills can thus manufacture high fructose corn syrup (HFCS), industrial starches, and ethanol if they choose. Because they break the seed into its component parts, they can be flexible in selecting their final products. In 2012 it is estimated that the five Indiana wet mills have the capacity to process about 213 million bushel of corn annually. The plants are in Hammond, Lafayette (two), Indianapolis, and Washington.
The third largest user of corn in Indiana is for animal feeding, which accounts for an estimated 186 million bushels in 2012. Hogs are the largest user, growing from 83 million bushels of used in 2005 to an estimated 104 million bushels in 2012. The amount of corn fed to poultry has also expanded somewhat in recent years to an estimated at 52 million bushels. Corn fed to cattle has stayed fairly constant, although the amount used by beef cattle has declined and the amount used by dairy cattle has increased. Table 1 provides estimated corn use by species groups since 2005.
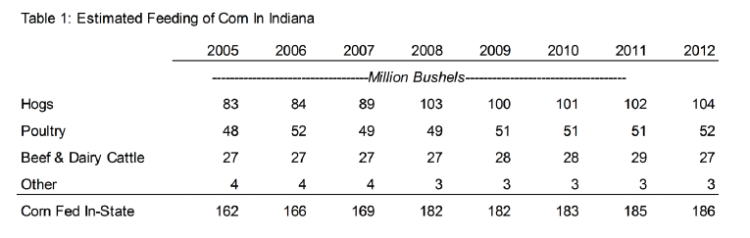
Table 1. Estimated Feeding of Corn In Indiana
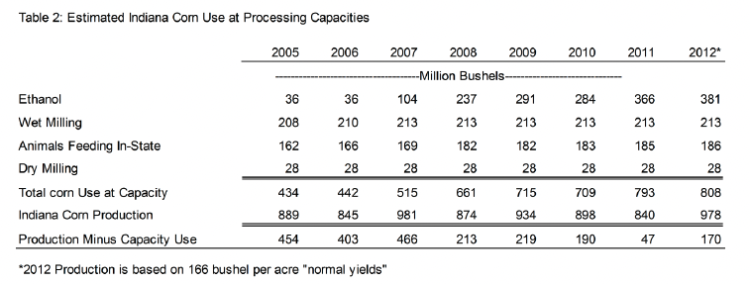
Table 2. Estimated Indiana Corn Use at Processing Capacities
Dry corn mills are the fourth largest in-state user. Dry mills grind the corn to make cereals, corn meal, corn flour generally for human products, corn products for pet foods, and some animal feed products. One plant in the state processes white corn for human consumption. There are four dry mills in the state with an estimated annual processing capacity of 28 million bushels.
Out-of-State Users
One of the biggest impacts of the rapid expansion of corn use for ethanol production has been on the out-of-state users of Indiana corn. Indiana has traditionally been a major excess producer of corn, meaning much more is produced than is consumed in the state, so that means moving corn to users outside of Indiana.
Corn may move in multiple directions out of the state. The largest single direction has been for feed use in the southeastern U.S. poultry and hog industries. Indiana corn also has traditionally moved into foreign markets via the Ohio River in Southern Indiana and to a smaller extent via the St. Lawrence Seaway through Lake Michigan ports. A small amount moves to the West Coast by rail in containers that are loaded on decks of ships for transit to Asian customers. Containers are especially used for high-value identity-preserved grains or soybeans that are using the backhaul capacity of containers that have come to Indiana from Asia containing goods such as car parts.
There is no official data available on grain movements in and out of Indiana, so that is estimated as shown in Table 2. This procedure simply takes each year’s production and subtracts estimated in-state corn use assuming processors operate at capacity. Those results suggest that in 2005 and 2006 a total of 400 to 450 million bushels of corn was available to be transported out of state. That meant that about one-half of Indiana corn production was moved to non-Indiana users. The astonishing growth of Indiana ethanol production in recent years means that corn available to be shipped out-of-state is less than 200 million bushels per year. In fact, in 2011, when Indiana production was low due to poor yields, there may have been no more than about 50 million bushels for out of state users if processors ran near capacity.
Summary
The rapid growth in Indiana’s ethanol industry between 2007 and 2011 means that more of the state’s corn stays inside the state for processing and that much smaller amounts are now available for out-of-state shipment. The amount of corn annually available to be shipped to users outside Indiana was estimated to be more than 400 million bushels in the mid-2000s, but now is less than 200 million bushels per year.
The ethanol industry in Indiana moved from a relatively minor user of corn in 2006 to become the largest user of corn as early as 2010. If 2012 corn yields were near normal, ethanol would use nearly 40% of the corn produced in the state. Wet milling of corn in-state is estimated to be the second largest user, representing about 22% of a normal 2012 crop. The animal industry in the state is the third largest user, representing about 19% of use. This leaves out-of-state users as the fourth largest user, representing only 17% of Indiana corn use. In contrast, out-of-state shipments were around one-half of Indiana corn use in 2005 and 2006.
The rapid expansion of ethanol has meant changes for the corn industry. Those include a shift toward more corn acres in Indiana, primarily at the expense of soybean acres and somewhat lower wheat acres. It has therefore changed farmers’ crop rotations, which were primarily 50/50 corn/soybeans, toward heavier concentrations of corn. By 2012 planted acreage of the two main crops had reached 55/45 corn/soybeans.
Larger acreage planted to corn has impacted rotations as producers are learning how to more effectively produce corn-on-corn. The fact that corn yields tend to be more than three times those of soybeans has meant a large expansion in grain handling capacity. The state’s permanent grain storage capacity has expanded by 207 million bushels since 2005, representing 20% additional capacity. On-farm storage increased by 110 million bushels, and off-farm by 97 million. More farmers have also added semi-trucks to haul corn to ethanol plants.
Finally, corn and soybean prices have been increased by the rapid expansion in ethanol production in two ways. First, because the ethanol movement was a national and global expansion that contributed to increased demand for corn, it helped increase prices across the country and globe. Second, ethanol sharply reduced the “excess production” of corn in Indiana. This served to increase local corn basis levels as well. These price enhancements were one of the primary contributors to higher farm incomes and higher farmland values.
Data References:
Acreage. USDA, NASS, ISSN: 1949-1522, June 29, 2012 and earlier issues. http://usda.mannlib.cornell.edu/MannUsda/viewDocumentInfo.do?documentID=1000
Grain Stocks. December issues. USDA, NASS. http://usda.mannlib.cornell.edu/MannUsda/viewDocumentInfo.do?documentID=1079
Cattle. Various issues. USDA, NASS. http://usda.mannlib.cornell.edu/MannUsda/viewDocumentInfo.do?documentID=1017
Hogs and Pigs. Various issues. USDA, NASS. http://usda.mannlib.cornell.edu/MannUsda/viewDocumentInfo.do?documentID=1086
Indiana Agricultural Statistics: Annual Summary. Various issues. Indiana Field Office, USDA, NASS,
![]()
![]()
![]()
![]()
![]()
