Evaluating Cooperation Between Hog Producers and Pork Packers
June 13, 2002
PAER-2002-6
Ken Foster, Professor; Joan Fulton, Associate Professor; Allan Gray, Assistant Professor; Elizabeth Beetschen, Graduate Research Assistant; and Suzanna Martin2, former Graduate Research Assistant
![]()
![]()
![]()
![]()
![]()
Changes in the hog industry over the past few years have altered the way packers and farmers relate to each other. Historically, the interface between packers and farmers could be characterized as an adversarial transaction. However, in the past decade the relationship between packers and larger-scale farms has become more cooperative as both parties are finding it increasingly important to manage risk and become more responsive to consumer demand. This article reports on research at Purdue University that analyzes how collective action by a cooperative of small-scale, independent producers could help them remain competitive. Various risk-sharing scenarios between producers and packers were analyzed to determine the potential for cooperation between a producer cooperative, consisting of small-scale producers, and a pork packer.
Net Present Value (NPV) of estimated cash flows was used to address the question of whether there are positive benefits to both the producer cooperative and the packer from these cooperative marketing arrangements. The producer cooperative is designed for use by small-scale pork producers and provides access to cost-reducing technologies that are difficult to independently implement in small-scale systems. On the marketing side, risk management implications of cooperative pricing strategies are identified.
The risk-return tradeoff is the basis for potential cooperation between the cooperative and the packer. If we examine only the level of prices, then there is no potential for cooperation because higher prices paid to farmers mean lower returns for the packer. However, net returns to packer and net returns to hog production are historically negatively correlated. This means that some sharing mechanism could generate a risk-reducing portfolio for both.
Hog Production Cooperative Model
A spreadsheet-based Hog Cooperative Simulation Model (HCM) was developed to estimate the expected net returns under various pricing strategies for a hog cooperative consisting of small-scale farms.3 The model estimates the packer’s expected returns (using a 12%discount rate on cash flows) under the various pricing strategies and the potential for cooperation between the packer and cooperative based on the associated risk and return trade-offs. The assumption made in this research is that individual producers will farrow sows in modified existing facilities and then transfer the weaned pigs to cooperative nursery and finishing units (see Figure 1). Individual producers are representative of small-scale producers who previously operated 150- to 300-sow farrow-to-finish units. By converting the existing farrow-to-finish facilities to specialize in farrowing, the producers gain greater access to cost-reducing technologies that have substantial economies of size.
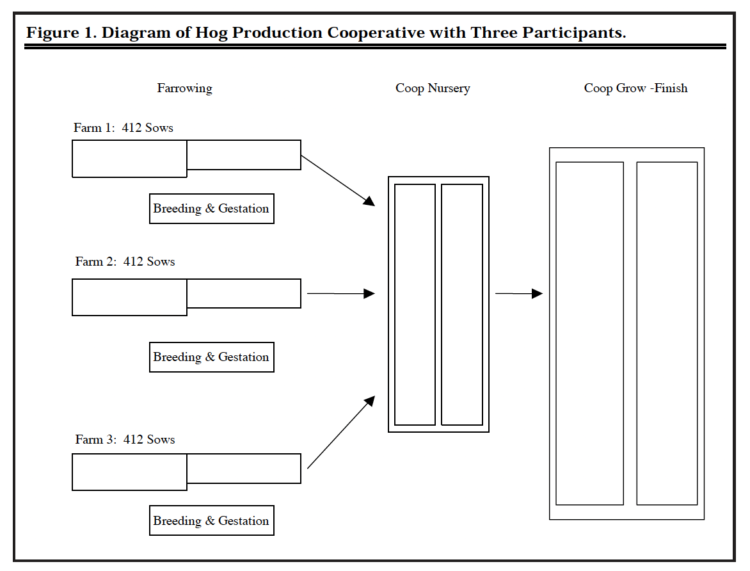
Figure 1. Diagram of Hog Production Cooperative with Three Participants.
The goal of the overall production scheduling was for the cooperative to mimic an operation with 1,236 sows that produces about 27,000 hogs per year, with each individual to supply the cooperative at regular three-week intervals.4 The production schedules were derived from the computer program PIGFLOW Version 2.2 (a space management and building capacity design software designed by Jones and Mayrose). The individual producer’s facilities can be converted to farrowing units. The research reported here assumes these were originally 150-sow farrow-to-finish units that were converted to farrowing units with 412 sows (see Chapter 13 in Boehlje et al. and Figure 1). Each of these farms acts as a farrowing room in a traditional system or two rooms, depending on whether the cooperative intends to farrow a group of sows every week or twice per week. To estimate the cost of conversion, a budget spreadsheet was adapted and updated from Boehlje et al. This model estimates the cost of converting existing nursery and grow-finish space to farrowing and gestation. However, the model assumes that the existing structures and equipment are fully depreciated and does not assign any interest or depreciation charge to that investment. As a consequence, some of the net return estimates may be high compared to those typically quoted for the industry, which include full capital recovery charges.
Six pricing scenarios were evaluated for the HCM. They include the hogs being sold on a standard carcass merit system, a component pricing system, wholesale component pricing with 50/505 risk sharing, component pricing with 60/40 risk sharing, component pricing with 40/60 risk sharing, component pricing with 75/25 risk sharing, and component pricing with 25/75 risk sharing. A list of scenarios and the acronym used to refer to each is shown in Table 1.
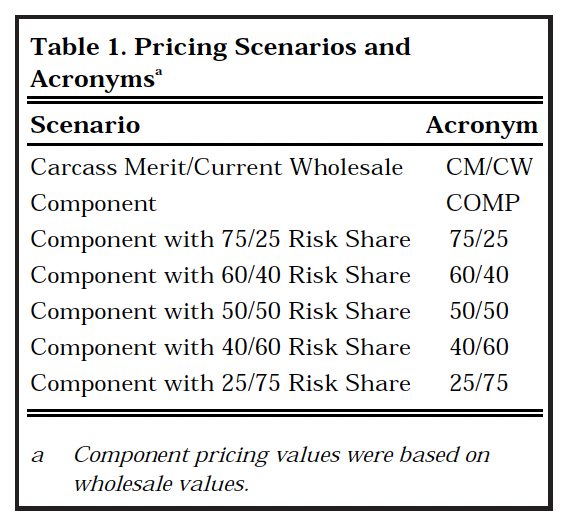
Table 1. Pricing Scenarios and Acronyms
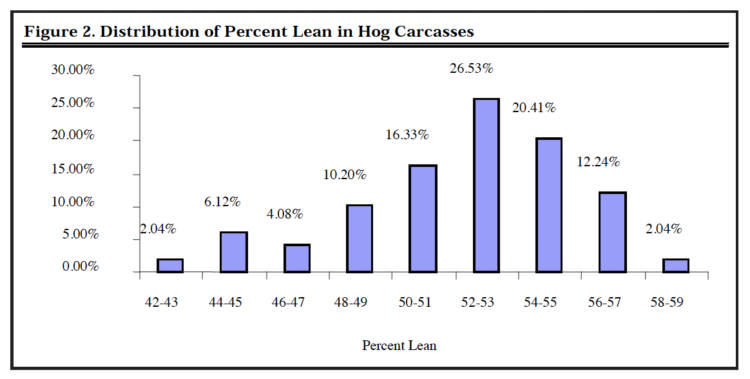
Figure 2. Distribution of Percent Lean in Hog Carcasses
Carcass Merit Cooperative
The carcass merit system bases payments on the percent lean and weight of the carcass. The data for percent lean were taken from the average of the 240 to 270 pound hogs in the Purdue Lean Growth Study and adjusted for changes in carcass composition that have occurred since the time that study was conducted. Based on the percent lean calculation, a bonus or premium was applied. If the hog is 50-percent lean or greater then the premium is equal to [(%Lean-50)*1.1 *Base Price]/100, and if the hog is less than 50- percent lean the discount is equal to [(%Lean-50)*1.5*Base Price]/ 100.6 The final per cwt price is: Price/cwt = Base price + Bonus or Discount, or per head the value is: Value/head = Price/cwt * (Hot Carcass Weight/100).
Once the value per head is determined for each category of percent lean, that value is multiplied by the number of hogs that fit into that category based on the histogram in Figure 2 derived from the adjusted Purdue Lean Growth Study data. For example, 26.53 percent of the population fit into the 52-53 Percent Lean category. Therefore, 26.53 percent of the hogs sold are allocated the value based on the midpoint of the range, or 52.5 percent lean. This process of determining the value for each category of hogs is repeated for all categories defined in the histogram. Then, summing all categories generates the total estimated receipts for the cooperative selling under such a program.
Component Cooperative
The next marketing strategy considered for the cooperative is component pricing. This type of pricing computes the value of the animal as the sum of the wholesale market values of all of the cuts and byproducts based on wholesale market prices and the average adjusted weights of 248 pound pig) was subtracted.7 For the COMP scenario, the cooperative’s net return is the wholesale value of the hogs minus the sum of the packers processing costs and the farm level production expenses of the cooperative producers. When the risk-sharing scenarios are analyzed, the cooperative’s and the packer’s net returns are their respective shares of the wholesale value minus the sum of the packer’s and the cooperative’s costs.
For example, if the risk share agreement is 50/50, then wholesale value minus the sum of the processing cost and the cooperative’s production cost is divided in half, and the net return to the cooperative would be 50 percent of the total net value over all system costs. This process is done similarly for all risk sharing scenarios listed in Table 1, by adjusting the percentages.
The Packer’s Returns
Packer risks and returns were also approximated for all of the pricing alternatives discussed for the cooperative. Examining the alternatives from both perspectives is essential for evaluating the potential for cooperation. When hogs are sold by the cooperative on a carcass merit system, the packer is assumed to sell the meat on a wholesale basis. The calculation for wholesale returns begins with the wholesale carcass (component) value minus the cost of processing. In addition, the packer must also pay the cost for purchasing the hogs. This is simply the cost that was calculated for gross receipts to the cooperative under carcass merit pricing. The calculation of packer net returns under component pricing with risk sharing is the same as for the cooperative described above. Alternatively stated, the packer’s net return is total wholesale value net of both party’s costs minus the cooperative’s share.
Results
The spreadsheet allowed the prices of hogs, carcass components, corn, and soybean meal to vary according to their historic values between 1980 and 1999.8 To approximate the price patterns of the four-year hog cycle, prices for intervals of eight consecutive years were drawn randomly with replacement from all possible eight-year intervals.9 A total of 1,000 random draws were made, and net cash flow for each of the eight years and each scenario was calculated. The net cash flows were then dis-counted and summed to obtain 1,000 eight-year horizon NPV estimates. The statistical characteristics of these simulated NPV’s are presented in Table 2 for both the cooperative and the packer.
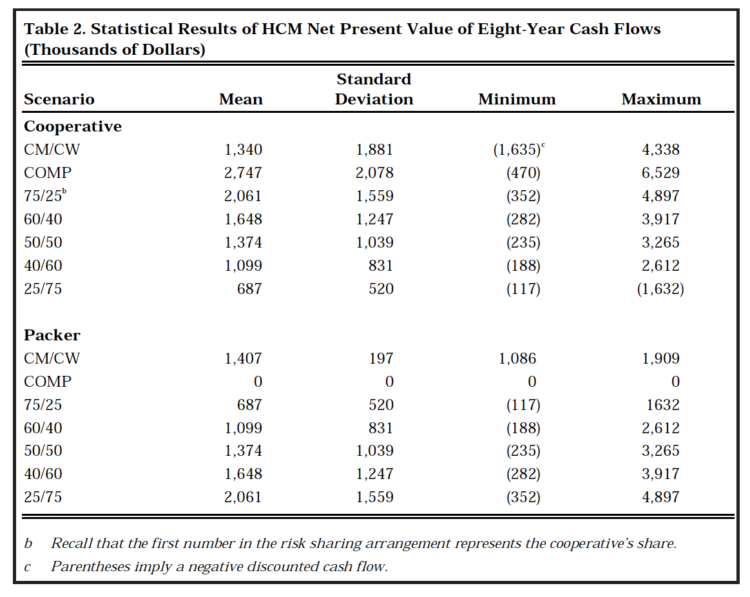
Table 2. Statistical Results of HCM Net Present Value of Eight-Year Cash Flows (Thousands of Dollars)
The 40/60 risk sharing and 25/75 risk sharing both have fairly low average NPV’s for the cooperative, but these scenarios generate lower standard deviations (less risk). This might be indicative of pricing strategies that smooth income over time for the cooperative, and cooperative members might choose such strategies to manage risk. At the same time, COMP possesses the highest mean but also the highest standard deviation (greatest risk) for the cooperative. It is also interesting to notice that CM/CW, which is the pricing strategy most commonly used in the industry today, has a fairly high mean but also a high standard deviation (much risk). In addition, the range of possible outcomes under the CM/CW scenario is quite wide. From these statistics, a more risk-averse cooperative membership would prefer a pricing strategy that receives at least some of the whole-sale value of the pork cuts.
From the packer standpoint, CM/CW has a moderate to low average NPV and has a low standard deviation (low risk). Table 2 shows the minimum expected for the packer to be quite high under CM/CW, suggesting that this alternative has little downside risk for the packer. The 25/75 risk sharing arrangement has the highest mean but also the highest standard deviation (greatest risk) for the packer.
The next step in the analysis was to rank the alternatives from the perspective of a cooperative and a packer with varying degrees of risk aversion. Six different degrees of risk aversion were evaluated ranging from risk neutral to extremely risk averse. The derived rankings of the pricing scenarios for the cooperative and the packer are shown in Table 3.
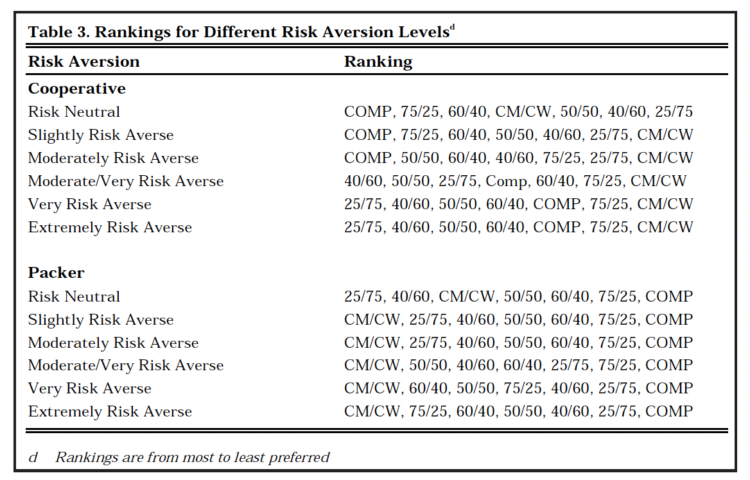
Table 3. Rankings for Different Risk Aversion Levelsd
These rankings reflect the optimal risk and return (standard deviation and mean) tradeoffs for entities with the implied risk preferences. For example, for a risk-neutral to slightly risk-averse cooperative, COMP is the preferred alternative, followed by 75/25 risk sharing and 60/40 risk sharing, because they have the highest mean discounted cash flows and the risk neutral cooperative is not concerned with the risk. The very and extremely risk-averse cooperatives would prefer to transfer a substantial part of the risk to the packer, and are willing to compensate the packer by taking only a small share of the component value under the 25/75 risk-sharing approach. For the risk neutral-packer, the 25/75 risk-sharing arrangement is also the most preferred scenario.
However, for every other level of risk aversion, the CM/CW scenario is the most preferred by the packer. This is not surprising, because the discounted cash flows are never expected to go below zero for CM/CW.
Conclusions
This research reveals potential for cooperation between a hog production cooperative and packer. A carcass component pricing approach with risk sharing that awards 25 percent of the wholesale carcass value (net of system costs) to the cooperative and 75 percent to the packer is a preferred arrangement for an extremely risk-averse cooperative membership and a risk neutral packer. At the same time, slightly risk-averse to extremely risk-averse packers are shown to prefer the traditional method of pricing, but, for the slightly to moderately risk-averse packer, the 25/75 approach ranked second. Past research suggests that publicly traded firms such as some of the large packing companies are likely to behave in a risk-neutral fashion, while pork producers, still reeling from the low prices of 1998 and 1999 and facing declining prices in 2002, are probably quite risk averse. Consequently, we believe there is substantial room for cooperative strategies in today’s pork industry. In fact, such cooperation has already emerged to a degree in the form of producers who are willing to sign production contracts with packers that guarantee a relatively low payment with very little variation. Adoption of contracting is often motivated by a lender who refuses to provide financing to farmers without a contract. In such cases, the risk aversion of the lending institution is motivating the change in structure.
In addition, the cooperative always prefers to receive at least some of the component/wholesale value, because traditional carcass merit pricing was the least preferred scenario for every level of risk aversion. In fact, carcass merit pricing was easily dominated by direct component pricing whereby the cooperative retains 100 percent of the wholesale value and incurs the packer’s costs as a toll slaughter charge. The direct component alternative for the cooperative can also be viewed as the potential gains and “best” case scenario for producer cooperative ownership of a pork slaughter plant, suggesting that downstream ownership is an option that producers should examine. However, in an earlier paper, Maung and Foster suggested a cautious approach to this decision due to the great uncertainty in the pork industry and concerns about market power among existing packers.
References
Boehlje et al. 1995. Positioning Your Pork Operation for the 21st Century. ID-210. Purdue University Cooperative Extension Service, West Lafayette, IN.
Jones, D. and V. Mayrose. 1994. “PIGFLOW Version 2.2: A Computer Program to Swine Production Schedules Based on Pork Industry Handbook Factsheet Number 113.” Purdue University Cooperative Extension Service, West Lafayette, IN.
Martin, S. 2000. Cooperation between Hog Producers and Pork Packers. Master of Science Thesis, Department of Agricultural Economics, Purdue University, West Lafayette, IN.
Maung, A. and K. Foster. 2001. “The Value of Waiting to Invest in a Cooperative Hog Slaughter Plant,” Purdue Agricultural Economics Report, September 2001.
McDonald, J.M. and M.E. Ollinger. 2000. “Scale Economies and Consolidation in Hog Slaughter.” American Journal of Agricultural Economics, Vol. 82, pp. 334-46.
Purdue Swine Lean Growth Study, 1991. Department of Animal Science, Purdue University, West Lafayette, IN.
- This research was funded by the USDA RMS-Cooperative Services, Cooperative Marketing Division through Cooperative Agreement RBS-99-14.
- Suzanna Martin is currently an Extension Specialist with the University of Kentucky.
- Further details of this cooperative can be found in: Martin, S. 2000. Cooperation between Hog Producers and Pork Packers. Master of Science Thesis, Department of Agricultural Economics, Purdue University, West Lafayette, IN.
- The system can easily be expanded in multiples of 600 and 1200 sows to mimic even larger operations and to include more farms. However, as the number of farms increases the system becomes less manage-able due to the relationship and production risks inherent in larger groups.
- The first number represents the share the cooperative receives, and the second number is the share the packer receives.
- Based on information obtained from a collaborating packer.
- The processing cost estimate was based on the research of McDonald and Ollinger.
- The prices were deflated to 1999 values.
- To avoid over sampling data in the middle years of the sample period, the intervals were looped from the end of the sample back to the beginning such that one possible draw from the historical distribution of prices might have been 1997,98,99,80,81, … , 84 for example.
- This analysis did not include the possibility of selling hogs on a carcass merit program and hedging in the futures and/or options markets as a means to manage risk.
![]()
![]()
![]()
![]()
![]()
